
Gastronome Gander's Gatherings
Executive Summary
Gastronome Gander’s Gatherings, Inc. is a new small business aimed at providing social functions to professional single adults, our members in the greater Gourmandeville area. The functions tend to be focused around food. The events are held in other business establishments and may be indoors or out depending on the type of event. The events may range from sit-down dinners, to wine tastings, to cooking classes, and may include trips. One major difference between Gastronome Gander’s Gatherings and other singles groups is that ours is a social group, with no match-making or other related dating pressures. Gastronome Gander’s Gatherings was started near the end of last year and expects to kick off events in early in Year 1 and to have three events per month by the end of this year.
The Market
Gastronome Gander’s Gatherings will target a distinct market segment of the population; single people in their late twenties to late fifties in age. In addition, we are marketing three geographical areas, Gourmandeville, the South Downes, and Washbourne. Gastronome Gander’s Gatherings events must be well run, upscale, and appealing to the members.
Key to Success
Gastronome Gander’s Gatherings has identified four keys to success, which will be closely monitored. The first is to provide excellent quality events. The second is to develop and keep a good reputation through customer service and integrity with other business establishments. Third, we will provide a variety of events to meet member expectations. Lastly, our events will be upscale, relaxing environments, without match-making pressures.
Management
Gastronome Gander’s Gatherings is owned and operated by Trencherman Gander. Trencherman is college educated, has run a consulting business in the past, lives in Gourmandeville, and has a good knowledge of food, wine, cooking, and travel.
In addition to Trencherman, a professional team of consultants and professional people experienced with a similar membership dinner group, Restaurant Raconteurs of Cookeston, include an attorney, an accountant, a Web Master, a writer/marketing specialist, and the president of Restaurant Raconteurs of Cookeston.
Financials
Gastronome Gander’s Gatherings has made conservative forecastes of gross revenue for the three years of this plan. Our expected net profit margins for years two and three will be 16 and 32 percent, respectively. Gastronome Gander’s Gatherings is an exciting alternative to other similar companies and we expect to leverage our unique difference into a sustainable company.

1.1 Objectives
- Become Gourmandeville’s and Washbourne’s premier singles social group.
- Achieve a customer satisfaction rate of 80 percent (i.e., membership renewal).
- To have a growth rate of 20 new members per month.
- Achieve gross revenues of $25,000 during the twelve months after the initial kick-off event.
1.2 Mission
Mission Statement: Gastronome Gander’s Gatherings, Inc.’s mission is to provide the best social events for single people without matchmaking hassles. This goal will be achieved through reasonable pricing, outstanding customer service, and predictive/consistent services.
1.3 Keys to Success
- Our commitment to providing excellent quality events, including great food and beverages, at all times.
- Maintaining a reputable and untarnished reputation in the community.
- Providing popular and wide-ranging entertainment activities.
- The creation of a unique, innovative, upscale atmosphere that will create an environment that won’t intimidate a person during their initial event meeting.
Company Summary
Gastronome Gander’s Gatherings is a new small business aimed at providing social functions to professional single adults, our members in the greater Gourmandeville area. The events tend to be focused around food. The events are held in other business establishments and may be indoors or out depending on the type of event. The events may range from sit-down dinners, to wine tastings, to cooking classes, and may include trips. One major difference between Gastronome Gander’s Gatherings and other singles groups is that ours is a social group, with no match-making or other related dating pressures.
Gastronome Gander’s Gatherings was started near the end of last year and expects to kick off events in early Year 1 and to have three events per month by the end of this fiscal year. Trencherman Gander (President) is college educated with multiple degrees, has previously operated a consulting business, has lived in Gourmandeville for two years, and has a good knowledge of food, wine, cooking, restaurants and travel.
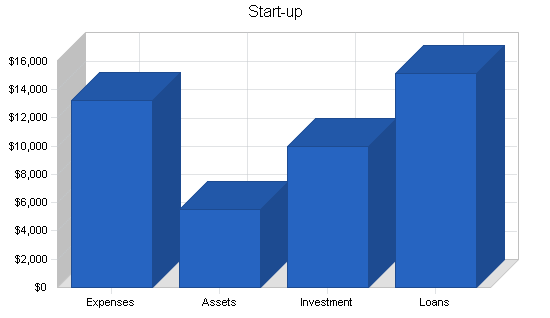
2.1 Start-up Summary
Total start-up expenses, including legal costs, office furniture, computer, printer, digital camera, website development, software, logo design, marketing, contracted writer, artist, and related expenses are shown below. We also have initial cash to handle the first few months of operations and kick-off events (which will be free) as memberships and event income develop the cash flow.
All events will be held in various venues. Gastronome Gander’s Gatherings will be a home office, with dedicated space, telecomm and Internet service within the owner’s home.
The owner will invest in the business. A short-term loan will be negotiated for the balance of the start-up funding.
| Start-up | |
| Requirements | |
| Start-up Expenses | |
| Legal | $1,000 |
| Office Supplies | $500 |
| Software | $750 |
| Web Master | $500 |
| Logo Design | $1,000 |
| Website Design | $1,500 |
| Marketing Content Writer | $750 |
| Telecomm & DSL Setup | $100 |
| Website Hosting Setup | $60 |
| Graphic Artist | $750 |
| Computer | $4,000 |
| Digital Camera | $400 |
| Color Laser Printer | $700 |
| Office Furniture | $858 |
| Other | $364 |
| Total Start-up Expenses | $13,232 |
| Start-up Assets | |
| Cash Required | $5,500 |
| Other Current Assets | $0 |
| Long-term Assets | $0 |
| Total Assets | $5,500 |
| Total Requirements | $18,732 |
| Start-up Funding | |
| Start-up Expenses to Fund | $13,232 |
| Start-up Assets to Fund | $5,500 |
| Total Funding Required | $18,732 |
| Assets | |
| Non-cash Assets from Start-up | $0 |
| Cash Requirements from Start-up | $5,500 |
| Additional Cash Raised | $6,384 |
| Cash Balance on Starting Date | $11,884 |
| Total Assets | $11,884 |
| Liabilities and Capital | |
| Liabilities | |
| Current Borrowing | $15,000 |
| Long-term Liabilities | $0 |
| Accounts Payable (Outstanding Bills) | $116 |
| Other Current Liabilities (interest-free) | $0 |
| Total Liabilities | $15,116 |
| Capital | |
| Planned Investment | |
| Owner — Trencherman Gander | $10,000 |
| Investor 2 | $0 |
| Other | $0 |
| Additional Investment Requirement | $0 |
| Total Planned Investment | $10,000 |
| Loss at Start-up (Start-up Expenses) | ($13,232) |
| Total Capital | ($3,232) |
| Total Capital and Liabilities | $11,884 |
| Total Funding | $25,116 |
2.2 Company Ownership
Gastronome Gander’s Gatherings, Inc. is an S corporation. The law firm of Capon & Briencroute completed and filed the articles of incorporation. IRS form SS-4 indicating that Gastronome Gander’s Gatherings, Inc. is an ‘S’ Corporation and applying for an Employer Identification Number (EIN) was filed by Larry W. Boeuff of Moutton & Boeuff, P.C. The EIN was assigned by the IRS late last year.
Gastronome Gander’s Gatherings, Inc. a private S corporation is solely owned by Trencherman E. Gander.
Services
Gastronome Gander’s Gatherings will provide customers with fun events that provide a relaxing atmosphere, great food, wine, excitement, all while forming lasting friendships at affordable prices.
Although there is currently no exact competition in the immediate area in which we plan to establish our events, there are numerous similar groups. The other singles groups are mostly involved with matchmaking or dating services. The social types are geared for specific reasons, e.g., religous groups and environmental groups.
In meeting our goals, the company plans to become profitable and retain a solid leadership position in the marketplace by providing:
- Quality events – Better rated restaurants, upscale wine tastings, and culinary classes.
- A wide variety of activities – Sit down dinners, cooking classes, outdoor events, and travel.
- Aggressive marketing and networking – Press releases, radio presentations, brochures, ads, and other types of media.
- Customer satisfaction – Personally greeting people at events, name tags, designated greeters for new people, e-mail confirmations with directions.
Market Analysis Summary
Gourmandeville’s population is 687,708 and the surrounding area (the South Downes) has 631,985 people. The city of Gourmandeville has recently been rated as the number one singles city in the nation by Fibbes Magazine. In addition, Gourmandeville has a high number of restaurants per capita as well as wineries, and a culinary school. Approximately 61 percent of the population is between the ages of 25 and 60. Annual household incomes indicate that 70 percent are above $35,000. Moreover, 31.1 percent (or 410,424 people) fall into occupational categories of professional/technical or proprietor/managerial.

Within the South Downes population, approximately 55 percent are single, 40 percent are between the ages of 25 and 60, and 50 percent have incomes greater than $35,000. Thus, the population of interest to Gastronome Gander’s Gatherings is 69,518.
Washbourne, has a population of 1,144,646. Of these approximately 52 percent are single and 40 percent are within the ages of 25 – 60; for a population of 238,086. About 50 percent have incomes greater than $35,000; thus the population of interest to the company is 119,043.
Members from other Gastronome Gander’s Gatherings groups have noted that one reason they belong is the social aspect being offered without the match-making pressure. In addition, they note the respect for privacy by only using first names and not releasing any personal data.
4.1 Market Segmentation
The market for Gastronome Gander’s Gatherings is single adults in their late twenties to late fifties. These singles should be of above average income and generally they have some college education or degrees. We aim our events at people who have disposable income and enjoy spending that money on their entertainment.
While we have indirect competition with other singles groups, we believe that their focus tends to be on match-making/dating or they have a specific focus such as religion or nature (e.g., Sierra Club’s singles group).
The market analysis table was derived by finding the populations for each area (Census data) then determining the percentage that are single. Next, based on the census data an estimate of the number that are in the appropriate age bracket a figure was calculated. Lastly, an estimate of income was performed to derived the final figure. For example, in Gourmandeville the total population is 687,708, where approximately 61 percent are single or 419,502. Of these approximately 45 percent are between ages 25 and 60, or 188,776. Lastly, 70 percent have an income greater than $35,000 for a total of 132,143 people.
(Growth rates were estimated from individual city data.)

| Market Analysis | |||||||
| Year 1 | Year 2 | Year 3 | Year 4 | Year 5 | |||
| Potential Customers | Growth | CAGR | |||||
| Single population in Gourmandeville & income >$35K | 3% | 132,143 | 136,107 | 140,190 | 144,396 | 148,728 | 3.00% |
| Singles population in South Downes & income >$35K | 4% | 69,518 | 72,299 | 75,191 | 78,199 | 81,327 | 4.00% |
| Single population in Washbourne & income >$35K | 2% | 119,043 | 121,424 | 123,852 | 126,329 | 128,856 | 2.00% |
| Total | 2.85% | 320,704 | 329,830 | 339,233 | 348,924 | 358,911 | 2.85% |
4.2 Target Market Segment Strategy
Recognizing that our market groups (Gourmandeville, South Downes, and Washbourne) are distinct, the company will adopt different strategies for reaching each. While all three groups like outdoor activities there are area differences.
Known for its casual and playful nature, Gourmandeville is the playground of our area. Situated at the center of the region, it stands as the gateway to the South Downes and the Thirty Lakes district. As the state capital and home to the University, the city supports a politically charged and culturally rich environment. Gourmandeville is hip, trendy, and high-tech. A large creative population—primarily musicians and artists—enhance its eclectic nature. Thus, our market philosophy realizes that people in Gourmandeville tend to be very casual in their leisure time activities and like new/trendy events.
Washbourne is the ninth largest city in the nation; the city has retained its sense of history and tradition. Sounds and flavors of Native Americans, Old Mexico, Germans, the Wild West, African-Americans, and the Deep South mingle and merge here. Close to eight million visitors a year delight in the discovery of Washbourne’s charms. People in the Washbourne area are surrounded by history, tourism events, places, and visiting people. Moreover, Washbourne’s major industries are aerospace, bioscience/health care, hospitality, information technology and the military. Washbourne tends to reflect more conservative ideals than Gourmandeville. With professional sports teams in Washbourne, there is added competition for leisure dollars.
The South Downes can be described as numerous smaller towns (45 cities) and a large land area (14,000 square miles). There are numerous rivers and lakes within the hills west of Gourmandeville and north west of Washbourne. The people here love the outdoors and tend to be conservative. This population is casual in their dress and tend to travel less than Gourmandevillers.
(Source: Chambers of Commerce for each area)
4.3 Service Business Analysis
While many singles groups or matchmaking concerns have grown in the past few years, especially with the advent of the Internet, many singles do not want the pressure of matchmaking at each social event. For a multitude of reasons, there is the common thought that single people in our membership’s age range (late twenties to late fifties) should not have a problem meeting people. However, after college meeting other singles can become more difficult, and for people who were married, many have lost contact with other singles (or their single friends have married). Therefore, the concept of meeting other singles at a strictly social function can be appealing. In addition, for those singles who do not wish to enter into long-term relationships (e.g., marriage) this type of event can provide the social interaction they are looking for.
On a broader note, the City of Gourmandeville is well known for supporting the local businesses over national chains. In the city’s marketing and advertising this theme comes across. While not a major factor in business success, this limited type of promotion can be helpful.
4.3.1 Competition and Buying Patterns
On the Internet, various websites can be found promoting singles groups, such as Gourmandeville Singles: http://www.singlesonthego.com/gourmandeville/ and http://gourmandeville.about.com/cs/singles/. These websites provide listings for numerous singles groups. These include Toastmaster, Gourmandeville Jaycees, singles sports groups (e.g., running, skiing, biking, sailing, golf , though not all sports groups are not strictly for singles), religous groups (Catholic, Christian, Jewish), dance groups, speed dating, travel group, single parents, and singles over 50.
Gourmandeville Midlife Singles: A club for the 40 to 60 years old crowd. As noted on their website: ‘This club is for single, decent, middle-class Americans of all ethnic groups between the ages of 40 and 60 who want to meet other singles of same age within a social environment for socializing, dating, friendships, but especially for people looking for meaningful long-term relationships.’ http://gourmandville.about.com/gi/dynamic/offsite.htm?site=http%3A%2F%2Fwww.gourmandevillemidlifesingles.com%2F
Metrodate (http://www.metrodate.com/gourmandeville/) Gourmandeville Solosingles (http://www.solosingles.com/singlesgourmandeville/go.htm) Gourmandeville singles/Gourmandeville swingers (http://www.nasingles.com/rg/gourmandeville-singles.htm) and others are Internet dating services.
While most seem geared to matchmaking, some are more social such as the Gourmandeville Sierra Singles (http://sierraclub.org/gourmandeville/singles.html).
Most singles groups are aimed at dating/matchmaking. The few that are not, tend to be quite specific in their interest (e.g., sports, religion, nature). Thus, there does not appear to be any specific direct competition with Gastronome Gander’s Gatherings. However, this lack of direct competition does not mean that we do not have other groups to worry about for leisure dollars. We must market our group for its specific differences to attract people who:
- Are tired of the dating pressures.
- Just want to socialize.
- May not be interested in marriage.
Note that ‘Gourmandeville Singles’ is an escort service. We do not consider this type of company to be our competition.
Strategy and Implementation Summary
Emphasize service
Gastronome Gander’s Gatherings is a service company. Thus, we will differentiate ourselves with customer service. We will establish our event offerings as a clear and viable alternative for our target market, a clear difference from the scores of single dating services.
Build a relationship-oriented business
Build long-term relationships with customers. Gastronome Gander’s Gatherings will become our member’s choice for events in a relaxing atmosphere; a better way to meet other singles.
Focus on target markets
We need to focus our events and membership on specific population groups as the key market segment we should own. We do not want to compete for the dating/matchmaking crowd, but to offer an alternative to that scene; and as a supplement to those who use dating services.
5.1 Competitive Edge
Gastronome Gander’s Gatherings’ competitive edge lies with its differences from other single organizations. These differences added together make us unique and include:
- Upscale events related to food and wine (with a high degree of variety)
- No match-making or dating (no pressure on members)
- Extensive customer service (e-mail event directions, personal greetings at events, name tags, follow-up on all questions/problems)
5.2 Marketing Strategy
The main objective of our strategy is to position Gastronome Gander’s Gatherings as the premier niche singles’ social event provider serving the Gourmandeville, South Downes, and Washbourne markets. The marketing strategy will seek to create customer awareness regarding the services offered, develop the customer base, and work toward building customer loyalty and referrals.
This objective will be communicated using several different methods. The first method will be through the use of Gastronome Gander’s Gatherings’ website. The website will be a rich source of information detailing our events offered, previous events held, links, etc. The second method of communication will be through networking with various media and business people. The networking activities will be important and fruitful as a significant amount of business gets conducted through these channels. By being active in networking we believe our membership will increase, our events will be better recognized, and our reputation as a superior provider of single social events will become known.
The last method of communication will be through written promotional material. Brochures, business cards, press releases, e-mails, and the like are an excellent venue for generating awareness of the company because most or all the material stays with individuals for a time (versus verbal material that is not physical). Moreover, much of this material can be passed on to other contacts (indirect referrals). Lastly, specific advertising will be used when possible; taking into consideration price, target audience that it will reach, and potential pay back.
5.3 Sales Strategy
Competitive Edge
Gastronome Gander’s Gatherings’ competitive edge is the relaxed atmosphere provided at events for singles to meet without the hassles of matchmaking. We believe the combination of worry-free events, a focus on food, wine, and fun, plus a relaxed environment will lead to interesting conversations and friendships.
Sales Strategy
For potential members Gastronome Gander’s Gatherings will emphasize the relaxed atmosphere of our events. Our strategy will be to differentiate ourselves from other singles groups. Our website will have FAQs (Frequently Asked Questions) for interested members. In addition, the website will indicate our niche in the market; that of meeting other singles without the pressure of matchmaking.
For people signing up as members, the website has an online membership form. The company is signed up with Merchant Services through our bank (Chase) and we accept Visa®, MasterCard®, American Express®, and Discover®.
To track members the company uses ACT!™ database that provides details on each member. This information is used for event ideas as well as seating arrangements at event dinners in order to put similar people together (based on parameters such as age, gender, and interests).
In order to acquire additional members, current members will be given incentives to bring in new people. Guest are encouraged through current members and if they join the current member gets additional months of membership. In addition, if we needed more male members, we would give additional incentives for men joining.
5.3.1 Sales Forecast
Memberships are expected to grow at a rate of 20 people per month. While we feel this number is conservative based on the Restaurant Raconteurs of Cookeston company, our population is smaller. In future years we anticipate an 80 percent renewal rate plus 25 new members per month. With expected marketing we believe these numbers will be easily attainable. The main driving forces for membership will be marketing, customer satisfaction, and networking.
Gross revenue is based on number of events per month. In the beginning and during the first year of holding events, we expect to do no more than four events per month. During the second and third years we expect to do five or six events per month. Again, these numbers are based on data from Cookeston company.
Profit from events is expected to be zero to a few hundred dollars per event in the beginning. With more events, more members, and better margins we expect profits to approach $500 to $1,000 per event (2005 – 2006). The main driving forces for profit are the number of events per month and event margins. As the company becomes better known in the business community and with greater member numbers, we expect our margins to increase.
Costs that are not directly related to events includes marketing, sales, office, and related items. Many of these are fixed costs. However, marketing costs are expected to level off in future years with networking and word-of-mouth becoming more prominent. The overall numbers for membership are in line with the total population in our area. We believe our events for singles and their presentation are unique to this area. With good networking and customer satisfaction plus adequate press coverage we expect to beat these forecasts.
However, other factors may turn membership downward, such as a weakening economy and/or job losses in our geographical area.


| Sales Forecast | |||
| Year 1 | Year 2 | Year 3 | |
| Sales | |||
| Memberships | $22,500 | $24,750 | $67,650 |
| Events | $33,750 | $67,125 | $101,640 |
| Total Sales | $56,250 | $91,875 | $169,290 |
| Direct Cost of Sales | Year 1 | Year 2 | Year 3 |
| Memberships | $1,800 | $2,940 | $3,028 |
| Events | $24,000 | $25,200 | $25,956 |
| Subtotal Direct Cost of Sales | $25,800 | $28,140 | $28,984 |
5.4 Milestones
The programs will be revised each year. This year’s plan includes only the programs to be implemented this year.

| Milestones | |||||
| Milestone | Start Date | End Date | Budget | Manager | Department |
| Company idenity | 2/15/2004 | 4/30/2004 | $2,000 | Gander/Tomery | Marketing |
| Website online | 2/15/2004 | 3/30/2004 | $500 | Honiker/Gander | Web |
| Networking | 2/15/2004 | 12/31/2004 | $200 | Gander | President |
| Brochure(s) | 3/15/2004 | 4/30/2004 | $750 | Tomery/Gander | Web |
| Press release for kick-off event | 2/15/2004 | 4/1/2004 | $1,550 | Tomery/Gander | Marketing |
| Press releases for other events | 4/14/2004 | 8/15/2004 | $750 | Tomery/Gander | Marketing |
| Targeted advertising | 3/30/2004 | 8/30/2004 | $750 | Tomery/Gander | Marketing |
| South Downes Wine & Food Event | 2/15/2004 | 4/15/2004 | $200 | Gander | Marketing |
| Website content | 2/15/2004 | 3/30/2004 | $1,500 | Tomery/Honiker | Writing/Web |
| Initial Kick-off event | 1/15/2004 | 4/15/2004 | $3,000 | Gander | President |
| Totals | $11,200 | ||||
Web Plan Summary
Gastronome Gander’s Gatherings’ website will be the virtual business card and portfolio for the company, as well as its online home. The website will showcase the background of the company, as well as the portfolio of all the past and current online events. The website needs to be simple yet classy, well designed, and easy to use by members and interested visitors.
The website will create an area offering upcoming events, past event pictures, and newsletters to interested parties. The key to the website strategy will be combining a very well designed front end, with a back end capable of processing membership applications, as well as being part of our online marketing program. In addition, we expect to partner with our event providers with links on our website to theirs.
6.1 Website Marketing Strategy
Like business strategy in general, Web strategy is essentially focus:
- Focus on selected target markets (singles, late 20’s to later 50’s age range, upscale, defined geographic area).
- Focus on matching selected target market needs and selected website offerings (events to attract and keep members).
- Focus on the company’s and our website’s strengths and take advantage of the opportunities ahead (customer service).
6.2 Development Requirements
Gastronome Gander’s Gatherings will work with a contracted Web Master to develop the site. We will also employ a writer with marketing experience to enhance the wording and overall site appearance. Moreover, the writer and Web Master will work with a graphic artist to come up with the website logo and the website graphics.
The maintenance of the site will be done by the Gastronome Gander’s Gatherings with assistance from the Web Master for future development such as newsletters and pictures of events.
Management Summary
Gastronome Gander’s Gatherings is owned and operated by Mr. Trencherman Gander. The company, being small in nature, requires a simple organizational structure. Implementation of this organizational form calls for the owner, Mr. Gander, to make all of the major management decisions in addition to monitoring all other business activities.
In order to meet the business needs of the company, others include a professional team of consultants and hired services. All of these members have had experience with Restaurant Raconteurs of Cookeston and include:
- President of Restaurant Raconteurs of Cookeston
- Professional writer/marketing person
- Web Master
- Accountant
- Attorney
- ACT! Consultant
Other people will be developed in the future as need arises and will include member volunteers to help with greeting members at events.
7.1 Personnel Plan
Trencherman Gander, president, is the only employee. Trencherman does not expect to receive any pay during the first year of operation. A part-time assistant may be hired mid-year if the need arises.
| Personnel Plan | |||
| Year 1 | Year 2 | Year 3 | |
| Trencherman Gander | $0 | $24,000 | $36,000 |
| Part-time assistant | $2,500 | $2,500 | $4,000 |
| Others (mostly volunteers) | $0 | $0 | $0 |
| Total People | 2 | 2 | 2 |
| Total Payroll | $2,500 | $26,500 | $40,000 |
Financial Plan
Our financial plan is based on conservative estimates and assumptions. Owner investment and a short-term business loan provide start-up financing.
8.1 Important Assumptions
We examined the local market for Recreation Services (SIC 7999.9912) but because of low numbers (12 companies in Washbourne and 17 companies in Gourmandeville/Cuisineburg) we evaluated a wider surrounding region (290 companies). From this analysis the following table provides annual sales during the first three years of operation.
| Firms | Small Business | Start-ups | |
| Year 1 Average Sales | $157,500 | $130,061 | $100,000 |
| Year 2 Average Sales | $168,354 | $123,570 | $112,500 |
| Year 3 Average Sales | $185,882 | $145,885 | $100,000 |
Gastronome Gander’s Gatherings is classified in the ‘Small Business’ category for purposes of this table.
Data obtained from Bizminer (local marketing research profile for our region, Gourmandeville area, and Washbourne area) 2004.
| General Assumptions | |||
| Year 1 | Year 2 | Year 3 | |
| Plan Month | 1 | 2 | 3 |
| Current Interest Rate | 5.00% | 5.00% | 5.00% |
| Long-term Interest Rate | 10.00% | 10.00% | 10.00% |
| Tax Rate | 30.00% | 30.00% | 30.00% |
| Other | 0 | 0 | 0 |
8.2 Break-even Analysis
The Break-even Analysis table and chart indicate what will be needed in monthly revenue to achieve the Break-even point.

| Break-even Analysis | |
| Monthly Revenue Break-even | $3,492 |
| Assumptions: | |
| Average Percent Variable Cost | 46% |
| Estimated Monthly Fixed Cost | $1,891 |
8.3 Projected Profit and Loss
The profit and loss numbers are estimates for this year, due in part to being a start-up company. We anticipate generation of revenue starting in April 2004. Some expenses are known and include utilities, phone, and Internet hosting/DSL. Other numbers are based in part on estimates from other similar membership event companies.


| Pro Forma Profit and Loss | |||
| Year 1 | Year 2 | Year 3 | |
| Sales | $56,250 | $91,875 | $169,290 |
| Direct Cost of Sales | $25,800 | $28,140 | $28,984 |
| Other Costs of Sales | $0 | $0 | $0 |
| Total Cost of Sales | $25,800 | $28,140 | $28,984 |
| Gross Margin | $30,450 | $63,735 | $140,306 |
| Gross Margin % | 54.13% | 69.37% | 82.88% |
| Expenses | |||
| Payroll | $2,500 | $26,500 | $40,000 |
| Sales and Marketing and Related Expenses | $9,050 | $2,000 | $2,000 |
| Depreciation | $0 | $0 | $0 |
| Rent | $0 | $0 | $0 |
| Utilities | $360 | $400 | $450 |
| Insurance | $4,180 | $4,300 | $4,500 |
| Payroll Taxes | $0 | $0 | $0 |
| Mailing Expense | $726 | $800 | $900 |
| Credit Card Merchant Fees | $1,688 | $2,756 | $5,079 |
| Website Maintanence – Web Master | $0 | $0 | $0 |
| Website Hosting & Fees | $1,323 | $1,418 | $2,579 |
| Telecomm & DSL | $960 | $1,000 | $1,100 |
| Office Expenses | $1,900 | $2,100 | $2,500 |
| Total Operating Expenses | $22,687 | $41,274 | $59,108 |
| Profit Before Interest and Taxes | $7,763 | $22,461 | $81,198 |
| EBITDA | $7,763 | $22,461 | $81,198 |
| Interest Expense | $750 | $750 | $750 |
| Taxes Incurred | $2,104 | $6,513 | $24,134 |
| Net Profit | $4,909 | $15,197 | $56,313 |
| Net Profit/Sales | 8.73% | 16.54% | 33.26% |
8.4 Projected Cash Flow
The cash flow projection shows that provisions for ongoing expenses are adequate to meet the needs of the company as the business generates sufficient cash flow to support operations.

| Pro Forma Cash Flow | |||
| Year 1 | Year 2 | Year 3 | |
| Cash Received | |||
| Cash from Operations | |||
| Cash Sales | $56,250 | $91,875 | $169,290 |
| Subtotal Cash from Operations | $56,250 | $91,875 | $169,290 |
| Additional Cash Received | |||
| Sales Tax, VAT, HST/GST Received | $0 | $0 | $0 |
| New Current Borrowing | $0 | $0 | $0 |
| New Other Liabilities (interest-free) | $0 | $0 | $0 |
| New Long-term Liabilities | $0 | $0 | $0 |
| Sales of Other Current Assets | $0 | $0 | $0 |
| Sales of Long-term Assets | $0 | $0 | $0 |
| New Investment Received | $0 | $0 | $0 |
| Subtotal Cash Received | $56,250 | $91,875 | $169,290 |
| Expenditures | Year 1 | Year 2 | Year 3 |
| Expenditures from Operations | |||
| Cash Spending | $2,500 | $26,500 | $40,000 |
| Bill Payments | $43,834 | $51,176 | $71,103 |
| Subtotal Spent on Operations | $46,334 | $77,676 | $111,103 |
| Additional Cash Spent | |||
| Sales Tax, VAT, HST/GST Paid Out | $0 | $0 | $0 |
| Principal Repayment of Current Borrowing | $0 | $0 | $0 |
| Other Liabilities Principal Repayment | $0 | $0 | $0 |
| Long-term Liabilities Principal Repayment | $0 | $0 | $0 |
| Purchase Other Current Assets | $0 | $0 | $0 |
| Purchase Long-term Assets | $0 | $0 | $0 |
| Dividends | $0 | $0 | $0 |
| Subtotal Cash Spent | $46,334 | $77,676 | $111,103 |
| Net Cash Flow | $9,916 | $14,199 | $58,187 |
| Cash Balance | $21,800 | $35,999 | $94,186 |
8.5 Projected Balance Sheet
The balance sheet shows healthy growth of net worth, and strong financial position. The monthly estimates are included in the appendix.
| Pro Forma Balance Sheet | |||
| Year 1 | Year 2 | Year 3 | |
| Assets | |||
| Current Assets | |||
| Cash | $21,800 | $35,999 | $94,186 |
| Other Current Assets | $0 | $0 | $0 |
| Total Current Assets | $21,800 | $35,999 | $94,186 |
| Long-term Assets | |||
| Long-term Assets | $0 | $0 | $0 |
| Accumulated Depreciation | $0 | $0 | $0 |
| Total Long-term Assets | $0 | $0 | $0 |
| Total Assets | $21,800 | $35,999 | $94,186 |
| Liabilities and Capital | Year 1 | Year 2 | Year 3 |
| Current Liabilities | |||
| Accounts Payable | $5,122 | $4,124 | $5,998 |
| Current Borrowing | $15,000 | $15,000 | $15,000 |
| Other Current Liabilities | $0 | $0 | $0 |
| Subtotal Current Liabilities | $20,122 | $19,124 | $20,998 |
| Long-term Liabilities | $0 | $0 | $0 |
| Total Liabilities | $20,122 | $19,124 | $20,998 |
| Paid-in Capital | $10,000 | $10,000 | $10,000 |
| Retained Earnings | ($13,232) | ($8,323) | $6,875 |
| Earnings | $4,909 | $15,197 | $56,313 |
| Total Capital | $1,677 | $16,875 | $73,188 |
| Total Liabilities and Capital | $21,800 | $35,999 | $94,186 |
| Net Worth | $1,677 | $16,875 | $73,188 |
8.6 Business Ratios
Our sales growth, as a percentage, is exceptionally high due to the figures being the first two years of operation. Therefore, by virtue of comparison to low first-year numbers our percent increase will seem extraordinary. Our assets are lower than industry averages due to the initial investment being small, most of the equipment being expensed, and that the size of Gastronome Gander’s Gatherings is small in relation to other companies within this sector: Recreation Services, SIC Code 7999.9912. Our total liabilities are higher than other companies, but improve rapidly. If additional investment is acquired instead of secured loans, this will help us meet our goal of keeping liabilities to a minimum.
| Ratio Analysis | ||||
| Year 1 | Year 2 | Year 3 | Industry Profile | |
| Sales Growth | 0.00% | 63.33% | 84.26% | 4.94% |
| Percent of Total Assets | ||||
| Other Current Assets | 0.00% | 0.00% | 0.00% | 36.35% |
| Total Current Assets | 100.00% | 100.00% | 100.00% | 43.63% |
| Long-term Assets | 0.00% | 0.00% | 0.00% | 56.37% |
| Total Assets | 100.00% | 100.00% | 100.00% | 100.00% |
| Current Liabilities | 92.31% | 53.12% | 22.29% | 21.68% |
| Long-term Liabilities | 0.00% | 0.00% | 0.00% | 31.17% |
| Total Liabilities | 92.31% | 53.12% | 22.29% | 52.85% |
| Net Worth | 7.69% | 46.88% | 77.71% | 47.15% |
| Percent of Sales | ||||
| Sales | 100.00% | 100.00% | 100.00% | 100.00% |
| Gross Margin | 54.13% | 69.37% | 82.88% | 100.00% |
| Selling, General & Administrative Expenses | 37.94% | 45.18% | 40.18% | 76.74% |
| Advertising Expenses | 0.00% | 0.00% | 0.00% | 2.84% |
| Profit Before Interest and Taxes | 13.80% | 24.45% | 47.96% | 2.11% |
| Main Ratios | ||||
| Current | 1.08 | 1.88 | 4.49 | 1.05 |
| Quick | 1.08 | 1.88 | 4.49 | 0.69 |
| Total Debt to Total Assets | 92.31% | 53.12% | 22.29% | 62.49% |
| Pre-tax Return on Net Worth | 418.12% | 128.66% | 109.92% | 2.98% |
| Pre-tax Return on Assets | 32.17% | 60.31% | 85.41% | 7.95% |
| Additional Ratios | Year 1 | Year 2 | Year 3 | |
| Net Profit Margin | 8.73% | 16.54% | 33.26% | n.a |
| Return on Equity | 292.69% | 90.06% | 76.94% | n.a |
| Activity Ratios | ||||
| Accounts Payable Turnover | 9.53 | 12.17 | 12.17 | n.a |
| Payment Days | 27 | 34 | 25 | n.a |
| Total Asset Turnover | 2.58 | 2.55 | 1.80 | n.a |
| Debt Ratios | ||||
| Debt to Net Worth | 12.00 | 1.13 | 0.29 | n.a |
| Current Liab. to Liab. | 1.00 | 1.00 | 1.00 | n.a |
| Liquidity Ratios | ||||
| Net Working Capital | $1,677 | $16,875 | $73,188 | n.a |
| Interest Coverage | 10.35 | 29.95 | 108.26 | n.a |
| Additional Ratios | ||||
| Assets to Sales | 0.39 | 0.39 | 0.56 | n.a |
| Current Debt/Total Assets | 92% | 53% | 22% | n.a |
| Acid Test | 1.08 | 1.88 | 4.49 | n.a |
| Sales/Net Worth | 33.54 | 5.44 | 2.31 | n.a |
| Dividend Payout | 0.00 | 0.00 | 0.00 | n.a |
Appendix
| Sales Forecast | |||||||||||||
| Month 1 | Month 2 | Month 3 | Month 4 | Month 5 | Month 6 | Month 7 | Month 8 | Month 9 | Month 10 | Month 11 | Month 12 | ||
| Sales | |||||||||||||
| Memberships | 0% | $0 | $0 | $0 | $2,500 | $2,500 | $2,500 | $2,500 | $2,500 | $2,500 | $2,500 | $2,500 | $2,500 |
| Events | 0% | $0 | $0 | $0 | $2,000 | $2,500 | $2,750 | $3,500 | $4,000 | $4,500 | $4,500 | $5,000 | $5,000 |
| Total Sales | $0 | $0 | $0 | $4,500 | $5,000 | $5,250 | $6,000 | $6,500 | $7,000 | $7,000 | $7,500 | $7,500 | |
| Direct Cost of Sales | Month 1 | Month 2 | Month 3 | Month 4 | Month 5 | Month 6 | Month 7 | Month 8 | Month 9 | Month 10 | Month 11 | Month 12 | |
| Memberships | $0 | $0 | $0 | $200 | $200 | $200 | $200 | $200 | $200 | $200 | $200 | $200 | |
| Events | $0 | $0 | $0 | $2,000 | $2,500 | $2,500 | $2,500 | $2,500 | $3,000 | $3,000 | $3,000 | $3,000 | |
| Subtotal Direct Cost of Sales | $0 | $0 | $0 | $2,200 | $2,700 | $2,700 | $2,700 | $2,700 | $3,200 | $3,200 | $3,200 | $3,200 | |
| Personnel Plan | |||||||||||||
| Month 1 | Month 2 | Month 3 | Month 4 | Month 5 | Month 6 | Month 7 | Month 8 | Month 9 | Month 10 | Month 11 | Month 12 | ||
| Trencherman Gander | 0% | $0 | $0 | $0 | $0 | $0 | $0 | $0 | $0 | $0 | $0 | $0 | $0 |
| Part-time assistant | 0% | $0 | $0 | $0 | $0 | $0 | $250 | $250 | $250 | $250 | $500 | $500 | $500 |
| Others (mostly volunteers) | 0% | $0 | $0 | $0 | $0 | $0 | $0 | $0 | $0 | $0 | $0 | $0 | $0 |
| Total People | 1 | 1 | 1 | 1 | 1 | 2 | 2 | 2 | 2 | 2 | 2 | 2 | |
| Total Payroll | $0 | $0 | $0 | $0 | $0 | $250 | $250 | $250 | $250 | $500 | $500 | $500 | |
| General Assumptions | |||||||||||||
| Month 1 | Month 2 | Month 3 | Month 4 | Month 5 | Month 6 | Month 7 | Month 8 | Month 9 | Month 10 | Month 11 | Month 12 | ||
| Plan Month | 1 | 2 | 3 | 4 | 5 | 6 | 7 | 8 | 9 | 10 | 11 | 12 | |
| Current Interest Rate | 5.00% | 5.00% | 5.00% | 5.00% | 5.00% | 5.00% | 5.00% | 5.00% | 5.00% | 5.00% | 5.00% | 5.00% | |
| Long-term Interest Rate | 10.00% | 10.00% | 10.00% | 10.00% | 10.00% | 10.00% | 10.00% | 10.00% | 10.00% | 10.00% | 10.00% | 10.00% | |
| Tax Rate | 30.00% | 30.00% | 30.00% | 30.00% | 30.00% | 30.00% | 30.00% | 30.00% | 30.00% | 30.00% | 30.00% | 30.00% | |
| Other | 0 | 0 | 0 | 0 | 0 | 0 | 0 | 0 | 0 | 0 | 0 | 0 | |
| Pro Forma Profit and Loss | |||||||||||||
| Month 1 | Month 2 | Month 3 | Month 4 | Month 5 | Month 6 | Month 7 | Month 8 | Month 9 | Month 10 | Month 11 | Month 12 | ||
| Sales | $0 | $0 | $0 | $4,500 | $5,000 | $5,250 | $6,000 | $6,500 | $7,000 | $7,000 | $7,500 | $7,500 | |
| Direct Cost of Sales | $0 | $0 | $0 | $2,200 | $2,700 | $2,700 | $2,700 | $2,700 | $3,200 | $3,200 | $3,200 | $3,200 | |
| Other Costs of Sales | $0 | $0 | $0 | $0 | $0 | $0 | $0 | $0 | $0 | $0 | $0 | $0 | |
| Total Cost of Sales | $0 | $0 | $0 | $2,200 | $2,700 | $2,700 | $2,700 | $2,700 | $3,200 | $3,200 | $3,200 | $3,200 | |
| Gross Margin | $0 | $0 | $0 | $2,300 | $2,300 | $2,550 | $3,300 | $3,800 | $3,800 | $3,800 | $4,300 | $4,300 | |
| Gross Margin % | 0.00% | 0.00% | 0.00% | 51.11% | 46.00% | 48.57% | 55.00% | 58.46% | 54.29% | 54.29% | 57.33% | 57.33% | |
| Expenses | |||||||||||||
| Payroll | $0 | $0 | $0 | $0 | $0 | $250 | $250 | $250 | $250 | $500 | $500 | $500 | |
| Sales and Marketing and Related Expenses | $0 | $1,500 | $2,350 | $1,600 | $750 | $600 | $500 | $500 | $500 | $250 | $250 | $250 | |
| Depreciation | $0 | $0 | $0 | $0 | $0 | $0 | $0 | $0 | $0 | $0 | $0 | $0 | |
| Rent | $0 | $0 | $0 | $0 | $0 | $0 | $0 | $0 | $0 | $0 | $0 | $0 | |
| Utilities | $30 | $30 | $30 | $30 | $30 | $30 | $30 | $30 | $30 | $30 | $30 | $30 | |
| Insurance | $0 | $380 | $380 | $380 | $380 | $380 | $380 | $380 | $380 | $380 | $380 | $380 | |
| Payroll Taxes | 15% | $0 | $0 | $0 | $0 | $0 | $0 | $0 | $0 | $0 | $0 | $0 | $0 |
| Mailing Expense | $37 | $37 | $37 | $50 | $50 | $65 | $65 | $65 | $70 | $70 | $90 | $90 | |
| Credit Card Merchant Fees | $0 | $0 | $0 | $135 | $150 | $158 | $180 | $195 | $210 | $210 | $225 | $225 | |
| Website Maintanence – Web Master | $0 | $0 | $0 | $0 | $0 | $0 | $0 | $0 | $0 | $0 | $0 | $0 | |
| Website Hosting & Fees | $40 | $40 | $40 | $107 | $115 | $119 | $130 | $137 | $145 | $145 | $152 | $152 | |
| Telecomm & DSL | 15% | $80 | $80 | $80 | $80 | $80 | $80 | $80 | $80 | $80 | $80 | $80 | $80 |
| Office Expenses | $500 | $300 | $200 | $100 | $100 | $100 | $100 | $100 | $100 | $100 | $100 | $100 | |
| Total Operating Expenses | $687 | $2,367 | $3,117 | $2,482 | $1,655 | $1,781 | $1,715 | $1,737 | $1,765 | $1,765 | $1,807 | $1,807 | |
| Profit Before Interest and Taxes | ($687) | ($2,367) | ($3,117) | ($182) | $645 | $769 | $1,585 | $2,063 | $2,035 | $2,035 | $2,493 | $2,493 | |
| EBITDA | ($687) | ($2,367) | ($3,117) | ($182) | $645 | $769 | $1,585 | $2,063 | $2,035 | $2,035 | $2,493 | $2,493 | |
| Interest Expense | $63 | $63 | $63 | $63 | $63 | $63 | $63 | $63 | $63 | $63 | $63 | $63 | |
| Taxes Incurred | ($225) | ($729) | ($954) | ($73) | $175 | $212 | $457 | $600 | $592 | $592 | $729 | $729 | |
| Net Profit | ($525) | ($1,701) | ($2,226) | ($171) | $408 | $494 | $1,066 | $1,400 | $1,381 | $1,381 | $1,701 | $1,701 | |
| Net Profit/Sales | 0.00% | 0.00% | 0.00% | -3.81% | 8.16% | 9.42% | 17.76% | 21.54% | 19.73% | 19.73% | 22.68% | 22.68% | |
| Pro Forma Cash Flow | |||||||||||||
| Month 1 | Month 2 | Month 3 | Month 4 | Month 5 | Month 6 | Month 7 | Month 8 | Month 9 | Month 10 | Month 11 | Month 12 | ||
| Cash Received | |||||||||||||
| Cash from Operations | |||||||||||||
| Cash Sales | $0 | $0 | $0 | $4,500 | $5,000 | $5,250 | $6,000 | $6,500 | $7,000 | $7,000 | $7,500 | $7,500 | |
| Subtotal Cash from Operations | $0 | $0 | $0 | $4,500 | $5,000 | $5,250 | $6,000 | $6,500 | $7,000 | $7,000 | $7,500 | $7,500 | |
| Additional Cash Received | |||||||||||||
| Sales Tax, VAT, HST/GST Received | 0.00% | $0 | $0 | $0 | $0 | $0 | $0 | $0 | $0 | $0 | $0 | $0 | $0 |
| New Current Borrowing | $0 | $0 | $0 | $0 | $0 | $0 | $0 | $0 | $0 | $0 | $0 | $0 | |
| New Other Liabilities (interest-free) | $0 | $0 | $0 | $0 | $0 | $0 | $0 | $0 | $0 | $0 | $0 | $0 | |
| New Long-term Liabilities | $0 | $0 | $0 | $0 | $0 | $0 | $0 | $0 | $0 | $0 | $0 | $0 | |
| Sales of Other Current Assets | $0 | $0 | $0 | $0 | $0 | $0 | $0 | $0 | $0 | $0 | $0 | $0 | |
| Sales of Long-term Assets | $0 | $0 | $0 | $0 | $0 | $0 | $0 | $0 | $0 | $0 | $0 | $0 | |
| New Investment Received | $0 | $0 | $0 | $0 | $0 | $0 | $0 | $0 | $0 | $0 | $0 | $0 | |
| Subtotal Cash Received | $0 | $0 | $0 | $4,500 | $5,000 | $5,250 | $6,000 | $6,500 | $7,000 | $7,000 | $7,500 | $7,500 | |
| Expenditures | Month 1 | Month 2 | Month 3 | Month 4 | Month 5 | Month 6 | Month 7 | Month 8 | Month 9 | Month 10 | Month 11 | Month 12 | |
| Expenditures from Operations | |||||||||||||
| Cash Spending | $0 | $0 | $0 | $0 | $0 | $250 | $250 | $250 | $250 | $500 | $500 | $500 | |
| Bill Payments | $133 | $564 | $1,718 | $2,307 | $4,669 | $4,589 | $4,512 | $4,690 | $4,867 | $5,361 | $5,125 | $5,299 | |
| Subtotal Spent on Operations | $133 | $564 | $1,718 | $2,307 | $4,669 | $4,839 | $4,762 | $4,940 | $5,117 | $5,861 | $5,625 | $5,799 | |
| Additional Cash Spent | |||||||||||||
| Sales Tax, VAT, HST/GST Paid Out | $0 | $0 | $0 | $0 | $0 | $0 | $0 | $0 | $0 | $0 | $0 | $0 | |
| Principal Repayment of Current Borrowing | $0 | $0 | $0 | $0 | $0 | $0 | $0 | $0 | $0 | $0 | $0 | $0 | |
| Other Liabilities Principal Repayment | $0 | $0 | $0 | $0 | $0 | $0 | $0 | $0 | $0 | $0 | $0 | $0 | |
| Long-term Liabilities Principal Repayment | $0 | $0 | $0 | $0 | $0 | $0 | $0 | $0 | $0 | $0 | $0 | $0 | |
| Purchase Other Current Assets | $0 | $0 | $0 | $0 | $0 | $0 | $0 | $0 | $0 | $0 | $0 | $0 | |
| Purchase Long-term Assets | $0 | $0 | $0 | $0 | $0 | $0 | $0 | $0 | $0 | $0 | $0 | $0 | |
| Dividends | $0 | $0 | $0 | $0 | $0 | $0 | $0 | $0 | $0 | $0 | $0 | $0 | |
| Subtotal Cash Spent | $133 | $564 | $1,718 | $2,307 | $4,669 | $4,839 | $4,762 | $4,940 | $5,117 | $5,861 | $5,625 | $5,799 | |
| Net Cash Flow | ($133) | ($564) | ($1,718) | $2,193 | $331 | $411 | $1,238 | $1,560 | $1,883 | $1,139 | $1,875 | $1,701 | |
| Cash Balance | $11,751 | $11,187 | $9,469 | $11,661 | $11,993 | $12,403 | $13,642 | $15,202 | $17,085 | $18,224 | $20,099 | $21,800 | |
| Pro Forma Balance Sheet | |||||||||||||
| Month 1 | Month 2 | Month 3 | Month 4 | Month 5 | Month 6 | Month 7 | Month 8 | Month 9 | Month 10 | Month 11 | Month 12 | ||
| Assets | Starting Balances | ||||||||||||
| Current Assets | |||||||||||||
| Cash | $11,884 | $11,751 | $11,187 | $9,469 | $11,661 | $11,993 | $12,403 | $13,642 | $15,202 | $17,085 | $18,224 | $20,099 | $21,800 |
| Other Current Assets | $0 | $0 | $0 | $0 | $0 | $0 | $0 | $0 | $0 | $0 | $0 | $0 | $0 |
| Total Current Assets | $11,884 | $11,751 | $11,187 | $9,469 | $11,661 | $11,993 | $12,403 | $13,642 | $15,202 | $17,085 | $18,224 | $20,099 | $21,800 |
| Long-term Assets | |||||||||||||
| Long-term Assets | $0 | $0 | $0 | $0 | $0 | $0 | $0 | $0 | $0 | $0 | $0 | $0 | $0 |
| Accumulated Depreciation | $0 | $0 | $0 | $0 | $0 | $0 | $0 | $0 | $0 | $0 | $0 | $0 | $0 |
| Total Long-term Assets | $0 | $0 | $0 | $0 | $0 | $0 | $0 | $0 | $0 | $0 | $0 | $0 | $0 |
| Total Assets | $11,884 | $11,751 | $11,187 | $9,469 | $11,661 | $11,993 | $12,403 | $13,642 | $15,202 | $17,085 | $18,224 | $20,099 | $21,800 |
| Liabilities and Capital | Month 1 | Month 2 | Month 3 | Month 4 | Month 5 | Month 6 | Month 7 | Month 8 | Month 9 | Month 10 | Month 11 | Month 12 | |
| Current Liabilities | |||||||||||||
| Accounts Payable | $116 | $507 | $1,644 | $2,151 | $4,516 | $4,439 | $4,355 | $4,528 | $4,688 | $5,190 | $4,949 | $5,122 | $5,122 |
| Current Borrowing | $15,000 | $15,000 | $15,000 | $15,000 | $15,000 | $15,000 | $15,000 | $15,000 | $15,000 | $15,000 | $15,000 | $15,000 | $15,000 |
| Other Current Liabilities | $0 | $0 | $0 | $0 | $0 | $0 | $0 | $0 | $0 | $0 | $0 | $0 | $0 |
| Subtotal Current Liabilities | $15,116 | $15,507 | $16,644 | $17,151 | $19,516 | $19,439 | $19,355 | $19,528 | $19,688 | $20,190 | $19,949 | $20,122 | $20,122 |
| Long-term Liabilities | $0 | $0 | $0 | $0 | $0 | $0 | $0 | $0 | $0 | $0 | $0 | $0 | $0 |
| Total Liabilities | $15,116 | $15,507 | $16,644 | $17,151 | $19,516 | $19,439 | $19,355 | $19,528 | $19,688 | $20,190 | $19,949 | $20,122 | $20,122 |
| Paid-in Capital | $10,000 | $10,000 | $10,000 | $10,000 | $10,000 | $10,000 | $10,000 | $10,000 | $10,000 | $10,000 | $10,000 | $10,000 | $10,000 |
| Retained Earnings | ($13,232) | ($13,232) | ($13,232) | ($13,232) | ($13,232) | ($13,232) | ($13,232) | ($13,232) | ($13,232) | ($13,232) | ($13,232) | ($13,232) | ($13,232) |
| Earnings | $0 | ($525) | ($2,225) | ($4,451) | ($4,622) | ($4,215) | ($3,720) | ($2,654) | ($1,254) | $126 | $1,507 | $3,208 | $4,909 |
| Total Capital | ($3,232) | ($3,757) | ($5,457) | ($7,683) | ($7,854) | ($7,447) | ($6,952) | ($5,886) | ($4,486) | ($3,106) | ($1,725) | ($24) | $1,677 |
| Total Liabilities and Capital | $11,884 | $11,751 | $11,187 | $9,469 | $11,661 | $11,993 | $12,403 | $13,642 | $15,202 | $17,085 | $18,224 | $20,099 | $21,800 |
| Net Worth | ($3,232) | ($3,757) | ($5,457) | ($7,683) | ($7,854) | ($7,447) | ($6,952) | ($5,886) | ($4,486) | ($3,106) | ($1,725) | ($24) | $1,677 |

