
Sarrica's Market
Executive Summary
Sarrica’s Market is a new business located in downtown Moab, Utah. The store is an upscale international grocery and delicatessen with a distinct menu that includes authentic, hard to find ingredients from around the country and the world. The facility will include a sixteen person capacity eating area, deli/kitchen with counter and check out area, grocery/gift area, and a public restroom.
The mission of Sarrica’s Market is to provide Moab, Utah’s residents and visitors with a combination of quality, authentic, hard to find, grocery items and prepared foods, with good service and a pleasant atmosphere with the warm feel of an Old-World outdoor market. Our store motto is, “eat and enjoy.”
The deli will serve sandwiches, salads, specialty drinks, and picnic lunches. Gift items will complement the international theme of the store and include a limited selection of kitchen wares, cookbooks, picnic items, and original hand-sewn items and jewelry. Gift baskets will also be available in the store and over the internet. All the recipes used in the deli will highlight the grocery items sold in the market.
The gourmet and specialty foods market is booming across the country. Consumers are looking for quality food coupled with a quality shopping experience. Many large cities have have entire sections dedicated to ethnic foods and culture. As rural America moves away from agriculture and natural resources, and towards tourism as its main economy source, more and more people are flocking to areas such as Moab. These new populations are starved for the fine ingredients they were able to purchase in big cities and are looking for a rural solution to this problem. Moab’s residents and many visitors have expressed the desire for a local gourmet food store.
By making alliances with local farmers and restaurants, as well as international distributors, Sarrica’s Market will give customers a combination of “shopping local” and wide gourmet selection previously unavailable in this highly visited rural area. For residents, Sarrica’s offers a more convenient and appealing option than ordering online or lugging fancy groceries back from infrequent trips to the nearest cities (several hours away), especially in winter.
Sarrica’s projects net profits increasing over the first three years. The increasing profitability is partly based on expectations that wide seasonal differences in sales levels in the first year will moderate as we strengthen our local clientele base. These forecasts are based on the recent performance of similar cross-market upscale stores in Moab, and general trends in the gourmet food stores industry.
To achieve our objectives, the owners of Sarrica’s Market are contributing $24,000 and seeking a $100,000 small business loan. These loans will be used for start-up costs and will be paid back from the cash flow of the business within five years.

1.1 Mission
The mission of Sarrica’s Market is to provide Moab, Utah’s residents and visitors with an upscale grocery store, gift shop, and delicatessen specializing in a combination of quality, authentic, hard to find, grocery items from around the world.
1.2 Goals and Objectives
Sarrica’s Market has the following goals and objectives:
- Obtain necessary funding ($24,000 in investor/personal loans and $100,000 in small business administration loans).
- Create a service-based company that exceeds customers’ expectations, and increases the number of repeat clients serviced by at least 20% per year, through superior performance and word-of-mouth referrals.
- Become an established community destination with a customer satisfaction rate of 90% by the end of the first year.
- Achieve cash flow self-sufficiency by the end of the first year.
- Sales of $461,900 in the first year, with sales increasing to $484,735 in the second year and $508,000 in the third year.
- Provide an income for the founders by the end of the second year with income growth possibilities.
- Repay debt from original financing by the end of the fifth year.
1.3 Keys to Success
The keys to success for Sarrica’s Market include:
- Reputation: Every customer visiting our store will want to return and will recommend us to their friends and family. Word of mouth marketing will be a powerful ally for our business.
- Superior Customer Service: Knowledgeable, friendly service will be of the utmost importance.
- Location: Provide an easily accessible location for customer convenience, including walk-by and drive-by traffic.
- Product/Environment: Offer a variety of high quality foods with domestic and international themes, sold at a fair price in a clean, authentic, comfortable environment.
- Convenience: Our customers will know that they can get what they need at our market for a fair price. This will reduce their need to travel to get desired items or order them online.
Company Summary
Sarrica’s Market is a new business located in downtown Moab, Utah on Main Street. The store is an upscale international grocery and delicatessen, with a distinct menu that includes authentic, hard-to-find ingredients from around the country and the world. The facility will include a sixteen person capacity eating area, deli/kitchen with counter & check out area, grocery/gift area, and a unisex public restroom.
The mission of Sarrica’s Market is to provide Moab, Utah’s residents and visitors with an upscale grocery store, gift shop, and delicatessen specializing in a combination of quality, authentic, hard-to-find grocery items from around the world. Our store motto is, “eat and enjoy,” and our decor depicts the warm feel of an old world outdoor market.
The deli will serve sandwiches, salads, speciality drinks, and picnic lunches. Gift items will complement the international theme of the store and include a limited selection of kitchen wares, cookbooks, picnic items, and original sewn items and jewelry. Gift baskets will also be available in the store and over the internet. All the recipes used in the deli will highlight the grocery items sold in the market.
2.1 Start-up Summary
Start-up costs and initial financing are shown in the following table. The founders are seeking a small business loan in the amount of $100,000 to supplement owner investment in covering these costs. The estimated start-up costs may be lower than projected here if the owners are able to purchase used equipment and do the renovation labor themselves.
We plan on a three month start-up period. Expenses are broken down as follows:
- Insurance @$300/month
- Rent @$2,500/month
- Initial Loan Repayment @$1,000/month
- Utilities @ $1,000/month
- Salaries: 2 managers @$2,000/month each
Long-term Assets:
- Refrigeration Units
- Display Cabinets
- Kitchen Equipment
Short-term Assets:
- Tables and Chairs
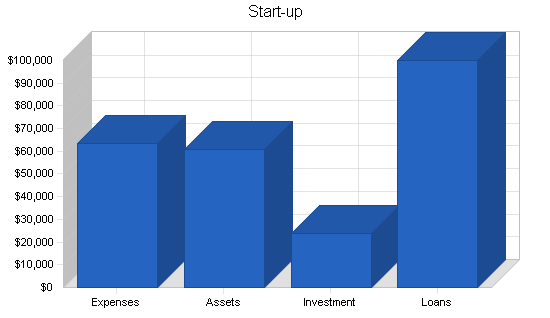
| Start-up | |
| Requirements | |
| Start-up Expenses | |
| Legal | $500 |
| Books/Accounting | $600 |
| Marketing/Website | $5,000 |
| Licenses/Permits | $1,000 |
| Delivery/Transportation | $1,500 |
| Insurance | $900 |
| Rent | $7,500 |
| Loan Payment | $3,000 |
| Utilities | $3,000 |
| Deposits | $500 |
| Expensed Equipment | $5,000 |
| Building Renovatons | $20,000 |
| Salaries | $12,000 |
| Payroll Taxes | $1,800 |
| Other | $1,000 |
| Total Start-up Expenses | $63,300 |
| Start-up Assets | |
| Cash Required | $15,700 |
| Start-up Inventory | $20,000 |
| Other Current Assets | $5,000 |
| Long-term Assets | $20,000 |
| Total Assets | $60,700 |
| Total Requirements | $124,000 |
| Start-up Funding | |
| Start-up Expenses to Fund | $63,300 |
| Start-up Assets to Fund | $60,700 |
| Total Funding Required | $124,000 |
| Assets | |
| Non-cash Assets from Start-up | $45,000 |
| Cash Requirements from Start-up | $15,700 |
| Additional Cash Raised | $0 |
| Cash Balance on Starting Date | $15,700 |
| Total Assets | $60,700 |
| Liabilities and Capital | |
| Liabilities | |
| Current Borrowing | $0 |
| Long-term Liabilities | $100,000 |
| Accounts Payable (Outstanding Bills) | $0 |
| Other Current Liabilities (interest-free) | $0 |
| Total Liabilities | $100,000 |
| Capital | |
| Planned Investment | |
| Andy and Cathy | $12,000 |
| Rosie and Kenny | $12,000 |
| Other | $0 |
| Additional Investment Requirement | $0 |
| Total Planned Investment | $24,000 |
| Loss at Start-up (Start-up Expenses) | ($63,300) |
| Total Capital | ($39,300) |
| Total Capital and Liabilities | $60,700 |
| Total Funding | $124,000 |
Brought to you by
Create a professional business plan
Using AI and step-by-step instructions
Create Your PlanSecure funding
Validate ideas
Build a strategy
2.2 Company Ownership
Sarrica’s Market is a Limited Liability Company owned and operated by the founders Andy Boone, Cathy O’Connor, Rosie O’Connor, and Kenny VanStone. It will be registered with the country as Sarrica’s Market.
Products and Services
Sarrica’s Market offers the following products and services:
Groceries
We will offer high quality groceries from Italy, the Mediterranean, Mexico, Asia, Europe, Australia, and the United States (Wisconsin, the Southwest, and locally). Groceries will include items that represent the best known and desired foods from these areas. Items will include but will not be limited to: sauces, oils, spices, spreads, peppers, cheese, meats, pasta, rice, canned goods, drinks, chocolates, and hard-to-find desserts and candies. A selection of frozen meals (made in the store)will be available for home cooking, and will include items such as homemade Italian meatballs & sausage, pizza, and “holiday” tamales.
Gifts
Gift items will complement the international theme of the store and include a limited selection of kitchen wares, cookbooks, picnic items, and original sewn items and jewelry. Gift baskets will also be available in the store and over the internet.
Delicatessen
Sarrica’s Market will offer unique cuisine with an international flair. The deli will offer a limited menu for breakfast, lunch, and dinner. The rotating menu will feature sandwiches, soups, salads, drinks, and desserts. All menu items will be prepared fresh each morning and displayed for easy pick-up. We will offer picnic lunches and frozen meals as well as cheese, meats, and ethnic deli salads by the pound.
The breakfast menu will include items such as quiche, scones, and biscotti, and the lunch/dinner menu will consist of sandwiches, salads, homemade breads, frozen meals, and daily specials.
We will serve high quality coffee, tea, juice, and soda from around the world through out the day.
Picnic lunches will be made available to visitors, specially packed to be carried into the numerous national parks and outdoor venues surrounding Moab. We will also make this service available to the many outdoor guiding services in Moab. These businesses include climbing, hiking, mountain biking, river rafting, and jeep touring companies.
3.1 Competitive Comparison
According to the Utah State Tax Commission, taxable sales in Grand County for “Food Stores/Eating & Drinking Establishments” was $47.9 million in 2002. We believe we can gain a portion of the current market share and capture a new market that has been largely ignored in rural America.
Moab is not a typical rural community, in that it has a tremendous number of domestic and international travelers vacationing throughout the year: 787,578 visitors to Arches National Park in 2003 alone. Moab’s recreational activities, pleasant climate, and natural and cultural treasures attract people from all over the United States and world to populate its boundaries. The population in Moab in 2000 was 4,779 and of those residents, 47.5 % were born in Utah, 48.7% were born in another state, and 3.8% were foreign born, or not U.S. citizens. The diverse make-up of this community and its rural location make Moab prime for this type of market and deli. Sarrica’s Market will provide this rural, isolated community and popular travel destination with a grocery that supplies its customers with cuisine other than what is offered by its established competitors.
The competition facing Sarrica’s Market includes all the grocery stores, coffee shops, and some of the eating establishments in the Moab area. Moab has two chain grocery stores (Citi Market and Moab Grocery) that carry many healthy food choices and some ethnic choices, but do not have an expanded ethnic food selection. The Moonflower Market Co-op carries health food but does not have an expanded ethnic food selection either. The Meat Shop carries local meats and some cheese, but does not carry international varieties of meats and cheese.
Restaurant/Coffee Shop competitors consist of Arches Book Company, Banditos Grill, Bob & Shelly’s Moab Deli, Breakfast at Tiffany’s, Buck’s Grillhouse, Center Cafe, Desert Bistro, Eklecticafe, Isabella’s Pizzeria, Knave of Hearts Bakery, La Hacienda, Miguel’s Baja Grill, Moab Brewery, Mondo Cafe, Paco’s, Pasta Jay’s, Poplar Place Pub & Eatery, Red Rock Bakery & Cafe, Red Cliffs Lodge, Rio Colorado, River Grill, Slickrock Cafe, Sunset Grill, Szechwan Restaurant, and Zax Wood Fired Pizza.
Moab has an abundance of convenience stores (Dave’s Corner Market, Jimbo’s Country Market, and numerous gas stations containing convenience marts) as well as many established fast food chain restaurants (Burger King, Denny’s, Hoagie Yogi, McDonalds, Pizza Hut, Subway, Teriyaki Stix, and Wendy’s).
We consider the majority of the above establishments to be indirect competition, due to the vast differences between us in quality of product and combination of services. Our direct competitors are Arches Book Company, Bob & Shelly’s Moab Deli, Center Cafe, Citi Market, Eklecticafe, Knave of Hearts Bakery, the Meat Shop, Moab Grocery, Moonflower Market Coop, Mondo Cafe, Paco’s, and Red Rock Bakery & Cafe. Each one of these competitors has a component similar to what Sarrica’s Market is proposing, but does not offer the same combination of services with international amenities.
We believe our mix of gourmet products and high-quality services, combined with our pleasant atmosphere, will help us compete with the existing small businesses. As for the larger grocery store chains, we will compete by providing a more intimate and educational shopping experience with quality products they do not carry.
3.2 Future Products and Services
Sarrica’s Market will introduce new menu items as time and profitability permit. We will also monitor where our profits are coming from and enhance those areas of the store quarterly.
3.3 Product and Service Description
The starting menu will include items such as:
Breakfast:
- Quiche – Made with fresh ingredients and cheese featured in the market
- Fresh Bread – Crusty Italian, wheat, and pumpernickel
- Scones/Muffins/Biscotti – International recipes
- Coffee, Tea, and Juice – From around the world
Lunch/Dinner:
- Roast Beef – With sharp provolone cheese, red onion, lettuce, & tomato on dark rye bread
- Corned Beef/Pastrami – With Wisconsin swiss cheese, red onion, shredded red cabbage and Russian dressing on rye bread
- Turkey – With sharp Wisconsin cheddar cheese, lettuce & tomato on French bread
- Smoked Turkey – With Havarti cheese, avocado, sprouts, cucumber, lettuce & tomato on multi grain bread
- The Boonero – Daily Special
- The Day After Thanksgiving – Turkey, herb stuffing, lettuce & cranberries on a potato bread roll
- The O’Connor – Turkey, Genoa salami, bacon, sharp Wisconsin cheddar cheese, lettuce & tomato on Italian bread
- The BLT – Bacon, sharp provolone cheese, lettuce & tomato on Italian bread
- Veggie Deluxe – Avocado, cucumber, sprouts, lettuce, tomato, red onion & sharp Wisconsin cheddar cheese served on multi grain bread
- Italian Veggie Deluxe – Marinated Italian vegetables, artichoke hearts, olives, red onion, & fresh mozzarella cheese on Italian bread
- Tomato with Fresh Mozzarella & Basil – On focaccia bread
- Grandma Sarrica’s Market Pizza – Made fresh and sold by the slice
- Bruschetta – Topped with ripe tomatoes, fresh basil, olives, & grated Italian cheese)
- Fresh Gazpacho – Ripe tomatoes, sweet white onions, jicama, cilantro, fresh jalapenos, and lime juice chopped and mixed for a truly refreshing taste.
- Eggplant Chickpea Pesto – A delicious combination of baba ganoush and hummus served with pita wedges
- Seven Layer Bean Dip – Refried black beans, tomatoes, corn, onion, mixed fresh, cilantro, and authentic mexican cheese. Served with sour cream, your choice of hot sauce, and corn chips for dipping
- Organic Soups – Made fresh
- Chili – Homemade using only the best ingredients
- Chips – A wide variety of speciality flavors
* Giardiniera is always available as a side dish to add a little spice to your sandwich.
Brought to you by
Create a professional business plan
Using AI and step-by-step instructions
Create Your PlanSecure funding
Validate ideas
Build a strategy
Salads:
- Caesar Salad – Homemade dressing with bacon, croutons, and imported parmesan cheese.
- Greek Salad – Light airy and zesty Rotelo pasta tossed with tomatoes, spinach, cucumbers, red onion, feta cheese, and Greek olives.
- Italian Salad – Ripe tomatoes, cucumbers, fresh basil, and balsamic vinegar mixed to perfection.
- Tomato, Basil, & Fresh Mozzarella Salad – Tossed in a light olive oil and balsamic vinegar dressing.
- Fresh Herb Salad – Spring greens mixed with dill, cilantro, basil and Italian parsley for a delightfully fresh taste.
- Pasta Salad of the Day – Always fresh and tasty.
Drinks/Ice:
- Juice – High quality flavors from around the world
- Soft Drinks – All natural
- Coffee – International & organic choices
- Tea – High quality flavors from around the world
Frozen Dinners:
Sarrica’s Market will carry a variety of hard to find frozen food items. Many of our frozen meals will be prepared at Sarrica’s Market and follow recipes that highlight items we sell in the grocery and deli.
- Grandma Sarrica’s Market Pizza
- Meatballs & Sausage with Marinara Sauce
- Stuffed Shells
- Manicotti
- Baked Ziti
- Chicken Parmesan
- Italian Beef
- Holiday Tamales
- Ready to Bake Bagles
- Ice Cream/Deserts
Market Analysis Summary
Our main target markets are:
- People who live and work in Moab, who are looking for quality ingredients needed to prepare their favorite international cuisine.
- Surrounding businesses looking for a tasty meal for their customers and staff.
- International and domestic travelers visiting Moab.
- Families looking for quality, affordable, home cooked meals to take home and prepare for their families with ease.
- People looking for a comfortable environment in which to enjoy a cup of coffee, read a book, or just shop.
- People looking for high quality, unique gifts and kitchen supplies.
Each market segment consists of people who either live, work, or vacation in the Moab, Utah area. Each market will be seeking an establishment that will meet their desire for authentic, healthy food, quality service, and a pleasant atmosphere.
4.1 Market Segmentation
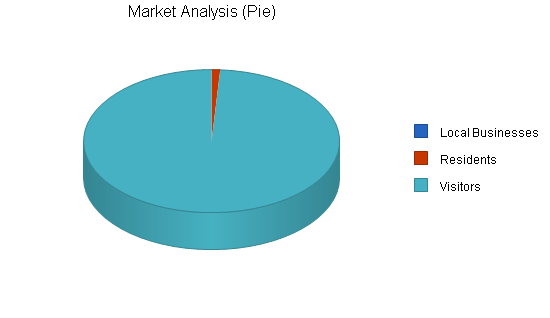
The total potential market in units is shown in the following table and chart.
- There are approximately 175 business in Moab that could potentially be our customers. We used 20% as a starting point with 10% growth per year.
- There are 8,485 residents in Moab, according to the 2000 U.S. Census, with 3% projected growth over the next ten years.
- Visitors were estimated using Arches National Park visitation report. From 1999-2003, an average of 787,578 people visited the park annually. We did not include projected growth, because we used an average number, and believe that visitation will remain similar over the next five years.
Even though the visitor population appears to be the largest the market segment, it is possible that much of our sales could come from local businesses, due to the fact that these companies make purchases for the visitors using their services. The local population is extremely important, because they can carry us through the four low visitation months, and will determine whether we become an established community destination.
| Market Analysis | |||||||
| Year 1 | Year 2 | Year 3 | Year 4 | Year 5 | |||
| Potential Customers | Growth | CAGR | |||||
| Local Businesses | 10% | 35 | 39 | 43 | 47 | 52 | 10.40% |
| Residents | 3% | 8,485 | 8,740 | 9,002 | 9,272 | 9,550 | 3.00% |
| Visitors | 0% | 787,578 | 787,578 | 787,578 | 787,578 | 787,578 | 0.00% |
| Total | 0.03% | 796,098 | 796,357 | 796,623 | 796,897 | 797,180 | 0.03% |
4.2 Target Market Segment Strategy
The last ten years have seen an increase in American’s explorations of foreign and gourmet foods. Whether this can be attributed to celebrity chefs, travel to foreign countries, new health diets, or the increasing accessibility of once-obscure ingredients, it seems that gourmet and adventurous palates are here to stay.
The proliferation of visitors has forced this once-isolated community to learn about and offer a greater variety of foods and experiences than they would have sought out on their own, and many residents are now just as sophisticated in their food tastes as our tourists. In Moab, residents often use travel to larger cities as occasions to stock up on luxury and gourmet items not available locally. However, they prefer to shop locally whenever possible, and would welcome a store that offers this combination.
Moab is growing at 3% a year, allowing for increased business opportunities without diminishing the small-town feel. Our natural attractions are in no danger of becoming polluted or otherwise less accessible, and so we expect continued market growth for the foreseeable future.
Our marketing programs towards different target market segments will utilize different publications and media, but all will emphasize our good value, high quality, unique and varied selections, and great service.
4.2.1 Market Needs
Moab and Southeastern Utah are in need of a quality international market that sells items that are currently only available in large cities or over the internet. Many residents tell stories of traveling to large cities with empty luggage so that they can fill their suitcase with speciality food they can not find in Moab. The residents of Moab are dedicated to protecting its “small town” feel and make a point to shop locally whenever possible. The residents of Moab and its surrounding communities would be thrilled to be able to shop for the food they want at home.
Moab, Utah is a rural community. The closest city is Grand Junction, Colorado, located 80 miles away, with a population of 42,000. Salt Lake City, Denver, Albuquerque and Las Vegas are the closest big cities, all located 250-600 miles away. Moab is fortunate to be a popular domestic and international travel destination because of its proximity to national parks, ancient cultural sites, unique red rock landscapes, and world class recreational opportunities.
Local and visiting customers desire high quality, healthy food that will appeal to their aesthetics. In addition, they desire a pleasant shopping and dining experience that allows them to learn about and purchase the grocery items they want in a comfortable, friendly, hassle-free environment. Customers will also enjoy the delicious home cooked take-home meals available to them when they do not have time to prepare quality meals at home.
4.2.2 Market Growth
We believe there is a market for our products and services in Moab and that the market has potential for growth. Grand County’s population in the year 2000 was 8,485 and is expected to grow at a rate of 3% over the next ten years. Moab is dedicated to remaining a travel destination “hot spot” without loosing its “small town” feel. Because of its unique appeal it is likely to attract many vacationers for years to come. Our business will grow as customers become familiar with our products and services.
U.S. Retail Sales of Gourmet Foods & Beverages 1998-2007 (in millions of dollars)
|
Product Classification |
1998 |
2002 |
Compound Annual Growth Rate 1998-2002 Brought to you by Create a professional business planUsing AI and step-by-step instructionsCreate Your PlanSecure funding Validate ideas Build a strategy |
2007 |
Compound Annual Growth Rate 2002-2007 |
Compound Annual Growth Rate 1998-2007 |
| Beverages & Confectionary |
$9,904 |
$14,700 |
10.4% |
$22,701 |
9.1% |
9.6% |
| Gourmet Foods & Ready-to-eat Meals |
$8,000 |
$10,100 |
6.0% |
$13,516 |
6.0% |
6.0% |
| Condiments & Cheese |
$4,230 |
$5,435 |
6.5% |
$7,252 |
5.9% |
6.2% |
| Total |
$22,134 |
$30,235 |
8.1% |
$43,469 |
7.5% |
7.8% |
4.2.3 Market Trends
Market and market growth according to Tree of Life, The U.S. Market for Gourmet/Speciality Foods include the following profiles, trends, and outlooks (see attached information for more details).
U.S. Retail sales of Gourmet Foods & Beverages 1998-2003
| Year | Sales (in millions of dollars) | Compound Annual Growth Rate (CAGR) |
| 1998 | $22,134 | 7.9% |
| 1999 | $23,887 | 8.3% |
| 2000 | $25,858 | 8.1% |
| 2001 | $27,948 | 8.2% |
| 2002 | $30,235 | 8.0% |
| 2003 | $32,688 | 8.1% |
Share of the U.S. Retail sales of Gourmet Foods & Beverages by Outlet 2002
| Outlet Type | Percentage of Sales |
| Supermarkets & Grocery Stores | 44.6% |
| Gourmet/Specialty Stores | 34.3% |
| Warehouse Club | 4.9% |
| All Other Outlets* | 16.2% |
*Includes continent stores, natural food supermarkets, ethnic stores, mass merchandisers,
drug stores, mail-order & internet sales, and alternative channels.
Americans are developing a bigger appetite for more upscale foods. There are reasons behind this, starting with higher discretionary incomes, better educations, more frequent travel, more fine dining, endless celebrity chefs on TV, and more exposure to ethnic foods. As a consequence, average American families–not just the affluent ones– are becoming increasingly adventurous in their diets.
A growing number of consumers also perceive gourmet foods as an affordable treat–not something limited to the very rich. As Andrea Kelly, group brand manager for Ferrero Rocher Chocolate, told the press, “People across all economic strata have at least a couple dollars to buy something that will be a treat for them.” This is borne out by the proliferation of Starbucks cafes, and translated into the retail success of products like Starbucks frappuccino bottled beverages. Likewise, Simmons Market Research Bureau demographics data show that although gourmet foods and beverages generally hold the highest appeal to the highest-income groups, there are also strong pockets of interested consumers in more moderate income brackets.
According to Simmons, ethnic/foreign foods are definitely popular among Americans. More than 41% of those surveyed agree that they “enjoy eating authentic foreign foods” and over 20% say they enjoy eating them “a lot”. By comparison, 18% of consumers agree with the statement that they “try to eat gourmet food whenever I can” and less than 6% agree a lot. A bit further down the list is “prefer food presented as an art form,” with just 15% agreeing and less than 5% agreeing a lot.
There has long been a synergy between the natural foods industry and the gourmet foods industry. From the early days of the health food movement and the organic food movement, Baby Boomers have been in the forefront of demanding healthy foods. Now, with the aging of the Baby Boomer generation, says John Roberts, president of the NASFT, “health concerns will make products that carry the words ‘natural,’ ‘organic,’ ‘healthy,’ and ‘fresh’ more saleable.” Marketers are also appealing to consumers’ social consciences by offering products that are good for the environment and the workers who produce them, such as sustainable, shade-grown, and fair-trade coffees.
More and more health and natural foods stores are carrying upscale, gourmet food items that meet their quality standards. For example, large natural food chains such as Whole Foods Market feature a wide assortment of upscale products ranging from organic produce, fresh baked goods, and cheeses produced from hormone-free milk, to a huge variety of packaged dry groceries. Their broad product mix and focus on high-quality foods draw consumers seeking gourmet foods as well as traditional health foods.
Sarrica’s Market realizes that there is a growing demand for speciality food items and a significant percentage of visitors and locals demanding naturally grown, organic specialty foods. We plan to pay attention to these trends and provide our customers with these products.
4.3 Service Business Analysis
We are part of the retail grocery and prepared food industry, as well as the small-scale deli industry. In particular, our portion of the industry is “gourmet food stores.” This encompasses a wide range of specialty import shops, high-end delicatessans and cafes, and natural foods stores.
Gourmet food stores typically have relations with a number of far-flung distributors around the world, and access to direct sellers for major foreign brands. Large gourmet chains, like Bread and Circus, can benefit from economies of scale and obtaining more hard-to-find items in bulk. Smaller, owner-operated stores such as ours pay higher prices and have less space to store overstock or seasonal items.
Our success will depend on knowing our clientele, and what they want. Our challenges are to keep enough popular items in stock for repeat customers, while introducing new and seasonal items and specials frequently enough to keep buyers intrigued.
Many gourmet food stores offer meals or individual dishes prepared in the store. In addition to our frozen pre-made selections, Sarrica’s Market will have a deli, open for breakfast, lunch and dinner, and an in-store seating area. This part of our business competes with local restaurants and grocery stores. Our deli must offer foods that are familiar enough not to intimidate customers, but interesting, with new combinations or unique ingredients, to provide them with a sense of adventure and indulgence. The deli and the store offerings should complement each other.
4.3.1 Competition and Buying Patterns
In the gourmet food store industry, businesses must distinguish themselves from competitors (grocery stores, restaurants, cafes) by offering unique, hard-to-find groceries, and/or interesting, difficult-to-make prepared foods. They must convince customers that the special quality of their products and service is worth the price premium they pay.
In Moab, customers shop for groceries based on convenience, selection, and price. Sarrica’s market does not intend to compete with regular grocery stores on standard items – toilet paper, dog food, canned tuna, etc. Instead, we will exploit a previously unoccupied grocery niche: the gourmet food store, offering items otherwise unobtainable locally. Moab residents looking for gourmet foods are also looking for convenience, selection and price, and our competitors for their business (stores in larger towns, online, etc) are less convenient (farther away or longer waits for delivery), although they offer similar selections and prices. Visitors to Moab are looking for treats and meals that match their definitions of their trips: adventures, indulgent holidays, or experiencing new and interesting sights and sensations. Sarrica’s will offer foods that fit all of these desires.
Moab residents are used to long winters with frequent snowfall, making roads between here and the major cities obstacles. Our convenience factor in the winter for these residents is thus much higher than our competitors. For visitors, we offer a convenient alternative to bringing gourmet foods with them from home, and a more interesting shopping and dining experience than can be found in other local stores and restaurants.
Strategy and Implementation Summary
Our strategy will exploit our advantages over the competition (location, convenience, and high quality) with carefully-tracked milestones for growth.
Marketing
Initial marketing efforts for opening will be geared towards generating name recognition and making a clear distinction between Sarrica’s and other local competitors. Follow-up marketing programs will encourage repeat visits and assist customers in the understanding, appreciation, and preparation of our products.
Sales and Pricing
We will gear prices towards our competitors in the nearest cities and online, with a small “convenience” increase for offering them locally. This will offset our distribution costs. Local discounts, daily specials, and new products will satisfy customers they are getting a good value, while keeping them intrigued. Our emphasis on consistently good service, from special orders to recipe help, will make new customers repeat customers.
Alliances
Sarrica’s Market will aggressively pursue relations with local sporting goods outfitters (picnic lunches for hikers), restaurants (featured gourmet ingredient of the week), and local farmers and artisans (fresh local foods and souvenirs).
5.1 Competitive Edge
- Location is critical to success. Our store needs to be on Main Street or just off Main Street so we can take advantage of walk-by and drive-by traffic. We also need adequate parking to make shopping at our store convenient for drivers.
- Convenience. Moab residents and visitors are willing to pay a little bit more for good food and the convenience of being able to get what they want without having to travel out of town or order over the internet. Our customers will purchase our food because it is authentic and delicious.
- High quality. Focusing on high quality international food will draw customers from the competition, as well as create a local market that has not existed before in Moab. If the prices are reasonable and the food is good, we will have growth through repeat business.
5.2 Marketing Strategy
Our marketing strategy consists of promotional advertisements in local newspapers, the yellow pages, and at local businesses, postcards & flyers sent through the mail, and promotional coffee mugs given to local customers that can be filled and refilled at a discount. We also plan on supporting the community radio station in exchange for mentioning us as an underwriter; giving free product samples to our customers; and offering cooking classes and recipes that introduce customers to our products.
5.3 Sales Strategy
Sarrica’s Market most important sales strategy is developing an environment in which customers will return time-after-time because our market provides knowledgeable, friendly staff, quality products, and a comfortable atmosphere that fills their needs.
When customers visit our store, they will know they are entering a clean facility with the best service in the industry. Our pricing strategy will focus on providing high quality, hard to find international products and services at a fair price. Because our closest competition is far away, we will be able to charge a little more for some products, but must be careful not to price our items too high or customers will continue to stock up on specialty foods when they visit large cities or will buy over the internet.
We will make use of local discounts, daily specials, and new products to keep customers interested and to help them feel they are getting a good value. Sarrica’s Market intends to listen to its customers and collect their feedback through surveys and friendly conversation, in order to determine areas where we can expand and/or improve. We want Sarrica’s Market to become a staple in the local community, as well as a “must stop shop” to vacationers visiting Moab.
5.4 Strategic Alliances
Sarrica’s Market will work to form strategic alliances with local businesses, including: outfitters, hotels, and restaurants. We will also form relationships with local produce growers and artists to customize the food/gift items we sell and enhance our presence in the community.
5.5 Sales Forecast
The following assumptions, table and chart illustrate our conservative sales forecast.
Assumptions:
- The average item sold in the market will cost $4.50
- $20.00/average sale x 40 people/day x # of days in January, February, November, and December (slow season).
- $30.00/average sale x 75 people/day x # of days in each month from March-October (busy season).


| Sales Forecast | |||
| Year 1 | Year 2 | Year 3 | |
| Sales | |||
| Grocery Items | $175,600 | $184,380 | $193,599 |
| Delicatessen – Cheese, meat, produce | $126,000 | $132,300 | $138,915 |
| Drinks | $87,000 | $91,350 | $95,918 |
| Frozen | $38,100 | $40,005 | $42,005 |
| Gift Merchandise | $30,000 | $31,500 | $33,075 |
| Other | $5,200 | $5,200 | $5,200 |
| Total Sales | $461,900 | $484,735 | $508,712 |
| Direct Cost of Sales | Year 1 | Year 2 | Year 3 |
| Grocery Items | $105,360 | $107,467 | $109,617 |
| Delicatessen – cheese, meat, produce | $75,600 | $77,112 | $78,654 |
| Drinks | $52,200 | $53,244 | $54,309 |
| Frozen | $22,860 | $23,317 | $23,784 |
| Gift Merchandise | $18,000 | $18,360 | $18,727 |
| Other | $3,120 | $3,120 | $3,120 |
| Subtotal Direct Cost of Sales | $277,140 | $282,620 | $288,210 |
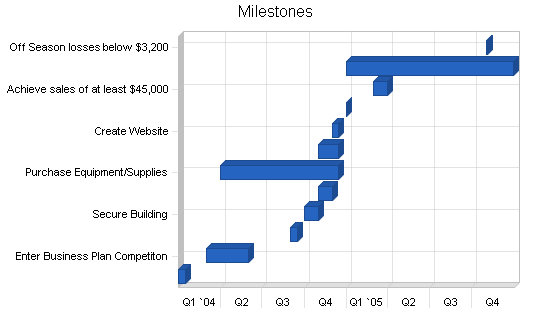
5.6 Milestones
The following table presents important events, their scheduled start and ending dates,and the person(s) who will accomplish the task.
| Milestones | |||||
| Milestone | Start Date | End Date | Budget | Manager | Department |
| Do Start-up Marketing | 1/1/2004 | 1/15/2004 | $4,000 | Rosie | Marketing |
| Enter Business Plan Competiton | 3/1/2004 | 5/31/2004 | $0 | Rosie | Owners |
| Secure Loans | 9/1/2004 | 9/15/2004 | $120,000 | Rosie | Admin |
| Secure Building | 10/1/2004 | 11/1/2004 | $0 | Rosie | Admin |
| Renovate Building | 11/1/2004 | 12/1/2004 | $14,000 | Andy, Cathy, Rosie | Admin |
| Purchase Equipment/Supplies | 4/1/2004 | 12/15/2004 | $30,000 | Andy, Cathy, Rosie | Mgmt Team |
| Order Start-up Inventory | 11/1/2004 | 12/15/2004 | $20,000 | Andy, Cathy, Rosie | Mgmt Team |
| Create Website | 12/1/2004 | 12/15/2004 | $1,000 | Rosie | Web Designer |
| Open Doors | 1/1/2005 | 1/1/2005 | $0 | Andy,Cathy, Rosie | All |
| Achieve sales of at least $45,000 | 3/1/2005 | 3/31/2005 | $0 | All | All |
| Evaluate/Revise Plan | 1/1/2005 | 12/31/2005 | $0 | Andy, Cathy, Rosie | Admin |
| Off Season losses below $3,200 | 11/1/2005 | 11/31/05 | $0 | Andy, Cathy, Rosie | Admin |
| Totals | $189,000 | ||||
Web Plan Summary
Sarrica’s Market’s website is intended to be an enjoyable virtual shopping experience for our customers. Our website will be simple, elegant, and well designed. It is important that our website is kept current and provides a format in which customers can easily preview gift baskets and other groceries.
6.1 Website Marketing Strategy
Sarrica’s Market website will grow in popularity as we inform our customers about it. We will let customers know about our gift basket service and online shopping options when ever it seems appropriate. We will display our web address in the store and print our it on our promotional materials, including advertisements, bags, and mugs.
6.2 Development Requirements
We will hire a company to design our initial web site and will require access to the template so that our staff can make additions or changes to it at will.
Management Summary
Sarrica’s Market is a small, family-run business with four owners. Two of the owners (Andy and Cathy) will be the managers for the store until it is determined we need to hire additional staff. The other two owners will maintain outside jobs, help out when needed in the store, and do the administrative tasks.
Owner/Manager (Andy Boone): Deli Manager
- Manages deli
- Works with Merchandise Manager
- Does hiring
- Order deli items
Owner/Manager (Cathy O’Connor): Merchandise Manager
- Makes merchandise decisions
- Works with Deli Manager
- Orders Merchandise
- Does marketing/promotions
Owner/Manager (Rosie O’Connor): Book Keeper/Administrator
- Keeps books
- Pays taxes
- Does payroll
- Helps with store operations when necessary
Owner/Manager (Kenny VanStone): Web Master/Support
- Manages website
- Helps with store operations when necessary
7.1 Personnel Plan
The personnel plan is illustrated in the table below:
| Personnel Plan | |||
| Year 1 | Year 2 | Year 3 | |
| Owners: Managers (2) | $48,000 | $48,000 | $52,000 |
| Clerks (1-2) | $25,600 | $25,600 | $25,600 |
| Accounting/Books (1) | $2,400 | $5,000 | $5,000 |
| Cooks/Kitchen (1) | $10,240 | $10,240 | $10,240 |
| Other | $0 | $0 | $0 |
| Total People | 4 | 6 | 6 |
| Total Payroll | $86,240 | $88,840 | $92,840 |
Financial Plan
As our Sales Forecast made clear, profits will initially be seasonal. We expect to sustain small losses in the winter months for the first year, until our local clientele is fully established. Summer sales increases are based on the much larger number of potential customers in Moab then, and the trend for visitors to spend more per purchase than the locals.
We have planned for this seasonal variance, and the funding we are requesting will help to maintain a positive cash balance throughout the first three years, until we become fully profitable. The owners are receiving no dividends, and have some margin to reduce their own salaries from what is projected to cushion any unexpected short-term shortfalls.
Our partnership agreement includes an exit plan (see topic 9.0, below), with clear agreements on what constitutes “success” or “failure” in each timeframe. If the businesses sustains larger than acceptable losses, our chief priority will be repaying our creditors, with recouping of owner investments as the last item on the payback list.
8.1 Break-even Analysis
Our estimated monthly revenue break-even point includes payroll, rent, utilities, cost of goods, and other operating costs. We expect summer sales to make up for the slow winter months.
Being a family-run business will be an asset, because we will have the flexibility to adjust our expenses each month in order to maintain a positive cash flow.

| Break-even Analysis | |
| Monthly Revenue Break-even | $32,425 |
| Assumptions: | |
| Average Percent Variable Cost | 60% |
| Estimated Monthly Fixed Cost | $12,970 |
8.2 Projected Profit and Loss
Projected profit and loss illustrated in the following table and charts. Sarrica’s Market will be profitable early in the first year, with net profit rising over the next two years.


| Pro Forma Profit and Loss | |||
| Year 1 | Year 2 | Year 3 | |
| Sales | $461,900 | $484,735 | $508,712 |
| Direct Cost of Sales | $277,140 | $282,620 | $288,210 |
| Hidden Row | $0 | $0 | $0 |
| Total Cost of Sales | $277,140 | $282,620 | $288,210 |
| Gross Margin | $184,760 | $202,115 | $220,501 |
| Gross Margin % | 40.00% | 41.70% | 43.35% |
| Expenses | |||
| Payroll | $86,240 | $88,840 | $92,840 |
| Marketing/Postage/Other | $6,000 | $6,000 | $6,000 |
| Depreciation | $2,500 | $2,500 | $2,500 |
| Legal | $1,200 | $1,200 | $1,200 |
| Books/Accounting | $1,200 | $2,400 | $2,400 |
| Licenses/Permits/Memberships | $900 | $900 | $900 |
| Delivery/Transportation | $4,800 | $4,800 | $4,800 |
| Insurance | $3,600 | $3,600 | $3,600 |
| Rent | $30,000 | $30,000 | $30,000 |
| Utilities | $12,000 | $12,000 | $12,000 |
| Equipment/Supplies | $4,800 | $4,800 | $4,800 |
| Building/Equipment Maintenence | $1,200 | $1,200 | $1,200 |
| Payroll Taxes | $0 | $0 | $0 |
| Other | $1,200 | $1,200 | $1,200 |
| Total Operating Expenses | $155,640 | $159,440 | $163,440 |
| Profit Before Interest and Taxes | $29,120 | $42,675 | $57,061 |
| EBITDA | $31,620 | $45,175 | $59,561 |
| Interest Expense | $5,997 | $5,107 | $4,179 |
| Taxes Incurred | $6,937 | $11,270 | $15,865 |
| Net Profit | $16,186 | $26,297 | $37,018 |
| Net Profit/Sales | 3.50% | 5.43% | 7.28% |
8.3 Projected Cash Flow
Below is our projected cash flow. Sarrica’s will maintain a positive cash balance while covering expenses and repaying our loan.

| Pro Forma Cash Flow | |||
| Year 1 | Year 2 | Year 3 | |
| Cash Received | |||
| Cash from Operations | |||
| Cash Sales | $461,900 | $484,735 | $508,712 |
| Subtotal Cash from Operations | $461,900 | $484,735 | $508,712 |
| Additional Cash Received | |||
| Sales Tax, VAT, HST/GST Received | $0 | $0 | $0 |
| New Current Borrowing | $0 | $0 | $0 |
| New Other Liabilities (interest-free) | $0 | $0 | $0 |
| New Long-term Liabilities | $0 | $0 | $0 |
| Sales of Other Current Assets | $0 | $0 | $0 |
| Sales of Long-term Assets | $0 | $0 | $0 |
| New Investment Received | $0 | $0 | $0 |
| Subtotal Cash Received | $461,900 | $484,735 | $508,712 |
| Expenditures | Year 1 | Year 2 | Year 3 |
| Expenditures from Operations | |||
| Cash Spending | $86,240 | $88,840 | $92,840 |
| Bill Payments | $334,497 | $356,068 | $375,923 |
| Subtotal Spent on Operations | $420,737 | $444,908 | $468,763 |
| Additional Cash Spent | |||
| Sales Tax, VAT, HST/GST Paid Out | $0 | $0 | $0 |
| Principal Repayment of Current Borrowing | $0 | $0 | $0 |
| Other Liabilities Principal Repayment | $0 | $0 | $0 |
| Long-term Liabilities Principal Repayment | $14,286 | $14,285 | $14,285 |
| Purchase Other Current Assets | $0 | $0 | $0 |
| Purchase Long-term Assets | $0 | $0 | $0 |
| Dividends | $0 | $0 | $0 |
| Subtotal Cash Spent | $435,023 | $459,193 | $483,048 |
| Net Cash Flow | $26,877 | $25,542 | $25,664 |
| Cash Balance | $42,577 | $68,120 | $93,784 |
8.4 Projected Balance Sheet
Our projected Balance Sheet, based on well-researched sales and expense forecasts, shows a steadily increasing net worth.
| Pro Forma Balance Sheet | |||
| Year 1 | Year 2 | Year 3 | |
| Assets | |||
| Current Assets | |||
| Cash | $42,577 | $68,120 | $93,784 |
| Inventory | $16,368 | $16,692 | $17,022 |
| Other Current Assets | $5,000 | $5,000 | $5,000 |
| Total Current Assets | $63,945 | $89,811 | $115,806 |
| Long-term Assets | |||
| Long-term Assets | $20,000 | $20,000 | $20,000 |
| Accumulated Depreciation | $2,500 | $5,000 | $7,500 |
| Total Long-term Assets | $17,500 | $15,000 | $12,500 |
| Total Assets | $81,445 | $104,811 | $128,306 |
| Liabilities and Capital | Year 1 | Year 2 | Year 3 |
| Current Liabilities | |||
| Accounts Payable | $18,845 | $30,199 | $30,960 |
| Current Borrowing | $0 | $0 | $0 |
| Other Current Liabilities | $0 | $0 | $0 |
| Subtotal Current Liabilities | $18,845 | $30,199 | $30,960 |
| Long-term Liabilities | $85,714 | $71,429 | $57,144 |
| Total Liabilities | $104,559 | $101,628 | $88,104 |
| Paid-in Capital | $24,000 | $24,000 | $24,000 |
| Retained Earnings | ($63,300) | ($47,114) | ($20,817) |
| Earnings | $16,186 | $26,297 | $37,018 |
| Total Capital | ($23,114) | $3,183 | $40,201 |
| Total Liabilities and Capital | $81,445 | $104,811 | $128,306 |
| Net Worth | ($23,114) | $3,183 | $40,201 |
8.5 Business Ratios
The following table outlines some of the more important ratios from the Gourmet Food Stores industry. The final column, Industry Profile, details specific ratios based on the industry as it is classified by the Standard Industry Classification (SIC) code, 5499.
| Ratio Analysis | ||||
| Year 1 | Year 2 | Year 3 | Industry Profile | |
| Sales Growth | 0.00% | 4.94% | 4.95% | 3.96% |
| Percent of Total Assets | ||||
| Inventory | 20.10% | 15.93% | 13.27% | 19.65% |
| Other Current Assets | 6.14% | 4.77% | 3.90% | 37.17% |
| Total Current Assets | 78.51% | 85.69% | 90.26% | 65.22% |
| Long-term Assets | 21.49% | 14.31% | 9.74% | 34.78% |
| Total Assets | 100.00% | 100.00% | 100.00% | 100.00% |
| Current Liabilities | 23.14% | 28.81% | 24.13% | 24.57% |
| Long-term Liabilities | 105.24% | 68.15% | 44.54% | 25.08% |
| Total Liabilities | 128.38% | 96.96% | 68.67% | 49.65% |
| Net Worth | -28.38% | 3.04% | 31.33% | 50.35% |
| Percent of Sales | ||||
| Sales | 100.00% | 100.00% | 100.00% | 100.00% |
| Gross Margin | 40.00% | 41.70% | 43.35% | 32.20% |
| Selling, General & Administrative Expenses | 40.11% | 38.22% | 35.79% | 17.91% |
| Advertising Expenses | 0.00% | 0.00% | 0.00% | 1.57% |
| Profit Before Interest and Taxes | 6.30% | 8.80% | 11.22% | 0.87% |
| Main Ratios | ||||
| Current | 3.39 | 2.97 | 3.74 | 1.96 |
| Quick | 2.52 | 2.42 | 3.19 | 0.98 |
| Total Debt to Total Assets | 128.38% | 96.96% | 68.67% | 61.35% |
| Pre-tax Return on Net Worth | -100.04% | 1180.13% | 131.54% | 3.41% |
| Pre-tax Return on Assets | 28.39% | 35.84% | 41.22% | 8.82% |
| Additional Ratios | Year 1 | Year 2 | Year 3 | |
| Net Profit Margin | 3.50% | 5.43% | 7.28% | n.a |
| Return on Equity | 0.00% | 826.09% | 92.08% | n.a |
| Activity Ratios | ||||
| Inventory Turnover | 10.82 | 17.10 | 17.10 | n.a |
| Accounts Payable Turnover | 18.75 | 12.17 | 12.17 | n.a |
| Payment Days | 27 | 24 | 30 | n.a |
| Total Asset Turnover | 5.67 | 4.62 | 3.96 | n.a |
| Debt Ratios | ||||
| Debt to Net Worth | 0.00 | 31.93 | 2.19 | n.a |
| Current Liab. to Liab. | 0.18 | 0.30 | 0.35 | n.a |
| Liquidity Ratios | ||||
| Net Working Capital | $45,100 | $59,612 | $84,845 | n.a |
| Interest Coverage | 4.86 | 8.36 | 13.66 | n.a |
| Additional Ratios | ||||
| Assets to Sales | 0.18 | 0.22 | 0.25 | n.a |
| Current Debt/Total Assets | 23% | 29% | 24% | n.a |
| Acid Test | 2.52 | 2.42 | 3.19 | n.a |
| Sales/Net Worth | 0.00 | 152.27 | 12.65 | n.a |
| Dividend Payout | 0.00 | 0.00 | 0.00 | n.a |
Exit Strategy
The owners of Sarrica’s Market will exit this endeavor after they have created a flourishing business that could be sold for a substantial profit and/or as a franchise that could serve rural communities across the country. It is the owners’ intention to run this business until they are ready to retire or have decided to sell the business and start another.
In the event the proposed plan is not successful the owners will implement necessary measures to exit the business endeavor with minimal damage to the owners and investors. All equipment and merchandise will be sold to cover any outstanding debts. Any remaining debt will be paid by the owners in the form of monthly payments untill all debts are paid in full. Definitions of “successful” and time limits for achieving milestones have been included in the owners’ partnership agreement.
The success of the business will be monitored monthly in the first year and quarterly in subsequent years. The owners are aware that it usually takes new businesses three years to start turning a profit and that the business could operate at a loss during that time. The owners will keep this in mind when evaluating the state of the business, and make adjustments when possible to keep the business running with a positive cash flow.
Acceptable loss has been determined; if the business exceeds this amount and is unable to compensate the owners, we will begin the the process of closing the business and paying back debt.
Appendix
| Sales Forecast | |||||||||||||
| Month 1 | Month 2 | Month 3 | Month 4 | Month 5 | Month 6 | Month 7 | Month 8 | Month 9 | Month 10 | Month 11 | Month 12 | ||
| Sales | |||||||||||||
| Grocery Items | 0% | $8,000 | $7,800 | $18,000 | $18,000 | $18,000 | $18,000 | $18,000 | $18,000 | $18,000 | $18,000 | $7,800 | $8,000 |
| Delicatessen – Cheese, meat, produce | 0% | $8,000 | $7,000 | $12,000 | $12,000 | $12,000 | $12,000 | $12,000 | $12,000 | $12,000 | $12,000 | $7,000 | $8,000 |
| Drinks | 0% | $4,000 | $3,500 | $9,000 | $9,000 | $9,000 | $9,000 | $9,000 | $9,000 | $9,000 | $9,000 | $3,500 | $4,000 |
| Frozen | 0% | $2,000 | $1,800 | $4,000 | $3,500 | $4,000 | $3,500 | $4,000 | $4,000 | $3,500 | $4,000 | $1,800 | $2,000 |
| Gift Merchandise | 0% | $2,500 | $2,000 | $3,000 | $2,000 | $3,000 | $2,000 | $3,000 | $3,000 | $2,000 | $3,000 | $2,000 | $2,500 |
| Other | 0% | $300 | $300 | $500 | $500 | $500 | $500 | $500 | $500 | $500 | $500 | $300 | $300 |
| Total Sales | $24,800 | $22,400 | $46,500 | $45,000 | $46,500 | $45,000 | $46,500 | $46,500 | $45,000 | $46,500 | $22,400 | $24,800 | |
| Direct Cost of Sales | Month 1 | Month 2 | Month 3 | Month 4 | Month 5 | Month 6 | Month 7 | Month 8 | Month 9 | Month 10 | Month 11 | Month 12 | |
| Grocery Items | $4,800 | $4,680 | $10,800 | $10,800 | $10,800 | $10,800 | $10,800 | $10,800 | $10,800 | $10,800 | $4,680 | $4,800 | |
| Delicatessen – cheese, meat, produce | $4,800 | $4,200 | $7,200 | $7,200 | $7,200 | $7,200 | $7,200 | $7,200 | $7,200 | $7,200 | $4,200 | $4,800 | |
| Drinks | $2,400 | $2,100 | $5,400 | $5,400 | $5,400 | $5,400 | $5,400 | $5,400 | $5,400 | $5,400 | $2,100 | $2,400 | |
| Frozen | $1,200 | $1,080 | $2,400 | $2,100 | $2,400 | $2,100 | $2,400 | $2,400 | $2,100 | $2,400 | $1,080 | $1,200 | |
| Gift Merchandise | $1,500 | $1,200 | $1,800 | $1,200 | $1,800 | $1,200 | $1,800 | $1,800 | $1,200 | $1,800 | $1,200 | $1,500 | |
| Other | $180 | $180 | $300 | $300 | $300 | $300 | $300 | $300 | $300 | $300 | $180 | $180 | |
| Subtotal Direct Cost of Sales | $14,880 | $13,440 | $27,900 | $27,000 | $27,900 | $27,000 | $27,900 | $27,900 | $27,000 | $27,900 | $13,440 | $14,880 | |
| Personnel Plan | |||||||||||||
| Month 1 | Month 2 | Month 3 | Month 4 | Month 5 | Month 6 | Month 7 | Month 8 | Month 9 | Month 10 | Month 11 | Month 12 | ||
| Owners: Managers (2) | 0% | $4,000 | $4,000 | $4,000 | $4,000 | $4,000 | $4,000 | $4,000 | $4,000 | $4,000 | $4,000 | $4,000 | $4,000 |
| Clerks (1-2) | 0% | $1,280 | $1,280 | $2,560 | $2,560 | $2,560 | $2,560 | $2,560 | $2,560 | $2,560 | $2,560 | $1,280 | $1,280 |
| Accounting/Books (1) | 0% | $200 | $200 | $200 | $200 | $200 | $200 | $200 | $200 | $200 | $200 | $200 | $200 |
| Cooks/Kitchen (1) | 0% | $0 | $0 | $1,280 | $1,280 | $1,280 | $1,280 | $1,280 | $1,280 | $1,280 | $1,280 | $0 | $0 |
| Other | 0% | $0 | $0 | $0 | $0 | $0 | $0 | $0 | $0 | $0 | $0 | $0 | $0 |
| Total People | 4 | 4 | 6 | 6 | 6 | 6 | 6 | 6 | 6 | 6 | 4 | 4 | |
| Total Payroll | $5,480 | $5,480 | $8,040 | $8,040 | $8,040 | $8,040 | $8,040 | $8,040 | $8,040 | $8,040 | $5,480 | $5,480 | |
| Pro Forma Profit and Loss | |||||||||||||
| Month 1 | Month 2 | Month 3 | Month 4 | Month 5 | Month 6 | Month 7 | Month 8 | Month 9 | Month 10 | Month 11 | Month 12 | ||
| Sales | $24,800 | $22,400 | $46,500 | $45,000 | $46,500 | $45,000 | $46,500 | $46,500 | $45,000 | $46,500 | $22,400 | $24,800 | |
| Direct Cost of Sales | $14,880 | $13,440 | $27,900 | $27,000 | $27,900 | $27,000 | $27,900 | $27,900 | $27,000 | $27,900 | $13,440 | $14,880 | |
| Hidden Row | $0 | $0 | $0 | $0 | $0 | $0 | $0 | $0 | $0 | $0 | $0 | $0 | |
| Total Cost of Sales | $14,880 | $13,440 | $27,900 | $27,000 | $27,900 | $27,000 | $27,900 | $27,900 | $27,000 | $27,900 | $13,440 | $14,880 | |
| Gross Margin | $9,920 | $8,960 | $18,600 | $18,000 | $18,600 | $18,000 | $18,600 | $18,600 | $18,000 | $18,600 | $8,960 | $9,920 | |
| Gross Margin % | 40.00% | 40.00% | 40.00% | 40.00% | 40.00% | 40.00% | 40.00% | 40.00% | 40.00% | 40.00% | 40.00% | 40.00% | |
| Expenses | |||||||||||||
| Payroll | $5,480 | $5,480 | $8,040 | $8,040 | $8,040 | $8,040 | $8,040 | $8,040 | $8,040 | $8,040 | $5,480 | $5,480 | |
| Marketing/Postage/Other | $500 | $500 | $500 | $500 | $500 | $500 | $500 | $500 | $500 | $500 | $500 | $500 | |
| Depreciation | $208 | $208 | $208 | $208 | $208 | $208 | $208 | $208 | $208 | $208 | $208 | $208 | |
| Legal | $100 | $100 | $100 | $100 | $100 | $100 | $100 | $100 | $100 | $100 | $100 | $100 | |
| Books/Accounting | $100 | $100 | $100 | $100 | $100 | $100 | $100 | $100 | $100 | $100 | $100 | $100 | |
| Licenses/Permits/Memberships | $75 | $75 | $75 | $75 | $75 | $75 | $75 | $75 | $75 | $75 | $75 | $75 | |
| Delivery/Transportation | $400 | $400 | $400 | $400 | $400 | $400 | $400 | $400 | $400 | $400 | $400 | $400 | |
| Insurance | $300 | $300 | $300 | $300 | $300 | $300 | $300 | $300 | $300 | $300 | $300 | $300 | |
| Rent | $2,500 | $2,500 | $2,500 | $2,500 | $2,500 | $2,500 | $2,500 | $2,500 | $2,500 | $2,500 | $2,500 | $2,500 | |
| Utilities | $1,000 | $1,000 | $1,000 | $1,000 | $1,000 | $1,000 | $1,000 | $1,000 | $1,000 | $1,000 | $1,000 | $1,000 | |
| Equipment/Supplies | $400 | $400 | $400 | $400 | $400 | $400 | $400 | $400 | $400 | $400 | $400 | $400 | |
| Building/Equipment Maintenence | $100 | $100 | $100 | $100 | $100 | $100 | $100 | $100 | $100 | $100 | $100 | $100 | |
| Payroll Taxes | 15% | $0 | $0 | $0 | $0 | $0 | $0 | $0 | $0 | $0 | $0 | $0 | $0 |
| Other | $100 | $100 | $100 | $100 | $100 | $100 | $100 | $100 | $100 | $100 | $100 | $100 | |
| Total Operating Expenses | $11,263 | $11,263 | $13,823 | $13,823 | $13,823 | $13,823 | $13,823 | $13,823 | $13,823 | $13,823 | $11,263 | $11,263 | |
| Profit Before Interest and Taxes | ($1,343) | ($2,303) | $4,777 | $4,177 | $4,777 | $4,177 | $4,777 | $4,777 | $4,177 | $4,777 | ($2,303) | ($1,343) | |
| EBITDA | ($1,135) | ($2,095) | $4,985 | $4,385 | $4,985 | $4,385 | $4,985 | $4,985 | $4,385 | $4,985 | ($2,095) | ($1,135) | |
| Interest Expense | $535 | $529 | $522 | $516 | $509 | $503 | $497 | $490 | $484 | $477 | $471 | $464 | |
| Taxes Incurred | ($564) | ($850) | $1,276 | $1,098 | $1,280 | $1,102 | $1,284 | $1,286 | $1,108 | $1,290 | ($832) | ($542) | |
| Net Profit | ($1,315) | ($1,982) | $2,978 | $2,563 | $2,987 | $2,572 | $2,996 | $3,001 | $2,585 | $3,010 | ($1,942) | ($1,265) | |
| Net Profit/Sales | -5.30% | -8.85% | 6.40% | 5.69% | 6.42% | 5.71% | 6.44% | 6.45% | 5.74% | 6.47% | -8.67% | -5.10% | |
| Pro Forma Cash Flow | |||||||||||||
| Month 1 | Month 2 | Month 3 | Month 4 | Month 5 | Month 6 | Month 7 | Month 8 | Month 9 | Month 10 | Month 11 | Month 12 | ||
| Cash Received | |||||||||||||
| Cash from Operations | |||||||||||||
| Cash Sales | $24,800 | $22,400 | $46,500 | $45,000 | $46,500 | $45,000 | $46,500 | $46,500 | $45,000 | $46,500 | $22,400 | $24,800 | |
| Subtotal Cash from Operations | $24,800 | $22,400 | $46,500 | $45,000 | $46,500 | $45,000 | $46,500 | $46,500 | $45,000 | $46,500 | $22,400 | $24,800 | |
| Additional Cash Received | |||||||||||||
| Sales Tax, VAT, HST/GST Received | 0.00% | $0 | $0 | $0 | $0 | $0 | $0 | $0 | $0 | $0 | $0 | $0 | $0 |
| New Current Borrowing | $0 | $0 | $0 | $0 | $0 | $0 | $0 | $0 | $0 | $0 | $0 | $0 | |
| New Other Liabilities (interest-free) | $0 | $0 | $0 | $0 | $0 | $0 | $0 | $0 | $0 | $0 | $0 | $0 | |
| New Long-term Liabilities | $0 | $0 | $0 | $0 | $0 | $0 | $0 | $0 | $0 | $0 | $0 | $0 | |
| Sales of Other Current Assets | $0 | $0 | $0 | $0 | $0 | $0 | $0 | $0 | $0 | $0 | $0 | $0 | |
| Sales of Long-term Assets | $0 | $0 | $0 | $0 | $0 | $0 | $0 | $0 | $0 | $0 | $0 | $0 | |
| New Investment Received | $0 | $0 | $0 | $0 | $0 | $0 | $0 | $0 | $0 | $0 | $0 | $0 | |
| Subtotal Cash Received | $24,800 | $22,400 | $46,500 | $45,000 | $46,500 | $45,000 | $46,500 | $46,500 | $45,000 | $46,500 | $22,400 | $24,800 | |
| Expenditures | Month 1 | Month 2 | Month 3 | Month 4 | Month 5 | Month 6 | Month 7 | Month 8 | Month 9 | Month 10 | Month 11 | Month 12 | |
| Expenditures from Operations | |||||||||||||
| Cash Spending | $5,480 | $5,480 | $8,040 | $8,040 | $8,040 | $8,040 | $8,040 | $8,040 | $8,040 | $8,040 | $5,480 | $5,480 | |
| Bill Payments | $560 | $16,805 | $18,246 | $50,580 | $33,301 | $36,152 | $33,292 | $36,212 | $35,182 | $33,278 | $35,198 | $5,690 | |
| Subtotal Spent on Operations | $6,040 | $22,285 | $26,286 | $58,620 | $41,341 | $44,192 | $41,332 | $44,252 | $43,222 | $41,318 | $40,678 | $11,170 | |
| Additional Cash Spent | |||||||||||||
| Sales Tax, VAT, HST/GST Paid Out | $0 | $0 | $0 | $0 | $0 | $0 | $0 | $0 | $0 | $0 | $0 | $0 | |
| Principal Repayment of Current Borrowing | $0 | $0 | $0 | $0 | $0 | $0 | $0 | $0 | $0 | $0 | $0 | $0 | |
| Other Liabilities Principal Repayment | $0 | $0 | $0 | $0 | $0 | $0 | $0 | $0 | $0 | $0 | $0 | $0 | |
| Long-term Liabilities Principal Repayment | $1,191 | $1,191 | $1,191 | $1,191 | $1,191 | $1,191 | $1,191 | $1,191 | $1,191 | $1,191 | $1,191 | $1,191 | |
| Purchase Other Current Assets | $0 | $0 | $0 | $0 | $0 | $0 | $0 | $0 | $0 | $0 | $0 | $0 | |
| Purchase Long-term Assets | $0 | $0 | $0 | $0 | $0 | $0 | $0 | $0 | $0 | $0 | $0 | $0 | |
| Dividends | $0 | $0 | $0 | $0 | $0 | $0 | $0 | $0 | $0 | $0 | $0 | $0 | |
| Subtotal Cash Spent | $7,230 | $23,476 | $27,476 | $59,811 | $42,531 | $45,383 | $42,522 | $45,443 | $44,412 | $42,509 | $41,869 | $12,360 | |
| Net Cash Flow | $17,570 | ($1,076) | $19,024 | ($14,811) | $3,969 | ($383) | $3,978 | $1,057 | $588 | $3,991 | ($19,469) | $12,440 | |
| Cash Balance | $33,270 | $32,194 | $51,218 | $36,407 | $40,375 | $39,993 | $43,970 | $45,027 | $45,615 | $49,606 | $30,137 | $42,577 | |
| Pro Forma Balance Sheet | |||||||||||||
| Month 1 | Month 2 | Month 3 | Month 4 | Month 5 | Month 6 | Month 7 | Month 8 | Month 9 | Month 10 | Month 11 | Month 12 | ||
| Assets | Starting Balances | ||||||||||||
| Current Assets | |||||||||||||
| Cash | $15,700 | $33,270 | $32,194 | $51,218 | $36,407 | $40,375 | $39,993 | $43,970 | $45,027 | $45,615 | $49,606 | $30,137 | $42,577 |
| Inventory | $20,000 | $16,368 | $14,784 | $30,690 | $29,700 | $30,690 | $29,700 | $30,690 | $30,690 | $29,700 | $30,690 | $17,250 | $16,368 |
| Other Current Assets | $5,000 | $5,000 | $5,000 | $5,000 | $5,000 | $5,000 | $5,000 | $5,000 | $5,000 | $5,000 | $5,000 | $5,000 | $5,000 |
| Total Current Assets | $40,700 | $54,638 | $51,978 | $86,908 | $71,107 | $76,065 | $74,693 | $79,660 | $80,717 | $80,315 | $85,296 | $52,387 | $63,945 |
| Long-term Assets | |||||||||||||
| Long-term Assets | $20,000 | $20,000 | $20,000 | $20,000 | $20,000 | $20,000 | $20,000 | $20,000 | $20,000 | $20,000 | $20,000 | $20,000 | $20,000 |
| Accumulated Depreciation | $0 | $208 | $417 | $625 | $833 | $1,042 | $1,250 | $1,458 | $1,667 | $1,875 | $2,083 | $2,292 | $2,500 |
| Total Long-term Assets | $20,000 | $19,792 | $19,583 | $19,375 | $19,167 | $18,958 | $18,750 | $18,542 | $18,333 | $18,125 | $17,917 | $17,708 | $17,500 |
| Total Assets | $60,700 | $74,429 | $71,561 | $106,283 | $90,274 | $95,024 | $93,443 | $98,202 | $99,051 | $98,440 | $103,213 | $70,096 | $81,445 |
| Liabilities and Capital | Month 1 | Month 2 | Month 3 | Month 4 | Month 5 | Month 6 | Month 7 | Month 8 | Month 9 | Month 10 | Month 11 | Month 12 | |
| Current Liabilities | |||||||||||||
| Accounts Payable | $0 | $16,235 | $16,540 | $49,474 | $32,092 | $35,046 | $32,084 | $35,037 | $34,076 | $32,071 | $35,024 | $5,040 | $18,845 |
| Current Borrowing | $0 | $0 | $0 | $0 | $0 | $0 | $0 | $0 | $0 | $0 | $0 | $0 | $0 |
| Other Current Liabilities | $0 | $0 | $0 | $0 | $0 | $0 | $0 | $0 | $0 | $0 | $0 | $0 | $0 |
| Subtotal Current Liabilities | $0 | $16,235 | $16,540 | $49,474 | $32,092 | $35,046 | $32,084 | $35,037 | $34,076 | $32,071 | $35,024 | $5,040 | $18,845 |
| Long-term Liabilities | $100,000 | $98,810 | $97,619 | $96,429 | $95,238 | $94,048 | $92,857 | $91,667 | $90,476 | $89,286 | $88,095 | $86,905 | $85,714 |
| Total Liabilities | $100,000 | $115,044 | $114,159 | $145,902 | $127,330 | $129,094 | $124,941 | $126,704 | $124,552 | $121,356 | $123,119 | $91,944 | $104,559 |
| Paid-in Capital | $24,000 | $24,000 | $24,000 | $24,000 | $24,000 | $24,000 | $24,000 | $24,000 | $24,000 | $24,000 | $24,000 | $24,000 | $24,000 |
| Retained Earnings | ($63,300) | ($63,300) | ($63,300) | ($63,300) | ($63,300) | ($63,300) | ($63,300) | ($63,300) | ($63,300) | ($63,300) | ($63,300) | ($63,300) | ($63,300) |
| Earnings | $0 | ($1,315) | ($3,297) | ($319) | $2,243 | $5,230 | $7,802 | $10,798 | $13,799 | $16,384 | $19,393 | $17,451 | $16,186 |
| Total Capital | ($39,300) | ($40,615) | ($42,597) | ($39,619) | ($37,057) | ($34,070) | ($31,498) | ($28,502) | ($25,501) | ($22,916) | ($19,907) | ($21,849) | ($23,114) |
| Total Liabilities and Capital | $60,700 | $74,429 | $71,561 | $106,283 | $90,274 | $95,024 | $93,443 | $98,202 | $99,051 | $98,440 | $103,213 | $70,096 | $81,445 |
| Net Worth | ($39,300) | ($40,615) | ($42,597) | ($39,619) | ($37,057) | ($34,070) | ($31,498) | ($28,502) | ($25,501) | ($22,916) | ($19,907) | ($21,849) | ($23,114) |


