
Justin Seafood Market
Executive Summary
Justin Seafood Market has been providing customers with the finest quality seafood for five years. The business is primarily wholesale to area restaurants. We purchase seafood directly from local fishermen and contacts all along the Florida panhandle. This allows us to pick from the finest selection of seafood available anywhere. Currently, we sell to over sixty restaurants. This a 10% increase over last year and we estimate that we will have additional restaurants as customers next year.
Justin Seafood Market plans to expand our storefront and sell direct to the public. In our expanded market, we will bring our commitment of quality, freshness and great prices to the public. By purchasing in large quantities we are able to pass the savings on to our customer.
The planned renovation will cost $150,000. Additional service staff will be hired to assist customers. Bill Justin, owner of Justin Seafood Market, will invest $50,000 in the expansion and also secure a $100,000 short-term loan.
1.1 Objectives
- Establish Justin Seafood Market as the leader in selling fresh seafood to the public.
- Increase the number of customers buying from Justin Seafood Market by 10% over the next two years.
- Establish a Seafood Discount Club for customers that will build customer loyalty.
1.2 Mission
The mission of Justin Seafood Market is to offer customers the best seafood prices on the highest quality seafood.
1.3 Keys to Success
- Superior products will promote customer loyalty.
- A location that will assure walk-in traffic.
- A program that will create customer loyalty.

Company Summary
Justin Seafood Market is primarily a wholesaler to area restaurants. Bill Justin, owner of Justin Seafood Market, has utilized his wholesale background, his experience in the restaurant industry, and his contacts with the area’s fishermen to build a loyal customer base.
Bill wants to open a seafood market to the public by renovating the building’s storefront to accommodate the public.
2.1 Company Ownership
Bill Justin is the owner of Justin Seafood Market.
2.2 Company History
Bill Justin started Justin Seafood Market in response to the dramatic growth of the Florida panhandle. Over the past five years, the population has increased by 30% in communities along the panhandle. But most importantly, tourists have returned to the area. Last year tourists spent over 400 million dollars with panhandle businesses. A significant portion of those sales were with the area’s loyalty. Currently, there are over 1,350 restaurants but that number grows by 15% annually.
Against this backdrop of growth, Bill Justin launched his market. Starting with ten customers Justin Seafood Market now serves sixty restaurants.

| Past Performance | |||
| 1999 | 2000 | 2001 | |
| Sales | $560,000 | $644,000 | $710,600 |
| Gross Margin | $270,000 | $320,000 | $350,000 |
| Gross Margin % | 48.21% | 49.69% | 49.25% |
| Operating Expenses | $150,000 | $170,000 | $190,000 |
| Collection Period (days) | 0 | 0 | 15 |
| Inventory Turnover | 0.00 | 0.00 | 0.00 |
| Balance Sheet | |||
| 1999 | 2000 | 2001 | |
| Current Assets | |||
| Cash | $40,000 | $50,000 | $50,000 |
| Accounts Receivable | $0 | $0 | $23,686 |
| Inventory | $0 | $0 | $30,050 |
| Other Current Assets | $20,000 | $30,000 | $50,000 |
| Total Current Assets | $60,000 | $80,000 | $153,736 |
| Long-term Assets | |||
| Long-term Assets | $80,000 | $80,000 | $80,000 |
| Accumulated Depreciation | $5,000 | $10,000 | $15,000 |
| Total Long-term Assets | $75,000 | $70,000 | $65,000 |
| Total Assets | $135,000 | $150,000 | $218,736 |
| Current Liabilities | |||
| Accounts Payable | $10,000 | $12,000 | $20,000 |
| Current Borrowing | $0 | $0 | $0 |
| Other Current Liabilities (interest free) | $0 | $0 | $0 |
| Total Current Liabilities | $10,000 | $12,000 | $20,000 |
| Long-term Liabilities | $30,000 | $20,000 | $20,000 |
| Total Liabilities | $40,000 | $32,000 | $40,000 |
| Paid-in Capital | $0 | $0 | $0 |
| Retained Earnings | ($67,000) | ($80,000) | ($37,964) |
| Earnings | $162,000 | $198,000 | $216,700 |
| Total Capital | $95,000 | $118,000 | $178,736 |
| Total Capital and Liabilities | $135,000 | $150,000 | $218,736 |
| Other Inputs | |||
| Payment Days | 0 | 0 | 30 |
| Sales on Credit | $0 | $0 | $284,240 |
| Receivables Turnover | 0.00 | 0.00 | 12.00 |
2.3 Company Locations and Facilities
Justin Seafood Market is located at 3456 Main Street, Tallahassee, Florida. After renovation, the market will have an additional 5,000 ft. of floor space that will be used for the new retail operation.
Products
Justin Seafood Market currently provides numerous seafood products to restaurants in the Florida panhandle. The market’s new public retail outlet will focus on popular seafood selections that will bring customers into the store.
Justin Seafood Market will have the following retail products:
- Jumbo Fresh Gulf Shrimp;
- Alaskan King Crab;
- Florida Lobster;
- Sea Scallops;
- Fresh Gulf Fish Filets;
- Yellowfin Tuna;
- Grouper;
- Snapper;
- Amberjack.
Market Analysis Summary
Tallahassee has a population of over 160,000 residents but the area receives thousands of day tourists each year. Justin Seafood Market is located in the busiest commercial section of Tallahassee with excellent foot traffic. Expanding the market’s storefront by 5,000 ft. will create an inviting environment for the public. The market’s interior design will focus on the motif of an open air fish market. We will advertise the market as a place where the public can get quality seafood at wholesale prices.
4.1 Market Segmentation
Justin Seafood Market is focused on two customer groups:
- Urban professional working downtown.
- Day tourists.

| Market Analysis | |||||||
| 2002 | 2003 | 2004 | 2005 | 2006 | |||
| Potential Customers | Growth | CAGR | |||||
| Urban Professionals | 10% | 30,000 | 33,000 | 36,300 | 39,930 | 43,923 | 10.00% |
| Day Tourists | 0% | 60,000 | 60,000 | 60,000 | 60,000 | 60,000 | 0.00% |
| Total | 3.66% | 90,000 | 93,000 | 96,300 | 99,930 | 103,923 | 3.66% |
Strategy and Implementation Summary
Justin Seafood Market will expand its storefront and sell direct to the public. The market is known as a wholesale operation and we will use that identity to advertise the new service to the public. We will ask the public “Why pay retail when you can get better quality at wholesale prices!” Additional staff will be hired to serve the public.
5.1 Competitive Edge
The competitive edge of Justin Seafood Market is the market’s commitment of quality, freshness and great prices. The market’s location also assures excellent tourist and resident foot traffic.
5.2 Sales Strategy
Justin Seafood Market will employ two sales approaches for its target customers.
- For Urban Professionals: The market will promote membership in its Seafood Discount Club. Residents will be encouraged to join for $20 a year. As a member, all purchases will be discounted $1 per pound. This will result in considerable saving for members who shop regularly at the market.
- For the Day Tourist: The market will offer free 24-hour shipping of purchases in excess of $100. The customer will be able to select the day the seafood will be shipped. The customers will then receive a regular newsletter that will include an invitation to purchase seafood again with same free shipping option.
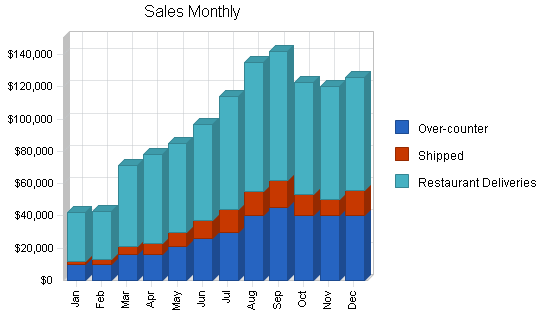
5.2.1 Sales Forecast
The following is a very conservative sales forecast for the next three years. We anticipate actual sales will be much higher after the renovation, but we want to plan for other contingencies.

| Sales Forecast | |||
| 2002 | 2003 | 2004 | |
| Sales | |||
| Over-counter | $334,000 | $350,000 | $380,000 |
| Shipped | $122,000 | $140,000 | $155,000 |
| Restaurant Deliveries | $720,000 | $800,000 | $900,000 |
| Total Sales | $1,176,000 | $1,290,000 | $1,435,000 |
| Direct Cost of Sales | 2002 | 2003 | 2004 |
| Over-counter | $166,500 | $173,000 | $188,000 |
| Shipped | $64,100 | $74,000 | $81,000 |
| Restaurant Deliveries | $359,000 | $409,000 | $459,000 |
| Subtotal Direct Cost of Sales | $589,600 | $656,000 | $728,000 |
Management Summary
Prior to beginning Justin Seafood Market, Bill Justin worked as an account manager for William’s Wholesale Foods and Wilson Seafood for ten years. In his last position with Wilson Seafood, Bill developed an excellent network of fishing contacts in the Florida panhandle, generating sales in excess of $2 million annually. His strength has always been his customer relation skills.
Bill Justin has a BA in marketing from Florida State University. His first position after graduation was as a shift manager with Johnson Seafood Restaurant. In three years, he was promoted to the manager position. During that time, Bill demonstrated the ability to effectively manage a large staff.
6.1 Personnel Plan
The personnel for Justin Seafood Market is as follows:
- Manager;
- Market staff (4 by year end);
- Delivery crew (4 by year end);
- Sales staff (4 by year end);
- Cleanup crew (2);
| Personnel Plan | |||
| 2002 | 2003 | 2004 | |
| Manager | $36,000 | $38,000 | $40,000 |
| Market Staff (2-4) | $71,750 | $90,000 | $96,000 |
| Clean-up Crew (2) | $45,600 | $47,000 | $49,000 |
| Delivery Staff (2-4) | $82,000 | $102,000 | $108,000 |
| Sales Staff (3-4) | $110,000 | $130,000 | $140,000 |
| Total People | 15 | 15 | 15 |
| Total Payroll | $345,350 | $407,000 | $433,000 |
Brought to you by
Create a professional business plan
Using AI and step-by-step instructions
Create Your PlanSecure funding
Validate ideas
Build a strategy
Financial Plan
The following is the financial plan for expansion of Justin Seafood Market to include a new retail market space.
7.1 Break-even Analysis
The following table and chart show our Break-even Analysis for the coming year.

| Break-even Analysis | |
| Monthly Revenue Break-even | $95,418 |
| Assumptions: | |
| Average Percent Variable Cost | 50% |
| Estimated Monthly Fixed Cost | $47,579 |
7.2 Projected Profit and Loss
The following table and charts highlight the projected profit and loss for three years.


| Pro Forma Profit and Loss | |||
| 2002 | 2003 | 2004 | |
| Sales | $1,176,000 | $1,290,000 | $1,435,000 |
| Direct Cost of Sales | $589,600 | $656,000 | $728,000 |
| Other Production Expenses | $0 | $0 | $0 |
| Total Cost of Sales | $589,600 | $656,000 | $728,000 |
| Gross Margin | $586,400 | $634,000 | $707,000 |
| Gross Margin % | 49.86% | 49.15% | 49.27% |
| Expenses | |||
| Payroll | $345,350 | $407,000 | $433,000 |
| Sales and Marketing and Other Expenses | $24,000 | $30,000 | $40,000 |
| Depreciation | $9,600 | $9,600 | $9,600 |
| Renovation Expenses | $150,000 | $0 | $0 |
| Utilities | $6,000 | $6,000 | $6,000 |
| Insurance | $0 | $0 | $0 |
| Rent | $36,000 | $36,000 | $36,000 |
| Payroll Taxes | $0 | $0 | $0 |
| Other | $0 | $0 | $0 |
| Total Operating Expenses | $570,950 | $488,600 | $524,600 |
| Profit Before Interest and Taxes | $15,450 | $145,400 | $182,400 |
| EBITDA | $25,050 | $155,000 | $192,000 |
| Interest Expense | $10,675 | $8,331 | $5,885 |
| Taxes Incurred | $1,432 | $41,121 | $52,955 |
| Net Profit | $3,342 | $95,948 | $123,561 |
| Net Profit/Sales | 0.28% | 7.44% | 8.61% |
7.3 Projected Cash Flow
The following table and chart highlight the projected cash flow for three years.

| Pro Forma Cash Flow | |||
| 2002 | 2003 | 2004 | |
| Cash Received | |||
| Cash from Operations | |||
| Cash Sales | $705,600 | $774,000 | $861,000 |
| Cash from Receivables | $397,286 | $506,616 | $562,065 |
| Subtotal Cash from Operations | $1,102,886 | $1,280,616 | $1,423,065 |
| Additional Cash Received | |||
| Sales Tax, VAT, HST/GST Received | $0 | $0 | $0 |
| New Current Borrowing | $100,000 | $0 | $0 |
| New Other Liabilities (interest-free) | $0 | $0 | $0 |
| New Long-term Liabilities | $0 | $0 | $0 |
| Sales of Other Current Assets | $0 | $0 | $0 |
| Sales of Long-term Assets | $0 | $0 | $0 |
| New Investment Received | $50,000 | $0 | $0 |
| Subtotal Cash Received | $1,252,886 | $1,280,616 | $1,423,065 |
| Expenditures | 2002 | 2003 | 2004 |
| Expenditures from Operations | |||
| Cash Spending | $345,350 | $407,000 | $433,000 |
| Bill Payments | $800,535 | $797,744 | $869,803 |
| Subtotal Spent on Operations | $1,145,885 | $1,204,744 | $1,302,803 |
| Additional Cash Spent | |||
| Sales Tax, VAT, HST/GST Paid Out | $0 | $0 | $0 |
| Principal Repayment of Current Borrowing | $21,600 | $21,600 | $21,600 |
| Other Liabilities Principal Repayment | $0 | $0 | $0 |
| Long-term Liabilities Principal Repayment | $2,860 | $2,860 | $2,860 |
| Purchase Other Current Assets | $0 | $0 | $0 |
| Purchase Long-term Assets | $0 | $0 | $0 |
| Dividends | $0 | $0 | $0 |
| Subtotal Cash Spent | $1,170,345 | $1,229,204 | $1,327,263 |
| Net Cash Flow | $82,541 | $51,412 | $95,801 |
| Cash Balance | $132,541 | $183,953 | $279,754 |
7.4 Projected Balance Sheet
The following table highlights the projected balance sheet for three years.
| Pro Forma Balance Sheet | |||
| 2002 | 2003 | 2004 | |
| Assets | |||
| Current Assets | |||
| Cash | $132,541 | $183,953 | $279,754 |
| Accounts Receivable | $96,800 | $106,184 | $118,119 |
| Inventory | $69,850 | $77,716 | $86,246 |
| Other Current Assets | $50,000 | $50,000 | $50,000 |
| Total Current Assets | $349,191 | $417,853 | $534,120 |
| Long-term Assets | |||
| Long-term Assets | $80,000 | $80,000 | $80,000 |
| Accumulated Depreciation | $24,600 | $34,200 | $43,800 |
| Total Long-term Assets | $55,400 | $45,800 | $36,200 |
| Total Assets | $404,591 | $463,653 | $570,320 |
| Liabilities and Capital | 2002 | 2003 | 2004 |
| Current Liabilities | |||
| Accounts Payable | $76,973 | $64,547 | $72,113 |
| Current Borrowing | $78,400 | $56,800 | $35,200 |
| Other Current Liabilities | $0 | $0 | $0 |
| Subtotal Current Liabilities | $155,373 | $121,347 | $107,313 |
| Long-term Liabilities | $17,140 | $14,280 | $11,420 |
| Total Liabilities | $172,513 | $135,627 | $118,733 |
| Paid-in Capital | $50,000 | $50,000 | $50,000 |
| Retained Earnings | $178,736 | $182,078 | $278,027 |
| Earnings | $3,342 | $95,948 | $123,561 |
| Total Capital | $232,078 | $328,027 | $451,587 |
| Total Liabilities and Capital | $404,591 | $463,653 | $570,320 |
| Net Worth | $232,078 | $328,027 | $451,587 |
7.5 Business Ratios
Business ratios for the years of this plan are shown below. Industry profile ratios based on the Standard Industrial Classification (SIC) code 5146, Fish and Seafood, are shown for comparison.
| Ratio Analysis | ||||
| 2002 | 2003 | 2004 | Industry Profile | |
| Sales Growth | 65.49% | 9.69% | 11.24% | 4.60% |
| Percent of Total Assets | ||||
| Accounts Receivable | 23.93% | 22.90% | 20.71% | 33.30% |
| Inventory | 17.26% | 16.76% | 15.12% | 25.40% |
| Other Current Assets | 12.36% | 10.78% | 8.77% | 24.00% |
| Total Current Assets | 86.31% | 90.12% | 93.65% | 82.70% |
| Long-term Assets | 13.69% | 9.88% | 6.35% | 17.30% |
| Total Assets | 100.00% | 100.00% | 100.00% | 100.00% |
| Current Liabilities | 38.40% | 26.17% | 18.82% | 47.70% |
| Long-term Liabilities | 4.24% | 3.08% | 2.00% | 10.10% |
| Total Liabilities | 42.64% | 29.25% | 20.82% | 57.80% |
| Net Worth | 57.36% | 70.75% | 79.18% | 42.20% |
| Percent of Sales | ||||
| Sales | 100.00% | 100.00% | 100.00% | 100.00% |
| Gross Margin | 49.86% | 49.15% | 49.27% | 14.20% |
| Selling, General & Administrative Expenses | 46.23% | 45.05% | 43.86% | 9.00% |
| Advertising Expenses | 1.02% | 1.16% | 1.39% | 0.30% |
| Profit Before Interest and Taxes | 1.31% | 11.27% | 12.71% | 0.80% |
| Main Ratios | ||||
| Current | 2.25 | 3.44 | 4.98 | 1.64 |
| Quick | 1.80 | 2.80 | 4.17 | 0.97 |
| Total Debt to Total Assets | 42.64% | 29.25% | 20.82% | 57.80% |
| Pre-tax Return on Net Worth | 2.06% | 41.79% | 39.09% | 3.60% |
| Pre-tax Return on Assets | 1.18% | 29.56% | 30.95% | 8.40% |
| Additional Ratios | 2002 | 2003 | 2004 | |
| Net Profit Margin | 0.28% | 7.44% | 8.61% | n.a |
| Return on Equity | 1.44% | 29.25% | 27.36% | n.a |
| Activity Ratios | ||||
| Accounts Receivable Turnover | 4.86 | 4.86 | 4.86 | n.a |
| Collection Days | 57 | 72 | 71 | n.a |
| Inventory Turnover | 10.91 | 8.89 | 8.88 | n.a |
| Accounts Payable Turnover | 11.14 | 12.17 | 12.17 | n.a |
| Payment Days | 28 | 33 | 28 | n.a |
| Total Asset Turnover | 2.91 | 2.78 | 2.52 | n.a |
| Debt Ratios | ||||
| Debt to Net Worth | 0.74 | 0.41 | 0.26 | n.a |
| Current Liab. to Liab. | 0.90 | 0.89 | 0.90 | n.a |
| Liquidity Ratios | ||||
| Net Working Capital | $193,818 | $296,507 | $426,807 | n.a |
| Interest Coverage | 1.45 | 17.45 | 30.99 | n.a |
| Additional Ratios | ||||
| Assets to Sales | 0.34 | 0.36 | 0.40 | n.a |
| Current Debt/Total Assets | 38% | 26% | 19% | n.a |
| Acid Test | 1.17 | 1.93 | 3.07 | n.a |
| Sales/Net Worth | 5.07 | 3.93 | 3.18 | n.a |
| Dividend Payout | 0.00 | 0.00 | 0.00 | n.a |
Appendix
| Sales Forecast | |||||||||||||
| Jan | Feb | Mar | Apr | May | Jun | Jul | Aug | Sep | Oct | Nov | Dec | ||
| Sales | |||||||||||||
| Over-counter | 0% | $10,000 | $10,000 | $16,000 | $16,000 | $21,000 | $26,000 | $30,000 | $40,000 | $45,000 | $40,000 | $40,000 | $40,000 |
| Shipped | 0% | $2,000 | $3,000 | $5,000 | $7,000 | $9,000 | $11,000 | $14,000 | $15,000 | $17,000 | $13,000 | $10,000 | $16,000 |
| Restaurant Deliveries | 0% | $30,000 | $30,000 | $50,000 | $55,000 | $55,000 | $60,000 | $70,000 | $80,000 | $80,000 | $70,000 | $70,000 | $70,000 |
| Total Sales | $42,000 | $43,000 | $71,000 | $78,000 | $85,000 | $97,000 | $114,000 | $135,000 | $142,000 | $123,000 | $120,000 | $126,000 | |
| Direct Cost of Sales | Jan | Feb | Mar | Apr | May | Jun | Jul | Aug | Sep | Oct | Nov | Dec | |
| Over-counter | $5,000 | $5,000 | $8,000 | $8,000 | $10,000 | $13,000 | $15,000 | $20,000 | $22,500 | $20,000 | $20,000 | $20,000 | |
| Shipped | $1,100 | $1,600 | $2,600 | $3,800 | $4,500 | $5,500 | $7,500 | $8,000 | $8,500 | $6,500 | $6,000 | $8,500 | |
| Restaurant Deliveries | $15,000 | $15,000 | $25,000 | $27,000 | $27,000 | $30,000 | $35,000 | $40,000 | $40,000 | $35,000 | $35,000 | $35,000 | |
| Subtotal Direct Cost of Sales | $21,100 | $21,600 | $35,600 | $38,800 | $41,500 | $48,500 | $57,500 | $68,000 | $71,000 | $61,500 | $61,000 | $63,500 | |
| Personnel Plan | |||||||||||||
| Jan | Feb | Mar | Apr | May | Jun | Jul | Aug | Sep | Oct | Nov | Dec | ||
| Manager | 0% | $3,000 | $3,000 | $3,000 | $3,000 | $3,000 | $3,000 | $3,000 | $3,000 | $3,000 | $3,000 | $3,000 | $3,000 |
| Market Staff (2-4) | 0% | $3,500 | $3,500 | $3,500 | $5,250 | $7,000 | $7,000 | $7,000 | $7,000 | $7,000 | $7,000 | $7,000 | $7,000 |
| Clean-up Crew (2) | 0% | $3,800 | $3,800 | $3,800 | $3,800 | $3,800 | $3,800 | $3,800 | $3,800 | $3,800 | $3,800 | $3,800 | $3,800 |
| Delivery Staff (2-4) | 0% | $4,000 | $4,000 | $4,000 | $6,000 | $8,000 | $8,000 | $8,000 | $8,000 | $8,000 | $8,000 | $8,000 | $8,000 |
| Sales Staff (3-4) | 0% | $7,500 | $7,500 | $7,500 | $7,500 | $10,000 | $10,000 | $10,000 | $10,000 | $10,000 | $10,000 | $10,000 | $10,000 |
| Total People | 10 | 10 | 10 | 12 | 15 | 15 | 15 | 15 | 15 | 15 | 15 | 15 | |
| Total Payroll | $21,800 | $21,800 | $21,800 | $25,550 | $31,800 | $31,800 | $31,800 | $31,800 | $31,800 | $31,800 | $31,800 | $31,800 | |
| General Assumptions | |||||||||||||
| Jan | Feb | Mar | Apr | May | Jun | Jul | Aug | Sep | Oct | Nov | Dec | ||
| Plan Month | 1 | 2 | 3 | 4 | 5 | 6 | 7 | 8 | 9 | 10 | 11 | 12 | |
| Current Interest Rate | 10.00% | 10.00% | 10.00% | 10.00% | 10.00% | 10.00% | 10.00% | 10.00% | 10.00% | 10.00% | 10.00% | 10.00% | |
| Long-term Interest Rate | 10.00% | 10.00% | 10.00% | 10.00% | 10.00% | 10.00% | 10.00% | 10.00% | 10.00% | 10.00% | 10.00% | 10.00% | |
| Tax Rate | 30.00% | 30.00% | 30.00% | 30.00% | 30.00% | 30.00% | 30.00% | 30.00% | 30.00% | 30.00% | 30.00% | 30.00% | |
| Other | 0 | 0 | 0 | 0 | 0 | 0 | 0 | 0 | 0 | 0 | 0 | 0 | |
| Pro Forma Profit and Loss | |||||||||||||
| Jan | Feb | Mar | Apr | May | Jun | Jul | Aug | Sep | Oct | Nov | Dec | ||
| Sales | $42,000 | $43,000 | $71,000 | $78,000 | $85,000 | $97,000 | $114,000 | $135,000 | $142,000 | $123,000 | $120,000 | $126,000 | |
| Direct Cost of Sales | $21,100 | $21,600 | $35,600 | $38,800 | $41,500 | $48,500 | $57,500 | $68,000 | $71,000 | $61,500 | $61,000 | $63,500 | |
| Other Production Expenses | $0 | $0 | $0 | $0 | $0 | $0 | $0 | $0 | $0 | $0 | $0 | $0 | |
| Total Cost of Sales | $21,100 | $21,600 | $35,600 | $38,800 | $41,500 | $48,500 | $57,500 | $68,000 | $71,000 | $61,500 | $61,000 | $63,500 | |
| Gross Margin | $20,900 | $21,400 | $35,400 | $39,200 | $43,500 | $48,500 | $56,500 | $67,000 | $71,000 | $61,500 | $59,000 | $62,500 | |
| Gross Margin % | 49.76% | 49.77% | 49.86% | 50.26% | 51.18% | 50.00% | 49.56% | 49.63% | 50.00% | 50.00% | 49.17% | 49.60% | |
| Expenses | |||||||||||||
| Payroll | $21,800 | $21,800 | $21,800 | $25,550 | $31,800 | $31,800 | $31,800 | $31,800 | $31,800 | $31,800 | $31,800 | $31,800 | |
| Sales and Marketing and Other Expenses | $2,000 | $2,000 | $2,000 | $2,000 | $2,000 | $2,000 | $2,000 | $2,000 | $2,000 | $2,000 | $2,000 | $2,000 | |
| Depreciation | $800 | $800 | $800 | $800 | $800 | $800 | $800 | $800 | $800 | $800 | $800 | $800 | |
| Renovation Expenses | $60,000 | $40,000 | $20,000 | $30,000 | $0 | $0 | $0 | $0 | $0 | $0 | $0 | $0 | |
| Utilities | $500 | $500 | $500 | $500 | $500 | $500 | $500 | $500 | $500 | $500 | $500 | $500 | |
| Insurance | $0 | $0 | $0 | $0 | $0 | $0 | $0 | $0 | $0 | $0 | $0 | $0 | |
| Rent | $3,000 | $3,000 | $3,000 | $3,000 | $3,000 | $3,000 | $3,000 | $3,000 | $3,000 | $3,000 | $3,000 | $3,000 | |
| Payroll Taxes | 15% | $0 | $0 | $0 | $0 | $0 | $0 | $0 | $0 | $0 | $0 | $0 | $0 |
| Other | $0 | $0 | $0 | $0 | $0 | $0 | $0 | $0 | $0 | $0 | $0 | $0 | |
| Total Operating Expenses | $88,100 | $68,100 | $48,100 | $61,850 | $38,100 | $38,100 | $38,100 | $38,100 | $38,100 | $38,100 | $38,100 | $38,100 | |
| Profit Before Interest and Taxes | ($67,200) | ($46,700) | ($12,700) | ($22,650) | $5,400 | $10,400 | $18,400 | $28,900 | $32,900 | $23,400 | $20,900 | $24,400 | |
| EBITDA | ($66,400) | ($45,900) | ($11,900) | ($21,850) | $6,200 | $11,200 | $19,200 | $29,700 | $33,700 | $24,200 | $21,700 | $25,200 | |
| Interest Expense | $983 | $966 | $949 | $932 | $915 | $898 | $881 | $864 | $847 | $830 | $813 | $796 | |
| Taxes Incurred | ($20,455) | ($14,300) | ($4,095) | ($7,075) | $1,345 | $2,851 | $5,256 | $8,411 | $9,616 | $6,771 | $6,026 | $7,081 | |
| Net Profit | ($47,728) | ($33,366) | ($9,554) | ($16,507) | $3,139 | $6,651 | $12,263 | $19,625 | $22,437 | $15,799 | $14,061 | $16,523 | |
| Net Profit/Sales | -113.64% | -77.60% | -13.46% | -21.16% | 3.69% | 6.86% | 10.76% | 14.54% | 15.80% | 12.84% | 11.72% | 13.11% | |
| Pro Forma Cash Flow | |||||||||||||
| Jan | Feb | Mar | Apr | May | Jun | Jul | Aug | Sep | Oct | Nov | Dec | ||
| Cash Received | |||||||||||||
| Cash from Operations | |||||||||||||
| Cash Sales | $25,200 | $25,800 | $42,600 | $46,800 | $51,000 | $58,200 | $68,400 | $81,000 | $85,200 | $73,800 | $72,000 | $75,600 | |
| Cash from Receivables | $11,843 | $12,403 | $16,813 | $17,573 | $28,493 | $31,293 | $34,160 | $39,027 | $45,880 | $54,093 | $56,547 | $49,160 | |
| Subtotal Cash from Operations | $37,043 | $38,203 | $59,413 | $64,373 | $79,493 | $89,493 | $102,560 | $120,027 | $131,080 | $127,893 | $128,547 | $124,760 | |
| Additional Cash Received | |||||||||||||
| Sales Tax, VAT, HST/GST Received | 0.00% | $0 | $0 | $0 | $0 | $0 | $0 | $0 | $0 | $0 | $0 | $0 | $0 |
| New Current Borrowing | $100,000 | $0 | $0 | $0 | $0 | $0 | $0 | $0 | $0 | $0 | $0 | $0 | |
| New Other Liabilities (interest-free) | $0 | $0 | $0 | $0 | $0 | $0 | $0 | $0 | $0 | $0 | $0 | $0 | |
| New Long-term Liabilities | $0 | $0 | $0 | $0 | $0 | $0 | $0 | $0 | $0 | $0 | $0 | $0 | |
| Sales of Other Current Assets | $0 | $0 | $0 | $0 | $0 | $0 | $0 | $0 | $0 | $0 | $0 | $0 | |
| Sales of Long-term Assets | $0 | $0 | $0 | $0 | $0 | $0 | $0 | $0 | $0 | $0 | $0 | $0 | |
| New Investment Received | $50,000 | $0 | $0 | $0 | $0 | $0 | $0 | $0 | $0 | $0 | $0 | $0 | |
| Subtotal Cash Received | $187,043 | $38,203 | $59,413 | $64,373 | $79,493 | $89,493 | $102,560 | $120,027 | $131,080 | $127,893 | $128,547 | $124,760 | |
| Expenditures | Jan | Feb | Mar | Apr | May | Jun | Jul | Aug | Sep | Oct | Nov | Dec | |
| Expenditures from Operations | |||||||||||||
| Cash Spending | $21,800 | $21,800 | $21,800 | $25,550 | $31,800 | $31,800 | $31,800 | $31,800 | $31,800 | $31,800 | $31,800 | $31,800 | |
| Bill Payments | $22,010 | $60,089 | $54,951 | $73,298 | $71,029 | $52,671 | $65,902 | $79,546 | $94,189 | $89,393 | $64,439 | $73,017 | |
| Subtotal Spent on Operations | $43,810 | $81,889 | $76,751 | $98,848 | $102,829 | $84,471 | $97,702 | $111,346 | $125,989 | $121,193 | $96,239 | $104,817 | |
| Additional Cash Spent | |||||||||||||
| Sales Tax, VAT, HST/GST Paid Out | $0 | $0 | $0 | $0 | $0 | $0 | $0 | $0 | $0 | $0 | $0 | $0 | |
| Principal Repayment of Current Borrowing | $1,800 | $1,800 | $1,800 | $1,800 | $1,800 | $1,800 | $1,800 | $1,800 | $1,800 | $1,800 | $1,800 | $1,800 | |
| Other Liabilities Principal Repayment | $0 | $0 | $0 | $0 | $0 | $0 | $0 | $0 | $0 | $0 | $0 | $0 | |
| Long-term Liabilities Principal Repayment | $238 | $238 | $238 | $238 | $238 | $238 | $238 | $238 | $238 | $238 | $240 | $240 | |
| Purchase Other Current Assets | $0 | $0 | $0 | $0 | $0 | $0 | $0 | $0 | $0 | $0 | $0 | $0 | |
| Purchase Long-term Assets | $0 | $0 | $0 | $0 | $0 | $0 | $0 | $0 | $0 | $0 | $0 | $0 | |
| Dividends | $0 | $0 | $0 | $0 | $0 | $0 | $0 | $0 | $0 | $0 | $0 | $0 | |
| Subtotal Cash Spent | $45,848 | $83,927 | $78,789 | $100,886 | $104,867 | $86,509 | $99,740 | $113,384 | $128,027 | $123,231 | $98,279 | $106,857 | |
| Net Cash Flow | $141,195 | ($45,724) | ($19,375) | ($36,513) | ($25,374) | $2,984 | $2,820 | $6,642 | $3,053 | $4,663 | $30,268 | $17,903 | |
| Cash Balance | $191,195 | $145,471 | $126,096 | $89,583 | $64,209 | $67,193 | $70,013 | $76,656 | $79,708 | $84,371 | $114,639 | $132,541 | |
| Pro Forma Balance Sheet | |||||||||||||
| Jan | Feb | Mar | Apr | May | Jun | Jul | Aug | Sep | Oct | Nov | Dec | ||
| Assets | Starting Balances | ||||||||||||
| Current Assets | |||||||||||||
| Cash | $50,000 | $191,195 | $145,471 | $126,096 | $89,583 | $64,209 | $67,193 | $70,013 | $76,656 | $79,708 | $84,371 | $114,639 | $132,541 |
| Accounts Receivable | $23,686 | $28,643 | $33,440 | $45,027 | $58,653 | $64,160 | $71,667 | $83,107 | $98,080 | $109,000 | $104,107 | $95,560 | $96,800 |
| Inventory | $30,050 | $23,210 | $23,760 | $39,160 | $42,680 | $45,650 | $53,350 | $63,250 | $74,800 | $78,100 | $67,650 | $67,100 | $69,850 |
| Other Current Assets | $50,000 | $50,000 | $50,000 | $50,000 | $50,000 | $50,000 | $50,000 | $50,000 | $50,000 | $50,000 | $50,000 | $50,000 | $50,000 |
| Total Current Assets | $153,736 | $293,048 | $252,671 | $260,283 | $240,916 | $224,019 | $242,210 | $266,370 | $299,536 | $316,808 | $306,128 | $327,299 | $349,191 |
| Long-term Assets | |||||||||||||
| Long-term Assets | $80,000 | $80,000 | $80,000 | $80,000 | $80,000 | $80,000 | $80,000 | $80,000 | $80,000 | $80,000 | $80,000 | $80,000 | $80,000 |
| Accumulated Depreciation | $15,000 | $15,800 | $16,600 | $17,400 | $18,200 | $19,000 | $19,800 | $20,600 | $21,400 | $22,200 | $23,000 | $23,800 | $24,600 |
| Total Long-term Assets | $65,000 | $64,200 | $63,400 | $62,600 | $61,800 | $61,000 | $60,200 | $59,400 | $58,600 | $57,800 | $57,000 | $56,200 | $55,400 |
| Total Assets | $218,736 | $357,248 | $316,071 | $322,883 | $302,716 | $285,019 | $302,410 | $325,770 | $358,136 | $374,608 | $363,128 | $383,499 | $404,591 |
| Liabilities and Capital | Jan | Feb | Mar | Apr | May | Jun | Jul | Aug | Sep | Oct | Nov | Dec | |
| Current Liabilities | |||||||||||||
| Accounts Payable | $20,000 | $58,279 | $52,506 | $70,909 | $69,288 | $50,490 | $63,267 | $76,402 | $91,181 | $87,254 | $62,013 | $70,363 | $76,973 |
| Current Borrowing | $0 | $98,200 | $96,400 | $94,600 | $92,800 | $91,000 | $89,200 | $87,400 | $85,600 | $83,800 | $82,000 | $80,200 | $78,400 |
| Other Current Liabilities | $0 | $0 | $0 | $0 | $0 | $0 | $0 | $0 | $0 | $0 | $0 | $0 | $0 |
| Subtotal Current Liabilities | $20,000 | $156,479 | $148,906 | $165,509 | $162,088 | $141,490 | $152,467 | $163,802 | $176,781 | $171,054 | $144,013 | $150,563 | $155,373 |
| Long-term Liabilities | $20,000 | $19,762 | $19,524 | $19,286 | $19,048 | $18,810 | $18,572 | $18,334 | $18,096 | $17,858 | $17,620 | $17,380 | $17,140 |
| Total Liabilities | $40,000 | $176,241 | $168,430 | $184,795 | $181,136 | $160,300 | $171,039 | $182,136 | $194,877 | $188,912 | $161,633 | $167,943 | $172,513 |
| Paid-in Capital | $0 | $50,000 | $50,000 | $50,000 | $50,000 | $50,000 | $50,000 | $50,000 | $50,000 | $50,000 | $50,000 | $50,000 | $50,000 |
| Retained Earnings | ($37,964) | $178,736 | $178,736 | $178,736 | $178,736 | $178,736 | $178,736 | $178,736 | $178,736 | $178,736 | $178,736 | $178,736 | $178,736 |
| Earnings | $216,700 | ($47,728) | ($81,094) | ($90,649) | ($107,156) | ($104,017) | ($97,365) | ($85,102) | ($65,477) | ($43,040) | ($27,241) | ($13,180) | $3,342 |
| Total Capital | $178,736 | $181,008 | $147,642 | $138,087 | $121,580 | $124,719 | $131,371 | $143,634 | $163,259 | $185,696 | $201,495 | $215,556 | $232,078 |
| Total Liabilities and Capital | $218,736 | $357,248 | $316,071 | $322,883 | $302,716 | $285,019 | $302,410 | $325,770 | $358,136 | $374,608 | $363,128 | $383,499 | $404,591 |
| Net Worth | $178,736 | $181,008 | $147,642 | $138,087 | $121,580 | $124,719 | $131,371 | $143,634 | $163,259 | $185,696 | $201,495 | $215,556 | $232,078 |


