
Southwest Veterinary Clinic
Executive Summary
The Southwest Veterinary Clinic will be located in southwest Richmond. The clinic will offer a full range of medical services to the area’s pet owners. Southwest Richmond is a mixture of industrial and residential property. There are approximately 20,000 moderate-income residents in the area. Many of these residents are elderly with multiple pets.
Currently, the three closest veterinary clinics are a fifteen minute drive for most southwest Richmond residents. Southwest Veterinary Clinic will be a five minute drive from most locations in southwest Richmond.
Edward Anderson, DVM, and Michelle Johnson, DVD, have seven years of veterinary experience. Edward has four years of experience with the Richmond Emergency Veterinary Hospital. Michelle has been a staff veterinarian at Blue Cross Hospital for three years.
Both Richmond Emergency and Blue Cross Hospitals serve residents in southwest Richmond. Edward and Michelle have treated numerous pets from the southwest section of town over the years. Most of these customers praised the service they received. Thirty customers have already confirmed that they will be using the new hospital services.
1.1 Mission
Our goal is to help customers’ pets live long, happy and healthy lives. We believe that a key element to a healthy pet is a great relationship with your veterinarian. Everyone at Southwest Veterinary Clinic is committed to professional, caring, personalized service. Southwest Veterinary Clinic takes pride in our dedication to the highest standards in veterinary medicine. We have a full service clinic offering state-of-the-art veterinary medical technology.
1.2 Keys to Success
- We treat our patients as if they were our own pets and try to offer customers the service that they desire and deserve.
- We take an individualized approach to the long-term care of each of our patients and are dedicated to providing our clients with enough information to make appropriate decisions concerning the health care of their animal companions.
Company Summary
The Southwest Veterinary Clinic will be located in southwest Richmond. The clinic will offer its customers the full range of medical services to the area’s pet owners.
2.1 Company Ownership
Edward Anderson, DVM, and Michelle Johnson, DVD, are co-owners of Southwest Veterinary Clinic.
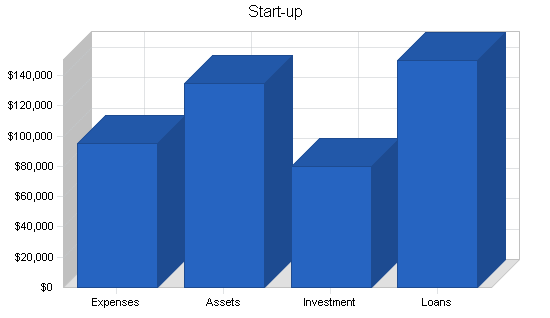
2.2 Start-up Summary
Southwest Veterinary Clinic’s start-up costs consist of medical, surgical, and lab equipment. In addition, there will a $30,000 interior remodeling cost for the clinic. Edward Anderson and Michelle Johnson will invest $80,000. In addition, they will secure a $70,000 SBA loan.
| Start-up | |
| Requirements | |
| Start-up Expenses | |
| Legal | $2,000 |
| Stationery etc. | $1,000 |
| Medical/Surgical Equipment | $40,000 |
| Lab Equipment | $30,000 |
| Insurance | $2,000 |
| Rent | $3,000 |
| Clerical/Bookkeeping Setup | $2,000 |
| Kennel Equipment | $5,000 |
| Waiting Room/Examination Rooms Setup | $10,000 |
| Total Start-up Expenses | $95,000 |
| Start-up Assets | |
| Cash Required | $25,000 |
| Other Current Assets | $0 |
| Long-term Assets | $110,000 |
| Total Assets | $135,000 |
| Total Requirements | $230,000 |
| Start-up Funding | |
| Start-up Expenses to Fund | $95,000 |
| Start-up Assets to Fund | $135,000 |
| Total Funding Required | $230,000 |
| Assets | |
| Non-cash Assets from Start-up | $110,000 |
| Cash Requirements from Start-up | $25,000 |
| Additional Cash Raised | $0 |
| Cash Balance on Starting Date | $25,000 |
| Total Assets | $135,000 |
| Liabilities and Capital | |
| Liabilities | |
| Current Borrowing | $0 |
| Long-term Liabilities | $150,000 |
| Accounts Payable (Outstanding Bills) | $0 |
| Other Current Liabilities (interest-free) | $0 |
| Total Liabilities | $150,000 |
| Capital | |
| Planned Investment | |
| Michelle Johnson | $40,000 |
| Edward Anderson | $40,000 |
| Additional Investment Requirement | $0 |
| Total Planned Investment | $80,000 |
| Loss at Start-up (Start-up Expenses) | ($95,000) |
| Total Capital | ($15,000) |
| Total Capital and Liabilities | $135,000 |
| Total Funding | $230,000 |
2.3 Company Locations and Facilities
Southwest Veterinary Clinic will be located on the corner of 7th and Stewart, two of the busiest streets in southwest Richmond.
Products and Services
Southwest Veterinary Clinic will offer the following services:
- Internal medicine and surgery;
- Orthopedics;
- Dental care;
- Skin disorders;
- Geriatric care;
- Endoscopy;
- Reproductive services.
Market Analysis Summary
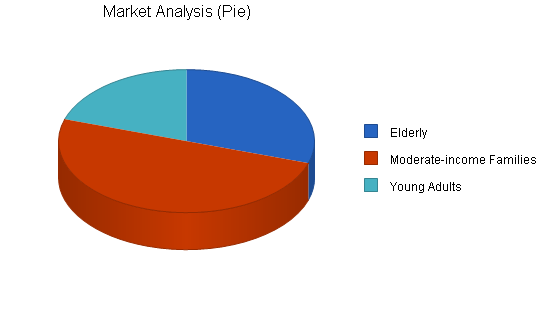
Southwest Richmond is a section of the city that, in recent years, has become primarily industrial. There are approximately 20,000 residents in the area who are currently underserved in a number of basic services. The area’s residents can be put into three groups:
- Elderly;
- Moderate-income families;
- Young single adults.
All three groups own pets but find it difficult to find local veterinary resources when needed. Southwest Veterinary Clinic will fill the community’s need for reasonably priced local veterinary services.
4.1 Market Segmentation
Southwest Veterinary Clinic will focus on three significant customer groups:
- Elderly: This group is the first tier of customers that are pivotal to the success of the clinic. They are the most proactive to the health of their pets and demand a strong relationship with their pet’s veterinarian. In return, they will become loyal customers who will refer both friends and neighbors.
- Moderate-income Families: The second tier of critical customers are the area’s families. This group is important for the sustained growth of the clinic. A veterinary service relationship with a family can last 10-20 years over which time the family can own numerous pets.
- Young, Single Adults: This group represents the third tier of customers that the clinic will focus on. This group is primarily reactive to the health of their pets and will usually only visit the clinic for emergencies, reproduction services, and shots. This is still a significant source of customers from the community.
| Market Analysis | |||||||
| Year 1 | Year 2 | Year 3 | Year 4 | Year 5 | |||
| Potential Customers | Growth | CAGR | |||||
| Elderly | 5% | 6,000 | 6,300 | 6,615 | 6,946 | 7,293 | 5.00% |
| Moderate-income Families | 10% | 10,000 | 11,000 | 12,100 | 13,310 | 14,641 | 10.00% |
| Young Adults | 10% | 4,000 | 4,400 | 4,840 | 5,324 | 5,856 | 10.00% |
| Total | 8.57% | 20,000 | 21,700 | 23,555 | 25,580 | 27,790 | 8.57% |
Strategy and Implementation Summary
The key to the clinic’s success is its visibility in the community. The location is crucial. Southwest Veterinary Clinic will be located on the corner of 7th and Stewart, two of the busiest streets in southwest Richmond. The clinic will be visible in the community. The name “Southwest” will communicate that the clinic is local to residents who are scanning the phone book for veterinary services.
Edward Anderson and Michelle Johnson will meet with both the three Southwest Seniors Organizations and the five Southwest Neighborhood Associations to introduce the veterinary hospital to the community. At these meetings, Edward and Michelle, will distribute invitations to the clinic’s grand opening.
In addition, Southwest Veterinary Clinic will reward customers who refer friends and neighbors to the clinic with 15% off their pet’s next visit.
5.1 Competitive Edge
The competitive edge of Southwest Veterinary Clinic is:
- Location: Southwest Veterinary Clinic is located on the corner of 7th and Steward. The traffic on those two streets is very strong. The closest veterinary clinic to the Southwest area is a fifteen minute drive.
- Southwest Area Focus: Currently there are no southwest-focused veterinary clinics in the area. Southwest Veterinary Clinic will the only one in the area.
5.2 Sales Strategy
The Southwest Veterinary Clinic’s sales strategy will be to grow the clinic through referrals. These referrals from satisfied customers will be the most important component to the success of Southwest Veterinary Clinic. To promote referrals from existing customers, Southwest Veterinary Clinic will offer 15% off the next visit for referrals.
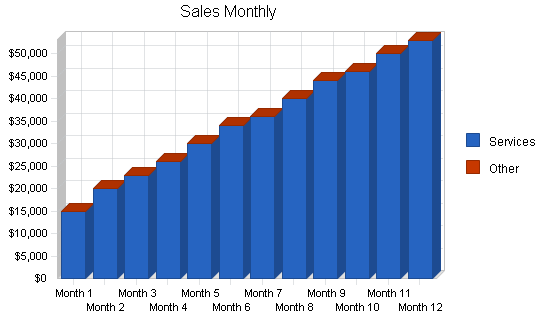
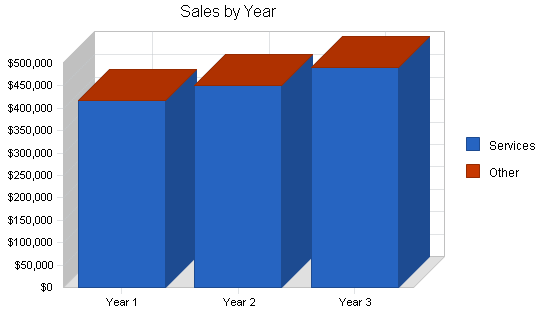
5.2.1 Sales Forecast
The following is the sales forecast for three years.
| Sales Forecast | |||
| Year 1 | Year 2 | Year 3 | |
| Sales | |||
| Services | $417,000 | $450,000 | $490,000 |
| Other | $0 | $0 | $0 |
| Total Sales | $417,000 | $450,000 | $490,000 |
| Direct Cost of Sales | Year 1 | Year 2 | Year 3 |
| Services | $98,700 | $110,000 | $120,000 |
| Other | $0 | $0 | $0 |
| Subtotal Direct Cost of Sales | $98,700 | $110,000 | $120,000 |
Management Summary
Edward Anderson and Michelle Johnson will co-manage the clinics daily operation.
6.1 Personnel Plan
The Southwest Veterinary Clinic will have a staff of three.
- Receptionist;
- Veterinary assistants (2).
| Personnel Plan | |||
| Year 1 | Year 2 | Year 3 | |
| Edward Anderson | $45,600 | $50,000 | $55,000 |
| Michelle Johnson | $45,600 | $50,000 | $55,000 |
| Receptionist/Clerical | $24,000 | $30,000 | $33,000 |
| Veterinary Assistants (2) | $52,800 | $53,000 | $55,000 |
| Total People | 5 | 5 | 5 |
| Total Payroll | $168,000 | $183,000 | $198,000 |
Brought to you by
Create a professional business plan
Using AI and step-by-step instructions
Create Your PlanSecure funding
Validate ideas
Build a strategy
Financial Plan
The following is the financial plan for Southwest Veterinary Clinic.
7.1 Break-even Analysis
The monthly break-even point is $30,000.

| Break-even Analysis | |
| Monthly Revenue Break-even | $28,351 |
| Assumptions: | |
| Average Percent Variable Cost | 24% |
| Estimated Monthly Fixed Cost | $21,641 |
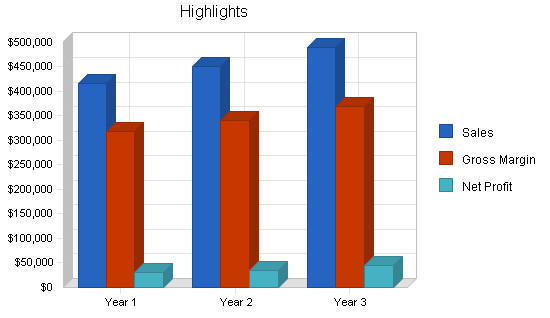
7.2 Projected Profit and Loss
The following is the projected profit and loss for three years.


| Pro Forma Profit and Loss | |||
| Year 1 | Year 2 | Year 3 | |
| Sales | $417,000 | $450,000 | $490,000 |
| Direct Cost of Sales | $98,700 | $110,000 | $120,000 |
| Other Production Expenses | $0 | $0 | $0 |
| Total Cost of Sales | $98,700 | $110,000 | $120,000 |
| Gross Margin | $318,300 | $340,000 | $370,000 |
| Gross Margin % | 76.33% | 75.56% | 75.51% |
| Expenses | |||
| Payroll | $168,000 | $183,000 | $198,000 |
| Sales and Marketing and Other Expenses | $6,000 | $6,000 | $6,000 |
| Depreciation | $11,424 | $11,424 | $11,424 |
| Leased Equipment | $0 | $0 | $0 |
| Utilities | $3,600 | $3,600 | $3,600 |
| Insurance | $7,200 | $7,200 | $7,200 |
| Rent | $36,000 | $36,000 | $36,000 |
| Payroll Taxes | $27,465 | $30,300 | $32,400 |
| Other | $0 | $0 | $0 |
| Total Operating Expenses | $259,689 | $277,524 | $294,624 |
| Profit Before Interest and Taxes | $58,611 | $62,476 | $75,376 |
| EBITDA | $70,035 | $73,900 | $86,800 |
| Interest Expense | $14,242 | $12,901 | $11,502 |
| Taxes Incurred | $13,311 | $14,872 | $19,162 |
| Net Profit | $31,058 | $34,702 | $44,712 |
| Net Profit/Sales | 7.45% | 7.71% | 9.12% |
7.3 Projected Cash Flow
The following is the projected cash flow for three years.

| Pro Forma Cash Flow | |||
| Year 1 | Year 2 | Year 3 | |
| Cash Received | |||
| Cash from Operations | |||
| Cash Sales | $417,000 | $450,000 | $490,000 |
| Subtotal Cash from Operations | $417,000 | $450,000 | $490,000 |
| Additional Cash Received | |||
| Sales Tax, VAT, HST/GST Received | $0 | $0 | $0 |
| New Current Borrowing | $0 | $0 | $0 |
| New Other Liabilities (interest-free) | $0 | $0 | $0 |
| New Long-term Liabilities | $0 | $0 | $0 |
| Sales of Other Current Assets | $0 | $0 | $0 |
| Sales of Long-term Assets | $0 | $0 | $0 |
| New Investment Received | $0 | $0 | $0 |
| Subtotal Cash Received | $417,000 | $450,000 | $490,000 |
| Expenditures | Year 1 | Year 2 | Year 3 |
| Expenditures from Operations | |||
| Cash Spending | $168,000 | $183,000 | $198,000 |
| Bill Payments | $181,390 | $227,847 | $234,632 |
| Subtotal Spent on Operations | $349,390 | $410,847 | $432,632 |
| Additional Cash Spent | |||
| Sales Tax, VAT, HST/GST Paid Out | $0 | $0 | $0 |
| Principal Repayment of Current Borrowing | $0 | $0 | $0 |
| Other Liabilities Principal Repayment | $0 | $0 | $0 |
| Long-term Liabilities Principal Repayment | $13,992 | $13,992 | $13,992 |
| Purchase Other Current Assets | $0 | $0 | $0 |
| Purchase Long-term Assets | $0 | $0 | $0 |
| Dividends | $0 | $0 | $0 |
| Subtotal Cash Spent | $363,382 | $424,839 | $446,624 |
| Net Cash Flow | $53,618 | $25,161 | $43,376 |
| Cash Balance | $78,618 | $103,779 | $147,154 |
7.4 Projected Balance Sheet
The following is the projected balance sheet for three years.
| Pro Forma Balance Sheet | |||
| Year 1 | Year 2 | Year 3 | |
| Assets | |||
| Current Assets | |||
| Cash | $78,618 | $103,779 | $147,154 |
| Other Current Assets | $0 | $0 | $0 |
| Total Current Assets | $78,618 | $103,779 | $147,154 |
| Long-term Assets | |||
| Long-term Assets | $110,000 | $110,000 | $110,000 |
| Accumulated Depreciation | $11,424 | $22,848 | $34,272 |
| Total Long-term Assets | $98,576 | $87,152 | $75,728 |
| Total Assets | $177,194 | $190,931 | $222,882 |
| Liabilities and Capital | Year 1 | Year 2 | Year 3 |
| Current Liabilities | |||
| Accounts Payable | $25,128 | $18,154 | $19,386 |
| Current Borrowing | $0 | $0 | $0 |
| Other Current Liabilities | $0 | $0 | $0 |
| Subtotal Current Liabilities | $25,128 | $18,154 | $19,386 |
| Long-term Liabilities | $136,008 | $122,016 | $108,024 |
| Total Liabilities | $161,136 | $140,170 | $127,410 |
| Paid-in Capital | $80,000 | $80,000 | $80,000 |
| Retained Earnings | ($95,000) | ($63,942) | ($29,239) |
| Earnings | $31,058 | $34,702 | $44,712 |
| Total Capital | $16,058 | $50,761 | $95,472 |
| Total Liabilities and Capital | $177,194 | $190,931 | $222,882 |
| Net Worth | $16,058 | $50,761 | $95,472 |
7.5 Business Ratios
Business ratios for the years of this plan are shown below. Industry profile ratios based on the Standard Industrial Classification (SIC) code 0742, Veterinary Services, are shown for comparison.
| Ratio Analysis | ||||
| Year 1 | Year 2 | Year 3 | Industry Profile | |
| Sales Growth | 0.00% | 7.91% | 8.89% | -2.90% |
| Percent of Total Assets | ||||
| Other Current Assets | 0.00% | 0.00% | 0.00% | 32.60% |
| Total Current Assets | 44.37% | 54.35% | 66.02% | 59.90% |
| Long-term Assets | 55.63% | 45.65% | 33.98% | 40.10% |
| Total Assets | 100.00% | 100.00% | 100.00% | 100.00% |
| Current Liabilities | 14.18% | 9.51% | 8.70% | 31.10% |
| Long-term Liabilities | 76.76% | 63.91% | 48.47% | 21.50% |
| Total Liabilities | 90.94% | 73.41% | 57.16% | 52.60% |
| Net Worth | 9.06% | 26.59% | 42.84% | 47.40% |
| Percent of Sales | ||||
| Sales | 100.00% | 100.00% | 100.00% | 100.00% |
| Gross Margin | 76.33% | 75.56% | 75.51% | 40.00% |
| Selling, General & Administrative Expenses | 71.42% | 70.80% | 68.96% | 23.70% |
| Advertising Expenses | 1.44% | 1.33% | 1.22% | 0.50% |
| Profit Before Interest and Taxes | 14.06% | 13.88% | 15.38% | 3.60% |
| Main Ratios | ||||
| Current | 3.13 | 5.72 | 7.59 | 1.95 |
| Quick | 3.13 | 5.72 | 7.59 | 1.26 |
| Total Debt to Total Assets | 90.94% | 73.41% | 57.16% | 52.60% |
| Pre-tax Return on Net Worth | 276.30% | 97.66% | 66.90% | 5.50% |
| Pre-tax Return on Assets | 25.04% | 25.96% | 28.66% | 11.60% |
| Additional Ratios | Year 1 | Year 2 | Year 3 | |
| Net Profit Margin | 7.45% | 7.71% | 9.12% | n.a |
| Return on Equity | 193.41% | 68.36% | 46.83% | n.a |
| Activity Ratios | ||||
| Accounts Payable Turnover | 8.22 | 12.17 | 12.17 | n.a |
| Payment Days | 27 | 36 | 29 | n.a |
| Total Asset Turnover | 2.35 | 2.36 | 2.20 | n.a |
| Debt Ratios | ||||
| Debt to Net Worth | 10.03 | 2.76 | 1.33 | n.a |
| Current Liab. to Liab. | 0.16 | 0.13 | 0.15 | n.a |
| Liquidity Ratios | ||||
| Net Working Capital | $53,490 | $85,625 | $127,768 | n.a |
| Interest Coverage | 4.12 | 4.84 | 6.55 | n.a |
| Additional Ratios | ||||
| Assets to Sales | 0.42 | 0.42 | 0.45 | n.a |
| Current Debt/Total Assets | 14% | 10% | 9% | n.a |
| Acid Test | 3.13 | 5.72 | 7.59 | n.a |
| Sales/Net Worth | 25.97 | 8.87 | 5.13 | n.a |
| Dividend Payout | 0.00 | 0.00 | 0.00 | n.a |
Appendix
| Sales Forecast | |||||||||||||
| Month 1 | Month 2 | Month 3 | Month 4 | Month 5 | Month 6 | Month 7 | Month 8 | Month 9 | Month 10 | Month 11 | Month 12 | ||
| Sales | |||||||||||||
| Services | 0% | $15,000 | $20,000 | $23,000 | $26,000 | $30,000 | $34,000 | $36,000 | $40,000 | $44,000 | $46,000 | $50,000 | $53,000 |
| Other | 0% | $0 | $0 | $0 | $0 | $0 | $0 | $0 | $0 | $0 | $0 | $0 | $0 |
| Total Sales | $15,000 | $20,000 | $23,000 | $26,000 | $30,000 | $34,000 | $36,000 | $40,000 | $44,000 | $46,000 | $50,000 | $53,000 | |
| Direct Cost of Sales | Month 1 | Month 2 | Month 3 | Month 4 | Month 5 | Month 6 | Month 7 | Month 8 | Month 9 | Month 10 | Month 11 | Month 12 | |
| Services | $4,000 | $5,000 | $5,300 | $6,000 | $7,000 | $8,000 | $8,400 | $9,000 | $10,000 | $11,000 | $12,000 | $13,000 | |
| Other | $0 | $0 | $0 | $0 | $0 | $0 | $0 | $0 | $0 | $0 | $0 | $0 | |
| Subtotal Direct Cost of Sales | $4,000 | $5,000 | $5,300 | $6,000 | $7,000 | $8,000 | $8,400 | $9,000 | $10,000 | $11,000 | $12,000 | $13,000 | |
| Personnel Plan | |||||||||||||
| Month 1 | Month 2 | Month 3 | Month 4 | Month 5 | Month 6 | Month 7 | Month 8 | Month 9 | Month 10 | Month 11 | Month 12 | ||
| Edward Anderson | 0% | $3,800 | $3,800 | $3,800 | $3,800 | $3,800 | $3,800 | $3,800 | $3,800 | $3,800 | $3,800 | $3,800 | $3,800 |
| Michelle Johnson | 0% | $3,800 | $3,800 | $3,800 | $3,800 | $3,800 | $3,800 | $3,800 | $3,800 | $3,800 | $3,800 | $3,800 | $3,800 |
| Receptionist/Clerical | 0% | $2,000 | $2,000 | $2,000 | $2,000 | $2,000 | $2,000 | $2,000 | $2,000 | $2,000 | $2,000 | $2,000 | $2,000 |
| Veterinary Assistants (2) | 0% | $4,400 | $4,400 | $4,400 | $4,400 | $4,400 | $4,400 | $4,400 | $4,400 | $4,400 | $4,400 | $4,400 | $4,400 |
| Total People | 5 | 5 | 5 | 5 | 5 | 5 | 5 | 5 | 5 | 5 | 5 | 5 | |
| Total Payroll | $14,000 | $14,000 | $14,000 | $14,000 | $14,000 | $14,000 | $14,000 | $14,000 | $14,000 | $14,000 | $14,000 | $14,000 | |
| General Assumptions | |||||||||||||
| Month 1 | Month 2 | Month 3 | Month 4 | Month 5 | Month 6 | Month 7 | Month 8 | Month 9 | Month 10 | Month 11 | Month 12 | ||
| Plan Month | 1 | 2 | 3 | 4 | 5 | 6 | 7 | 8 | 9 | 10 | 11 | 12 | |
| Current Interest Rate | 10.00% | 10.00% | 10.00% | 10.00% | 10.00% | 10.00% | 10.00% | 10.00% | 10.00% | 10.00% | 10.00% | 10.00% | |
| Long-term Interest Rate | 10.00% | 10.00% | 10.00% | 10.00% | 10.00% | 10.00% | 10.00% | 10.00% | 10.00% | 10.00% | 10.00% | 10.00% | |
| Tax Rate | 30.00% | 30.00% | 30.00% | 30.00% | 30.00% | 30.00% | 30.00% | 30.00% | 30.00% | 30.00% | 30.00% | 30.00% | |
| Other | 0 | 0 | 0 | 0 | 0 | 0 | 0 | 0 | 0 | 0 | 0 | 0 | |
| Pro Forma Profit and Loss | |||||||||||||
| Month 1 | Month 2 | Month 3 | Month 4 | Month 5 | Month 6 | Month 7 | Month 8 | Month 9 | Month 10 | Month 11 | Month 12 | ||
| Sales | $15,000 | $20,000 | $23,000 | $26,000 | $30,000 | $34,000 | $36,000 | $40,000 | $44,000 | $46,000 | $50,000 | $53,000 | |
| Direct Cost of Sales | $4,000 | $5,000 | $5,300 | $6,000 | $7,000 | $8,000 | $8,400 | $9,000 | $10,000 | $11,000 | $12,000 | $13,000 | |
| Other Production Expenses | $0 | $0 | $0 | $0 | $0 | $0 | $0 | $0 | $0 | $0 | $0 | $0 | |
| Total Cost of Sales | $4,000 | $5,000 | $5,300 | $6,000 | $7,000 | $8,000 | $8,400 | $9,000 | $10,000 | $11,000 | $12,000 | $13,000 | |
| Gross Margin | $11,000 | $15,000 | $17,700 | $20,000 | $23,000 | $26,000 | $27,600 | $31,000 | $34,000 | $35,000 | $38,000 | $40,000 | |
| Gross Margin % | 73.33% | 75.00% | 76.96% | 76.92% | 76.67% | 76.47% | 76.67% | 77.50% | 77.27% | 76.09% | 76.00% | 75.47% | |
| Expenses | |||||||||||||
| Payroll | $14,000 | $14,000 | $14,000 | $14,000 | $14,000 | $14,000 | $14,000 | $14,000 | $14,000 | $14,000 | $14,000 | $14,000 | |
| Sales and Marketing and Other Expenses | $500 | $500 | $500 | $500 | $500 | $500 | $500 | $500 | $500 | $500 | $500 | $500 | |
| Depreciation | $952 | $952 | $952 | $952 | $952 | $952 | $952 | $952 | $952 | $952 | $952 | $952 | |
| Leased Equipment | $0 | $0 | $0 | $0 | $0 | $0 | $0 | $0 | $0 | $0 | $0 | $0 | |
| Utilities | $300 | $300 | $300 | $300 | $300 | $300 | $300 | $300 | $300 | $300 | $300 | $300 | |
| Insurance | $600 | $600 | $600 | $600 | $600 | $600 | $600 | $600 | $600 | $600 | $600 | $600 | |
| Rent | $3,000 | $3,000 | $3,000 | $3,000 | $3,000 | $3,000 | $3,000 | $3,000 | $3,000 | $3,000 | $3,000 | $3,000 | |
| Payroll Taxes | 15% | $2,220 | $2,295 | $2,295 | $2,295 | $2,295 | $2,295 | $2,295 | $2,295 | $2,295 | $2,295 | $2,295 | $2,295 |
| Other | $0 | $0 | $0 | $0 | $0 | $0 | $0 | $0 | $0 | $0 | $0 | $0 | |
| Total Operating Expenses | $21,572 | $21,647 | $21,647 | $21,647 | $21,647 | $21,647 | $21,647 | $21,647 | $21,647 | $21,647 | $21,647 | $21,647 | |
| Profit Before Interest and Taxes | ($10,572) | ($6,647) | ($3,947) | ($1,647) | $1,353 | $4,353 | $5,953 | $9,353 | $12,353 | $13,353 | $16,353 | $18,353 | |
| EBITDA | ($9,620) | ($5,695) | ($2,995) | ($695) | $2,305 | $5,305 | $6,905 | $10,305 | $13,305 | $14,305 | $17,305 | $19,305 | |
| Interest Expense | $1,240 | $1,231 | $1,221 | $1,211 | $1,201 | $1,192 | $1,182 | $1,172 | $1,163 | $1,153 | $1,143 | $1,133 | |
| Taxes Incurred | ($3,544) | ($2,363) | ($1,550) | ($857) | $45 | $948 | $1,431 | $2,454 | $3,357 | $3,660 | $4,563 | $5,166 | |
| Net Profit | ($8,269) | ($5,514) | ($3,617) | ($2,001) | $106 | $2,213 | $3,340 | $5,727 | $7,833 | $8,540 | $10,647 | $12,054 | |
| Net Profit/Sales | -55.12% | -27.57% | -15.73% | -7.69% | 0.35% | 6.51% | 9.28% | 14.32% | 17.80% | 18.57% | 21.29% | 22.74% | |
| Pro Forma Cash Flow | |||||||||||||
| Month 1 | Month 2 | Month 3 | Month 4 | Month 5 | Month 6 | Month 7 | Month 8 | Month 9 | Month 10 | Month 11 | Month 12 | ||
| Cash Received | |||||||||||||
| Cash from Operations | |||||||||||||
| Cash Sales | $15,000 | $20,000 | $23,000 | $26,000 | $30,000 | $34,000 | $36,000 | $40,000 | $44,000 | $46,000 | $50,000 | $53,000 | |
| Subtotal Cash from Operations | $15,000 | $20,000 | $23,000 | $26,000 | $30,000 | $34,000 | $36,000 | $40,000 | $44,000 | $46,000 | $50,000 | $53,000 | |
| Additional Cash Received | |||||||||||||
| Sales Tax, VAT, HST/GST Received | 0.00% | $0 | $0 | $0 | $0 | $0 | $0 | $0 | $0 | $0 | $0 | $0 | $0 |
| New Current Borrowing | $0 | $0 | $0 | $0 | $0 | $0 | $0 | $0 | $0 | $0 | $0 | $0 | |
| New Other Liabilities (interest-free) | $0 | $0 | $0 | $0 | $0 | $0 | $0 | $0 | $0 | $0 | $0 | $0 | |
| New Long-term Liabilities | $0 | $0 | $0 | $0 | $0 | $0 | $0 | $0 | $0 | $0 | $0 | $0 | |
| Sales of Other Current Assets | $0 | $0 | $0 | $0 | $0 | $0 | $0 | $0 | $0 | $0 | $0 | $0 | |
| Sales of Long-term Assets | $0 | $0 | $0 | $0 | $0 | $0 | $0 | $0 | $0 | $0 | $0 | $0 | |
| New Investment Received | $0 | $0 | $0 | $0 | $0 | $0 | $0 | $0 | $0 | $0 | $0 | $0 | |
| Subtotal Cash Received | $15,000 | $20,000 | $23,000 | $26,000 | $30,000 | $34,000 | $36,000 | $40,000 | $44,000 | $46,000 | $50,000 | $53,000 | |
| Expenditures | Month 1 | Month 2 | Month 3 | Month 4 | Month 5 | Month 6 | Month 7 | Month 8 | Month 9 | Month 10 | Month 11 | Month 12 | |
| Expenditures from Operations | |||||||||||||
| Cash Spending | $14,000 | $14,000 | $14,000 | $14,000 | $14,000 | $14,000 | $14,000 | $14,000 | $14,000 | $14,000 | $14,000 | $14,000 | |
| Bill Payments | $277 | $8,391 | $10,599 | $11,712 | $13,112 | $15,005 | $16,864 | $17,762 | $19,385 | $21,258 | $22,571 | $24,454 | |
| Subtotal Spent on Operations | $14,277 | $22,391 | $24,599 | $25,712 | $27,112 | $29,005 | $30,864 | $31,762 | $33,385 | $35,258 | $36,571 | $38,454 | |
| Additional Cash Spent | |||||||||||||
| Sales Tax, VAT, HST/GST Paid Out | $0 | $0 | $0 | $0 | $0 | $0 | $0 | $0 | $0 | $0 | $0 | $0 | |
| Principal Repayment of Current Borrowing | $0 | $0 | $0 | $0 | $0 | $0 | $0 | $0 | $0 | $0 | $0 | $0 | |
| Other Liabilities Principal Repayment | $0 | $0 | $0 | $0 | $0 | $0 | $0 | $0 | $0 | $0 | $0 | $0 | |
| Long-term Liabilities Principal Repayment | $1,166 | $1,166 | $1,166 | $1,166 | $1,166 | $1,166 | $1,166 | $1,166 | $1,166 | $1,166 | $1,166 | $1,166 | |
| Purchase Other Current Assets | $0 | $0 | $0 | $0 | $0 | $0 | $0 | $0 | $0 | $0 | $0 | $0 | |
| Purchase Long-term Assets | $0 | $0 | $0 | $0 | $0 | $0 | $0 | $0 | $0 | $0 | $0 | $0 | |
| Dividends | $0 | $0 | $0 | $0 | $0 | $0 | $0 | $0 | $0 | $0 | $0 | $0 | |
| Subtotal Cash Spent | $15,443 | $23,557 | $25,765 | $26,878 | $28,278 | $30,171 | $32,030 | $32,928 | $34,551 | $36,424 | $37,737 | $39,620 | |
| Net Cash Flow | ($443) | ($3,557) | ($2,765) | ($878) | $1,722 | $3,829 | $3,970 | $7,072 | $9,449 | $9,576 | $12,263 | $13,380 | |
| Cash Balance | $24,557 | $20,999 | $18,234 | $17,357 | $19,079 | $22,908 | $26,878 | $33,950 | $43,399 | $52,975 | $65,238 | $78,618 | |
| Pro Forma Balance Sheet | |||||||||||||
| Month 1 | Month 2 | Month 3 | Month 4 | Month 5 | Month 6 | Month 7 | Month 8 | Month 9 | Month 10 | Month 11 | Month 12 | ||
| Assets | Starting Balances | ||||||||||||
| Current Assets | |||||||||||||
| Cash | $25,000 | $24,557 | $20,999 | $18,234 | $17,357 | $19,079 | $22,908 | $26,878 | $33,950 | $43,399 | $52,975 | $65,238 | $78,618 |
| Other Current Assets | $0 | $0 | $0 | $0 | $0 | $0 | $0 | $0 | $0 | $0 | $0 | $0 | $0 |
| Total Current Assets | $25,000 | $24,557 | $20,999 | $18,234 | $17,357 | $19,079 | $22,908 | $26,878 | $33,950 | $43,399 | $52,975 | $65,238 | $78,618 |
| Long-term Assets | |||||||||||||
| Long-term Assets | $110,000 | $110,000 | $110,000 | $110,000 | $110,000 | $110,000 | $110,000 | $110,000 | $110,000 | $110,000 | $110,000 | $110,000 | $110,000 |
| Accumulated Depreciation | $0 | $952 | $1,904 | $2,856 | $3,808 | $4,760 | $5,712 | $6,664 | $7,616 | $8,568 | $9,520 | $10,472 | $11,424 |
| Total Long-term Assets | $110,000 | $109,048 | $108,096 | $107,144 | $106,192 | $105,240 | $104,288 | $103,336 | $102,384 | $101,432 | $100,480 | $99,528 | $98,576 |
| Total Assets | $135,000 | $133,605 | $129,095 | $125,378 | $123,549 | $124,319 | $127,196 | $130,214 | $136,334 | $144,831 | $153,455 | $164,766 | $177,194 |
| Liabilities and Capital | Month 1 | Month 2 | Month 3 | Month 4 | Month 5 | Month 6 | Month 7 | Month 8 | Month 9 | Month 10 | Month 11 | Month 12 | |
| Current Liabilities | |||||||||||||
| Accounts Payable | $0 | $8,039 | $10,210 | $11,277 | $12,614 | $14,444 | $16,274 | $17,118 | $18,677 | $20,508 | $21,758 | $23,588 | $25,128 |
| Current Borrowing | $0 | $0 | $0 | $0 | $0 | $0 | $0 | $0 | $0 | $0 | $0 | $0 | $0 |
| Other Current Liabilities | $0 | $0 | $0 | $0 | $0 | $0 | $0 | $0 | $0 | $0 | $0 | $0 | $0 |
| Subtotal Current Liabilities | $0 | $8,039 | $10,210 | $11,277 | $12,614 | $14,444 | $16,274 | $17,118 | $18,677 | $20,508 | $21,758 | $23,588 | $25,128 |
| Long-term Liabilities | $150,000 | $148,834 | $147,668 | $146,502 | $145,336 | $144,170 | $143,004 | $141,838 | $140,672 | $139,506 | $138,340 | $137,174 | $136,008 |
| Total Liabilities | $150,000 | $156,873 | $157,878 | $157,779 | $157,950 | $158,614 | $159,278 | $158,956 | $159,349 | $160,014 | $160,098 | $160,762 | $161,136 |
| Paid-in Capital | $80,000 | $80,000 | $80,000 | $80,000 | $80,000 | $80,000 | $80,000 | $80,000 | $80,000 | $80,000 | $80,000 | $80,000 | $80,000 |
| Retained Earnings | ($95,000) | ($95,000) | ($95,000) | ($95,000) | ($95,000) | ($95,000) | ($95,000) | ($95,000) | ($95,000) | ($95,000) | ($95,000) | ($95,000) | ($95,000) |
| Earnings | $0 | ($8,269) | ($13,783) | ($17,400) | ($19,401) | ($19,295) | ($17,082) | ($13,742) | ($8,016) | ($183) | $8,358 | $19,005 | $31,058 |
| Total Capital | ($15,000) | ($23,269) | ($28,783) | ($32,400) | ($34,401) | ($34,295) | ($32,082) | ($28,742) | ($23,016) | ($15,183) | ($6,642) | $4,005 | $16,058 |
| Total Liabilities and Capital | $135,000 | $133,605 | $129,095 | $125,378 | $123,549 | $124,319 | $127,196 | $130,214 | $136,334 | $144,831 | $153,455 | $164,766 | $177,194 |
| Net Worth | ($15,000) | ($23,269) | ($28,783) | ($32,400) | ($34,401) | ($34,295) | ($32,082) | ($28,742) | ($23,016) | ($15,183) | ($6,642) | $4,005 | $16,058 |


