
Keith's Sporting Goods
Executive Summary
Keith’s Sporting Goods (KSG) will be in the business of selling athletic equipment to people at every fitness level, from aspiring college athletes to weekend warriors. With our knowledgeable staff we will provide an environment where everyone feels comfortable coming in and asking for training advice and discussing equipment needs.
Based in Eugene, KSG wants to be a recognized sporting goods store. An exact location has yet to be set, but owners are avidly searching for a high foot traffic location. Ideally that location would be in central Eugene where anyone can travel a short distance to find our store.
We fully expect to grow quickly. Many businesses start under the same assumption but due to work ethic, desire, job enjoyment, KSG is expecting to make a profit in the early stages of its life. Sales are forecasted to be conservative in the first month but are expected to increase by 2% each month thereafter, with a first year growth rate of 12%. This assumption appears to be accurate given the fact that the sporting goods wholesale industry is growing at an 11.5% annual rate.
Keith’s Sporting Goods will be filed as an S Corporation where owners will be protected from various forms of liability and tax shields. In the early stages of business, we will be primarily debt financed through a local bank and the Small Business Association (SBA). We have forecasted the need for 60% debt, the owner and operator will invest the rest.
Depending on the timing of financing, we expect to have the store open by January next year and to produce strong profits by the end of that same year.

1.1 Objectives
The primary objectives for the store are:
- Brand recognition. KSG will be a recognized sporting goods and fitness store in Eugene.
- To be operating at a profit by the end of the first year of business.
- Achieve a 15% growth rate in sales from years one and two, and then maintain no less than a 11.5% growth rate thereafter.
- Maintain a constant gross margin of 40%. If we are able to do this and keep costs fixed, sales will be able to grow faster than total costs.
1.2 Mission
KSG strives toward building long-term relationships with our customers and employees. Working within the community, promoting community service, and encouraging the additional education of our employees will be constantly emphasized by store management. We feel it is extremely important to give back to the community that supports our operations, while also maintaining an atmosphere where our employees have the opportunity to improve as individuals.
Company Summary
KSG intends to provide customers with the quality products they need to maximize athletic performance and accomplish their physical and mental goals. We will provide our customers with a knowledgeable staff that enjoys working in an athletic atmosphere and helping others. We will be located in Eugene where there is a high concentration of health conscious individuals and a devoted following to both high school and college athletics.
2.1 Company Ownership
With the intent to operate the store I will be considered the owner of Keith’s Sporting Goods. However, I will not be the only one with a capital investment in the company. A local investor will have equal shares in the business. The investor will receive dividends starting in year 2, until he has recouped his initial investment, at which time the owner has reserved the option of buying out his shares.
Under these circumstances, and the fact that the investment is a relatively small undertaking, KSG will be filed as an S Corporation. The ownership will be split up evenly between myself and the other investor, and the rest will be debt financed.
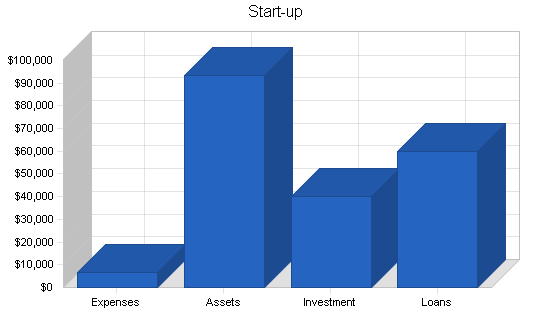
2.2 Start-up Summary
Keith’s Sporting Goods will be financed through a combination of 60% debt and 40% equity. A local bank will provide the debt while the equity will be provided by an equal combination of owner investment and an angel investor. A large portion of the initial investment will be spent on beginning inventory (83%), which we forecast to be sold within the first two months. Total assets will amount to 93.4% of the initial investment.
| Start-up | |
| Requirements | |
| Start-up Expenses | |
| Legal | $300 |
| Operating Assets | $0 |
| Brochures | $0 |
| Consultants | $0 |
| Insurance | $0 |
| Rent | $4,310 |
| Marketing/ Advertising – Grand Opening | $1,000 |
| Renovation | $1,000 |
| Other | $0 |
| Total Start-up Expenses | $6,610 |
| Start-up Assets | |
| Cash Required | $8,489 |
| Start-up Inventory | $82,901 |
| Other Current Assets | $0 |
| Long-term Assets | $2,000 |
| Total Assets | $93,390 |
| Total Requirements | $100,000 |
| Start-up Funding | |
| Start-up Expenses to Fund | $6,610 |
| Start-up Assets to Fund | $93,390 |
| Total Funding Required | $100,000 |
| Assets | |
| Non-cash Assets from Start-up | $84,901 |
| Cash Requirements from Start-up | $8,489 |
| Additional Cash Raised | $0 |
| Cash Balance on Starting Date | $8,489 |
| Total Assets | $93,390 |
| Liabilities and Capital | |
| Liabilities | |
| Current Borrowing | $0 |
| Long-term Liabilities | $60,000 |
| Accounts Payable (Outstanding Bills) | $0 |
| Other Current Liabilities (interest-free) | $0 |
| Total Liabilities | $60,000 |
| Capital | |
| Planned Investment | |
| Owner/Operator | $20,000 |
| Angel Investor | $20,000 |
| Additional Investment Requirement | $0 |
| Total Planned Investment | $40,000 |
| Loss at Start-up (Start-up Expenses) | ($6,610) |
| Total Capital | $33,390 |
| Total Capital and Liabilities | $93,390 |
| Total Funding | $100,000 |
Products
Keith’s Sporting Goods will be a high quality fitness store that focuses on athletic performance and maximization of athletic potential. In other words, KSG will be designed to supply athletes with the essential products that are necessary for active lives.
The core products we will carry are:
- Shoes
- Apparel
- Athletic equipment
To complement these goods, we will also carry training equipment like:
- Polymeric boxes
- Medicine balls
- Health supplements
- Training literature
Market Analysis Summary
The Eugene community is very active and has a great athletic heritage. It is the location of the University of Oregon, home to many running and hiking trails, and has a youth athletic center called Kidsports. Eugene also happens to be a growing community that has always supported the small entrepreneurs. Taking these factors into consideration, KSG will focus on three main groups.
- Young parents with children active in youth sports
- College students
- Active adults
These groups comprise the majority of athletes in the city, and we find them to be the ones with the disposable income to spend on athletic apparel.
4.1 Market Segmentation
- Parents (Elementary & Middle School)
- High School Athletes
- College Students
- Middle-aged Adults (35+)

| Market Analysis | |||||||
| Year 1 | Year 2 | Year 3 | Year 4 | Year 5 | |||
| Potential Customers | Growth | CAGR | |||||
| Parents | 17% | 3,150 | 3,686 | 4,313 | 5,046 | 5,904 | 17.01% |
| High School Athletes | 25% | 3,600 | 4,500 | 5,625 | 7,031 | 8,789 | 25.00% |
| College Students | 7% | 15,000 | 16,050 | 17,174 | 18,376 | 19,662 | 7.00% |
| Middle-aged Adults | 10% | 50,000 | 55,000 | 60,500 | 66,550 | 73,205 | 10.00% |
| Total | 10.65% | 71,750 | 79,236 | 87,612 | 97,003 | 107,560 | 10.65% |
4.2 Target Market Segment Strategy
Because there are so many different sports and levels at which to compete, there is a broad range of markets for the company to target. At KSG, we will provide a marketplace that satisfies the needs of each group. We will stock a variety of goods for the wide variety of our customers.
We strive to build long-term, personal relationships with our customers, in order to do this, we will need to attract customers at young ages. Therefore, our primary target market will be parents with young children. By building a trust relationship, we may be able to maintain a family right up through the child’s college years.
It will be important to target these groups because youth sports are growing at an incredible rate. Data has indicated that youth sports has the highest growth rate of any segment within the athletic industry. Capturing the market at a young age will lead to future sales when athletes spend more money on their athletic needs.
Young parents and high school students will not be the only groups that we will focus on because they also make up the smallest population. Focusing on college students and active adults will also be key.
Brought to you by
Create a professional business plan
Using AI and step-by-step instructions
Create Your PlanSecure funding
Validate ideas
Build a strategy
4.3 Competition and Buying Patterns
To an athlete who is serious about achieving particular goals, having the correct athletic equipment is integral. Somebody who runs many miles over the course of a week needs to have shoes that not only last over time, but also protect joints from over use. It is the same for a basketball player who needs to wear light clothing that allows him/her to move freely. In either case, the athlete is looking for the best equipment and is always open to try new, innovative products that might help reach peak performance.
In the sporting goods retailing many companies compete in different ways. For example, Copeland’s tries to sell products more on a cost basis using their capitol power to sell products at the lowest price. When doing this, they sacrifice the customer service and support that many athletes are looking for.
As a smaller company we intend to provide customers the support and knowledge they need to fulfill their goals.
Strategy and Implementation Summary
At KSG, we will use a marketing strategy of developing long-term relationships with our customers. Being seen at various sporting events will be an integral part of getting our name out in the community. We want to be seen as a business that cares for our customers and wants to see them accomplish all of their goals.
We want our customers to have complete trust in what our employees are saying. We want them to know all the information about what they are buying and what is best for them. If customers have a good experiences with what they purchase, not only will they more likely be repeat customers, but also they will tell friends about the quality of operations at KSG.
5.1 Competitive Edge
The number one competitive edge KSG enjoys is providing customers with unparalleled service. As a smaller operation it will be impossible to compete with Copeland’s and Play it Again sports on a price basis. Providing a group of knowledgeable employees who enjoy what they are doing is the only way that KSG can provide the best customer service. Once this trust is built our competitive advantage can be sustained.
The type of equipment that KSG will provide will also be a source of competitive edge. Much of the equipment found at Keith’s will not be found at larger chain stores. For example, it is tough to find polymeric equipment. In fact the only way one can buy high-quality equipment is through catalogs. It is the same for many types of shoes. Stores like Copeland’s tend to only sell shoes that are trendy. Trendy shoes are not a sign of high quality; they are a sign of great marketing. KSG will provide quality equipment and will be able to educate customers on why certain equipment is better than the typical mainstream brand equipment.
5.2 Sales Strategy
Our sales strategy will be built around fully educating customers about their purchases. Many of the activities that our store is promoting impacts the human body. It is important for the customer to be fully aware of the repercussions of the activity and how each piece of equipment effects him/her. With that in mind, sales people will take care of customers on a first come first serve basis. We want to build customer relationships without discriminating other potential future customers.
Employees will be paid on an hourly wage with no commissions at the beginning of operations. After the store has a history, a commission package based on sales and education advancement can be implemented.
KSG will carry a relatively low amount of inventory and have frequent order repurchases in an attempt to maintain inventory levels and storage costs. Finally, all sales will be in cash to prevent the problems brought along by late accounts receivable payments.
5.2.1 Sales Forecast
The primary products at KSG will include athletic shoes and apparel. We will also sell equipment, supplements, and health literature, but we forecast shoes and apparel to drive sales. We expect strong growth in the first year due to intense marketing and exposure in the Eugene market. Forecasted sales are expected to increase by 2% from month to month in the first year and then grow at the industry average of 11.50% per year.


| Sales Forecast | |||
| Year 1 | Year 2 | Year 3 | |
| Sales | |||
| Shoes | $193,134 | $201,245 | $209,697 |
| Apparel | $241,418 | $251,557 | $261,619 |
| Total Sales | $434,552 | $452,802 | $471,316 |
| Direct Cost of Sales | Year 1 | Year 2 | Year 3 |
| Shoes | $115,880 | $120,747 | $125,818 |
| Apparel | $144,851 | $150,934 | $156,971 |
| Subtotal Direct Cost of Sales | $260,731 | $271,681 | $282,790 |
Management Summary
The owner of KSG will also be the operator and decision maker. The philosophy behind the workforce will be one of total customer satisfaction and education. Since many customers are not aware of the many repercussions brought on by athletics, employees will be encouraged to continually gain new knowledge and insight.
6.1 Personnel Plan
Keith’s Sporting Goods will begin operations with a relatively small work crew with the intention to grow as the business grows. The owner/operator will have a base salary of $3,000/mo and that will be a fixed expense.
We plan on starting with one full time employee who will be the store manager. The manager will work closely with the owner. During slow hours, they will work closely implementing new strategies and making store changes. The manager will work 40 hours per week, and will have the weekends off. The manager’s salary, below, includes benefits (paid sick time, holidays, and insurance coverage).
The owner will work the weekend with the other employees. Aside from the owner and manager, KSG will need an estimated 51 man-hours over the course of the week. There is no estimated number of employees needed; we just need to fill the extra 51 hours. Employees will make $8/hr, and will be looked upon as an integral part of the operation.
| Personnel Plan | |||
| Year 1 | Year 2 | Year 3 | |
| Owner Operator | $36,000 | $36,000 | $40,000 |
| Manager | $43,200 | $45,000 | $46,000 |
| Employees | $22,032 | $24,000 | $25,000 |
| Total People | 5 | 6 | 6 |
| Total Payroll | $101,232 | $105,000 | $111,000 |
Financial Plan
Keith’s Sporting Goods will regularly monitor all financial statements because they have a direct correlation with the health of our business. We have forecasted into the future with a steady but moderate growth rate where sales will grow by 2% every month. All sales will be in cash leading to positive cash flows whenever asset acquisition is maintained. Profits will be reinvested into the business in hopes of future product and store expansions. If no appropriate investment opportunities present themselves excess cash will be placed into the market through a respected financial consultant.
7.1 Important Assumptions
Key assumptions:
- Growth rate of 2% per month
- Daily sales: shoes six per day @ $80 each, and apparel 24 items/day @ $25 each
- Growth will be steady throughout the year.
| General Assumptions | |||
| Year 1 | Year 2 | Year 3 | |
| Plan Month | 1 | 2 | 3 |
| Current Interest Rate | 10.00% | 10.00% | 10.00% |
| Long-term Interest Rate | 10.00% | 10.00% | 10.00% |
| Tax Rate | 25.42% | 25.00% | 25.42% |
| Other | 0 | 0 | 0 |
7.2 Break-even Analysis
The following table and chart show our break-even point.

| Break-even Analysis | |
| Monthly Revenue Break-even | $32,540 |
| Assumptions: | |
| Average Percent Variable Cost | 60% |
| Estimated Monthly Fixed Cost | $13,016 |
7.3 Projected Profit and Loss
Due to working with low overhead, we predict early profits in the life of our business. Depending on the accuracy of our forecasts, we will adjust the amounts spent on marketing and other long-term assets that will add value to our business.
Brought to you by
Create a professional business plan
Using AI and step-by-step instructions
Create Your PlanSecure funding
Validate ideas
Build a strategy


| Pro Forma Profit and Loss | |||
| Year 1 | Year 2 | Year 3 | |
| Sales | $434,552 | $452,802 | $471,316 |
| Direct Cost of Sales | $260,731 | $271,681 | $282,790 |
| Other | $0 | $0 | $0 |
| Total Cost of Sales | $260,731 | $271,681 | $282,790 |
| Gross Margin | $173,821 | $181,121 | $188,526 |
| Gross Margin % | 40.00% | 40.00% | 40.00% |
| Expenses | |||
| Payroll | $101,232 | $105,000 | $111,000 |
| Sales and Marketing and Other Expenses | $21,600 | $21,600 | $21,600 |
| Depreciation | $0 | $0 | $0 |
| Utilities | $9,600 | $9,600 | $9,600 |
| Rent | $23,760 | $23,760 | $23,760 |
| Payroll Taxes | $0 | $0 | $0 |
| Other | $0 | $0 | $0 |
| Total Operating Expenses | $156,192 | $159,960 | $165,960 |
| Profit Before Interest and Taxes | $17,629 | $21,161 | $22,566 |
| EBITDA | $17,629 | $21,161 | $22,566 |
| Interest Expense | $5,350 | $4,200 | $3,000 |
| Taxes Incurred | $3,042 | $4,240 | $4,973 |
| Net Profit | $9,236 | $12,721 | $14,593 |
| Net Profit/Sales | 2.13% | 2.81% | 3.10% |
7.4 Projected Cash Flow
As a retailer, we do not sell on credit, but all of our invetory purchases are made on account. Our net cash outflows are largely a result of repaying the initial loan.

| Pro Forma Cash Flow | |||
| Year 1 | Year 2 | Year 3 | |
| Cash Received | |||
| Cash from Operations | |||
| Cash Sales | $434,552 | $452,802 | $471,316 |
| Subtotal Cash from Operations | $434,552 | $452,802 | $471,316 |
| Additional Cash Received | |||
| Sales Tax, VAT, HST/GST Received | $0 | $0 | $0 |
| New Current Borrowing | $0 | $0 | $0 |
| New Other Liabilities (interest-free) | $0 | $0 | $0 |
| New Long-term Liabilities | $0 | $0 | $0 |
| Sales of Other Current Assets | $0 | $0 | $0 |
| Sales of Long-term Assets | $0 | $0 | $0 |
| New Investment Received | $0 | $0 | $0 |
| Subtotal Cash Received | $434,552 | $452,802 | $471,316 |
| Expenditures | Year 1 | Year 2 | Year 3 |
| Expenditures from Operations | |||
| Cash Spending | $101,232 | $105,000 | $111,000 |
| Bill Payments | $238,435 | $337,901 | $345,980 |
| Subtotal Spent on Operations | $339,667 | $442,901 | $456,980 |
| Additional Cash Spent | |||
| Sales Tax, VAT, HST/GST Paid Out | $0 | $0 | $0 |
| Principal Repayment of Current Borrowing | $0 | $0 | $0 |
| Other Liabilities Principal Repayment | $0 | $0 | $0 |
| Long-term Liabilities Principal Repayment | $12,000 | $12,000 | $12,000 |
| Purchase Other Current Assets | $0 | $0 | $0 |
| Purchase Long-term Assets | $0 | $0 | $0 |
| Dividends | $0 | $10,000 | $10,000 |
| Subtotal Cash Spent | $351,667 | $464,901 | $478,980 |
| Net Cash Flow | $82,885 | ($12,099) | ($7,664) |
| Cash Balance | $91,374 | $79,275 | $71,611 |
7.5 Projected Balance Sheet
Among the importance of monitoring liabilities and assets, cash will be of particular importance to our organization. We will monitor this section of the Balance Sheet constantly. Without cash we will be unable to react to market changes or survive through tough economic cycles. Our net worth will improve as we grow and pay off the initial loan.
| Pro Forma Balance Sheet | |||
| Year 1 | Year 2 | Year 3 | |
| Assets | |||
| Current Assets | |||
| Cash | $91,374 | $79,275 | $71,611 |
| Inventory | $26,588 | $27,705 | $28,838 |
| Other Current Assets | $0 | $0 | $0 |
| Total Current Assets | $117,962 | $106,980 | $100,449 |
| Long-term Assets | |||
| Long-term Assets | $2,000 | $2,000 | $2,000 |
| Accumulated Depreciation | $0 | $0 | $0 |
| Total Long-term Assets | $2,000 | $2,000 | $2,000 |
| Total Assets | $119,962 | $108,980 | $102,449 |
| Liabilities and Capital | Year 1 | Year 2 | Year 3 |
| Current Liabilities | |||
| Accounts Payable | $29,335 | $27,633 | $28,509 |
| Current Borrowing | $0 | $0 | $0 |
| Other Current Liabilities | $0 | $0 | $0 |
| Subtotal Current Liabilities | $29,335 | $27,633 | $28,509 |
| Long-term Liabilities | $48,000 | $36,000 | $24,000 |
| Total Liabilities | $77,335 | $63,633 | $52,509 |
| Paid-in Capital | $40,000 | $40,000 | $40,000 |
| Retained Earnings | ($6,610) | ($7,374) | ($4,653) |
| Earnings | $9,236 | $12,721 | $14,593 |
| Total Capital | $42,626 | $45,347 | $49,940 |
| Total Liabilities and Capital | $119,962 | $108,980 | $102,449 |
| Net Worth | $42,626 | $45,347 | $49,940 |
7.6 Business Ratios
The table below contains important business ratios from the sporting goods shops industry (5491), as determined by the Standard Industry Classification (SIC) Index.
| Ratio Analysis | ||||
| Year 1 | Year 2 | Year 3 | Industry Profile | |
| Sales Growth | 0.00% | 4.20% | 4.09% | 4.20% |
| Percent of Total Assets | ||||
| Inventory | 22.16% | 25.42% | 28.15% | 40.20% |
| Other Current Assets | 0.00% | 0.00% | 0.00% | 24.30% |
| Total Current Assets | 98.33% | 98.16% | 98.05% | 81.10% |
| Long-term Assets | 1.67% | 1.84% | 1.95% | 18.90% |
| Total Assets | 100.00% | 100.00% | 100.00% | 100.00% |
| Current Liabilities | 24.45% | 25.36% | 27.83% | 44.70% |
| Long-term Liabilities | 40.01% | 33.03% | 23.43% | 13.00% |
| Total Liabilities | 64.47% | 58.39% | 51.25% | 57.70% |
| Net Worth | 35.53% | 41.61% | 48.75% | 42.30% |
| Percent of Sales | ||||
| Sales | 100.00% | 100.00% | 100.00% | 100.00% |
| Gross Margin | 40.00% | 40.00% | 40.00% | 31.80% |
| Selling, General & Administrative Expenses | 33.60% | 22.50% | 21.21% | 19.00% |
| Advertising Expenses | 1.66% | 0.85% | 0.77% | 1.90% |
| Profit Before Interest and Taxes | 4.06% | 4.67% | 4.79% | 1.40% |
| Main Ratios | ||||
| Current | 4.02 | 3.87 | 3.52 | 1.97 |
| Quick | 3.11 | 2.87 | 2.51 | 0.75 |
| Total Debt to Total Assets | 64.47% | 58.39% | 51.25% | 57.70% |
| Pre-tax Return on Net Worth | 28.81% | 37.40% | 39.18% | 3.40% |
| Pre-tax Return on Assets | 10.24% | 15.56% | 19.10% | 8.20% |
| Additional Ratios | Year 1 | Year 2 | Year 3 | |
| Net Profit Margin | 2.13% | 2.81% | 3.10% | n.a |
| Return on Equity | 21.67% | 28.05% | 29.22% | n.a |
| Activity Ratios | ||||
| Inventory Turnover | 8.89 | 10.01 | 10.00 | n.a |
| Accounts Payable Turnover | 9.13 | 12.17 | 12.17 | n.a |
| Payment Days | 27 | 31 | 30 | n.a |
| Total Asset Turnover | 3.62 | 4.15 | 4.60 | n.a |
| Debt Ratios | ||||
| Debt to Net Worth | 1.81 | 1.40 | 1.05 | n.a |
| Current Liab. to Liab. | 0.38 | 0.43 | 0.54 | n.a |
| Liquidity Ratios | ||||
| Net Working Capital | $88,626 | $79,347 | $71,940 | n.a |
| Interest Coverage | 3.30 | 5.04 | 7.52 | n.a |
| Additional Ratios | ||||
| Assets to Sales | 0.28 | 0.24 | 0.22 | n.a |
| Current Debt/Total Assets | 24% | 25% | 28% | n.a |
| Acid Test | 3.11 | 2.87 | 2.51 | n.a |
| Sales/Net Worth | 10.19 | 9.99 | 9.44 | n.a |
| Dividend Payout | 0.00 | 0.79 | 0.69 | n.a |
Appendix
| Sales Forecast | |||||||||||||
| Month 1 | Month 2 | Month 3 | Month 4 | Month 5 | Month 6 | Month 7 | Month 8 | Month 9 | Month 10 | Month 11 | Month 12 | ||
| Sales | |||||||||||||
| Shoes | 0% | $14,400 | $14,688 | $14,982 | $15,281 | $15,587 | $15,899 | $16,217 | $16,541 | $16,872 | $17,209 | $17,554 | $17,905 |
| Apparel | 0% | $18,000 | $18,360 | $18,727 | $19,102 | $19,484 | $19,873 | $20,271 | $20,676 | $21,090 | $21,512 | $21,942 | $22,381 |
| Total Sales | $32,400 | $33,048 | $33,709 | $34,383 | $35,071 | $35,772 | $36,488 | $37,217 | $37,962 | $38,721 | $39,495 | $40,285 | |
| Direct Cost of Sales | Month 1 | Month 2 | Month 3 | Month 4 | Month 5 | Month 6 | Month 7 | Month 8 | Month 9 | Month 10 | Month 11 | Month 12 | |
| Shoes | 60% | $8,640 | $8,813 | $8,989 | $9,169 | $9,352 | $9,539 | $9,730 | $9,925 | $10,123 | $10,326 | $10,532 | $10,743 |
| Apparel | $10,800 | $11,016 | $11,236 | $11,461 | $11,690 | $11,924 | $12,163 | $12,406 | $12,654 | $12,907 | $13,165 | $13,428 | |
| Subtotal Direct Cost of Sales | $19,440 | $19,829 | $20,225 | $20,630 | $21,042 | $21,463 | $21,893 | $22,330 | $22,777 | $23,233 | $23,697 | $24,171 | |
| Personnel Plan | |||||||||||||
| Month 1 | Month 2 | Month 3 | Month 4 | Month 5 | Month 6 | Month 7 | Month 8 | Month 9 | Month 10 | Month 11 | Month 12 | ||
| Owner Operator | 0% | $3,000 | $3,000 | $3,000 | $3,000 | $3,000 | $3,000 | $3,000 | $3,000 | $3,000 | $3,000 | $3,000 | $3,000 |
| Manager | 0% | $3,600 | $3,600 | $3,600 | $3,600 | $3,600 | $3,600 | $3,600 | $3,600 | $3,600 | $3,600 | $3,600 | $3,600 |
| Employees | 0% | $1,836 | $1,836 | $1,836 | $1,836 | $1,836 | $1,836 | $1,836 | $1,836 | $1,836 | $1,836 | $1,836 | $1,836 |
| Total People | 5 | 5 | 5 | 5 | 5 | 5 | 5 | 5 | 5 | 5 | 5 | 5 | |
| Total Payroll | $8,436 | $8,436 | $8,436 | $8,436 | $8,436 | $8,436 | $8,436 | $8,436 | $8,436 | $8,436 | $8,436 | $8,436 | |
| General Assumptions | |||||||||||||
| Month 1 | Month 2 | Month 3 | Month 4 | Month 5 | Month 6 | Month 7 | Month 8 | Month 9 | Month 10 | Month 11 | Month 12 | ||
| Plan Month | 1 | 2 | 3 | 4 | 5 | 6 | 7 | 8 | 9 | 10 | 11 | 12 | |
| Current Interest Rate | 10.00% | 10.00% | 10.00% | 10.00% | 10.00% | 10.00% | 10.00% | 10.00% | 10.00% | 10.00% | 10.00% | 10.00% | |
| Long-term Interest Rate | 10.00% | 10.00% | 10.00% | 10.00% | 10.00% | 10.00% | 10.00% | 10.00% | 10.00% | 10.00% | 10.00% | 10.00% | |
| Tax Rate | 30.00% | 25.00% | 25.00% | 25.00% | 25.00% | 25.00% | 25.00% | 25.00% | 25.00% | 25.00% | 25.00% | 25.00% | |
| Other | 0 | 0 | 0 | 0 | 0 | 0 | 0 | 0 | 0 | 0 | 0 | 0 | |
| Pro Forma Profit and Loss | |||||||||||||
| Month 1 | Month 2 | Month 3 | Month 4 | Month 5 | Month 6 | Month 7 | Month 8 | Month 9 | Month 10 | Month 11 | Month 12 | ||
| Sales | $32,400 | $33,048 | $33,709 | $34,383 | $35,071 | $35,772 | $36,488 | $37,217 | $37,962 | $38,721 | $39,495 | $40,285 | |
| Direct Cost of Sales | $19,440 | $19,829 | $20,225 | $20,630 | $21,042 | $21,463 | $21,893 | $22,330 | $22,777 | $23,233 | $23,697 | $24,171 | |
| Other | $0 | $0 | $0 | $0 | $0 | $0 | $0 | $0 | $0 | $0 | $0 | $0 | |
| Total Cost of Sales | $19,440 | $19,829 | $20,225 | $20,630 | $21,042 | $21,463 | $21,893 | $22,330 | $22,777 | $23,233 | $23,697 | $24,171 | |
| Gross Margin | $12,960 | $13,219 | $13,484 | $13,753 | $14,028 | $14,309 | $14,595 | $14,887 | $15,185 | $15,488 | $15,798 | $16,114 | |
| Gross Margin % | 40.00% | 40.00% | 40.00% | 40.00% | 40.00% | 40.00% | 40.00% | 40.00% | 40.00% | 40.00% | 40.00% | 40.00% | |
| Expenses | |||||||||||||
| Payroll | $8,436 | $8,436 | $8,436 | $8,436 | $8,436 | $8,436 | $8,436 | $8,436 | $8,436 | $8,436 | $8,436 | $8,436 | |
| Sales and Marketing and Other Expenses | $1,800 | $1,800 | $1,800 | $1,800 | $1,800 | $1,800 | $1,800 | $1,800 | $1,800 | $1,800 | $1,800 | $1,800 | |
| Depreciation | $0 | $0 | $0 | $0 | $0 | $0 | $0 | $0 | $0 | $0 | $0 | $0 | |
| Utilities | $800 | $800 | $800 | $800 | $800 | $800 | $800 | $800 | $800 | $800 | $800 | $800 | |
| Rent | $1,980 | $1,980 | $1,980 | $1,980 | $1,980 | $1,980 | $1,980 | $1,980 | $1,980 | $1,980 | $1,980 | $1,980 | |
| Payroll Taxes | 15% | $0 | $0 | $0 | $0 | $0 | $0 | $0 | $0 | $0 | $0 | $0 | $0 |
| Other | $0 | $0 | $0 | $0 | $0 | $0 | $0 | $0 | $0 | $0 | $0 | $0 | |
| Total Operating Expenses | $13,016 | $13,016 | $13,016 | $13,016 | $13,016 | $13,016 | $13,016 | $13,016 | $13,016 | $13,016 | $13,016 | $13,016 | |
| Profit Before Interest and Taxes | ($56) | $203 | $468 | $737 | $1,012 | $1,293 | $1,579 | $1,871 | $2,169 | $2,472 | $2,782 | $3,098 | |
| EBITDA | ($56) | $203 | $468 | $737 | $1,012 | $1,293 | $1,579 | $1,871 | $2,169 | $2,472 | $2,782 | $3,098 | |
| Interest Expense | $492 | $483 | $475 | $467 | $458 | $450 | $442 | $433 | $425 | $417 | $408 | $400 | |
| Taxes Incurred | ($164) | ($70) | ($2) | $68 | $138 | $211 | $284 | $359 | $436 | $514 | $593 | $675 | |
| Net Profit | ($383) | ($210) | ($6) | $203 | $415 | $632 | $853 | $1,078 | $1,308 | $1,542 | $1,780 | $2,024 | |
| Net Profit/Sales | -1.18% | -0.64% | -0.02% | 0.59% | 1.18% | 1.77% | 2.34% | 2.90% | 3.44% | 3.98% | 4.51% | 5.02% | |
| Pro Forma Cash Flow | |||||||||||||
| Month 1 | Month 2 | Month 3 | Month 4 | Month 5 | Month 6 | Month 7 | Month 8 | Month 9 | Month 10 | Month 11 | Month 12 | ||
| Cash Received | |||||||||||||
| Cash from Operations | |||||||||||||
| Cash Sales | $32,400 | $33,048 | $33,709 | $34,383 | $35,071 | $35,772 | $36,488 | $37,217 | $37,962 | $38,721 | $39,495 | $40,285 | |
| Subtotal Cash from Operations | $32,400 | $33,048 | $33,709 | $34,383 | $35,071 | $35,772 | $36,488 | $37,217 | $37,962 | $38,721 | $39,495 | $40,285 | |
| Additional Cash Received | |||||||||||||
| Sales Tax, VAT, HST/GST Received | 0.00% | $0 | $0 | $0 | $0 | $0 | $0 | $0 | $0 | $0 | $0 | $0 | $0 |
| New Current Borrowing | $0 | $0 | $0 | $0 | $0 | $0 | $0 | $0 | $0 | $0 | $0 | $0 | |
| New Other Liabilities (interest-free) | $0 | $0 | $0 | $0 | $0 | $0 | $0 | $0 | $0 | $0 | $0 | $0 | |
| New Long-term Liabilities | $0 | $0 | $0 | $0 | $0 | $0 | $0 | $0 | $0 | $0 | $0 | $0 | |
| Sales of Other Current Assets | $0 | $0 | $0 | $0 | $0 | $0 | $0 | $0 | $0 | $0 | $0 | $0 | |
| Sales of Long-term Assets | $0 | $0 | $0 | $0 | $0 | $0 | $0 | $0 | $0 | $0 | $0 | $0 | |
| New Investment Received | $0 | $0 | $0 | $0 | $0 | $0 | $0 | $0 | $0 | $0 | $0 | $0 | |
| Subtotal Cash Received | $32,400 | $33,048 | $33,709 | $34,383 | $35,071 | $35,772 | $36,488 | $37,217 | $37,962 | $38,721 | $39,495 | $40,285 | |
| Expenditures | Month 1 | Month 2 | Month 3 | Month 4 | Month 5 | Month 6 | Month 7 | Month 8 | Month 9 | Month 10 | Month 11 | Month 12 | |
| Expenditures from Operations | |||||||||||||
| Cash Spending | $8,436 | $8,436 | $8,436 | $8,436 | $8,436 | $8,436 | $8,436 | $8,436 | $8,436 | $8,436 | $8,436 | $8,436 | |
| Bill Payments | $164 | $4,910 | $4,995 | $5,719 | $25,085 | $26,690 | $27,184 | $27,688 | $28,202 | $28,727 | $29,262 | $29,809 | |
| Subtotal Spent on Operations | $8,600 | $13,346 | $13,431 | $14,155 | $33,521 | $35,126 | $35,620 | $36,124 | $36,638 | $37,163 | $37,698 | $38,245 | |
| Additional Cash Spent | |||||||||||||
| Sales Tax, VAT, HST/GST Paid Out | $0 | $0 | $0 | $0 | $0 | $0 | $0 | $0 | $0 | $0 | $0 | $0 | |
| Principal Repayment of Current Borrowing | $0 | $0 | $0 | $0 | $0 | $0 | $0 | $0 | $0 | $0 | $0 | $0 | |
| Other Liabilities Principal Repayment | $0 | $0 | $0 | $0 | $0 | $0 | $0 | $0 | $0 | $0 | $0 | $0 | |
| Long-term Liabilities Principal Repayment | $1,000 | $1,000 | $1,000 | $1,000 | $1,000 | $1,000 | $1,000 | $1,000 | $1,000 | $1,000 | $1,000 | $1,000 | |
| Purchase Other Current Assets | $0 | $0 | $0 | $0 | $0 | $0 | $0 | $0 | $0 | $0 | $0 | $0 | |
| Purchase Long-term Assets | $0 | $0 | $0 | $0 | $0 | $0 | $0 | $0 | $0 | $0 | $0 | $0 | |
| Dividends | $0 | $0 | $0 | $0 | $0 | $0 | $0 | $0 | $0 | $0 | $0 | $0 | |
| Subtotal Cash Spent | $9,600 | $14,346 | $14,431 | $15,155 | $34,521 | $36,126 | $36,620 | $37,124 | $37,638 | $38,163 | $38,698 | $39,245 | |
| Net Cash Flow | $22,800 | $18,702 | $19,278 | $19,228 | $550 | ($353) | ($132) | $93 | $323 | $558 | $797 | $1,041 | |
| Cash Balance | $31,289 | $49,991 | $69,269 | $88,497 | $89,047 | $88,693 | $88,561 | $88,655 | $88,978 | $89,536 | $90,333 | $91,374 | |
| Pro Forma Balance Sheet | |||||||||||||
| Month 1 | Month 2 | Month 3 | Month 4 | Month 5 | Month 6 | Month 7 | Month 8 | Month 9 | Month 10 | Month 11 | Month 12 | ||
| Assets | Starting Balances | ||||||||||||
| Current Assets | |||||||||||||
| Cash | $8,489 | $31,289 | $49,991 | $69,269 | $88,497 | $89,047 | $88,693 | $88,561 | $88,655 | $88,978 | $89,536 | $90,333 | $91,374 |
| Inventory | $82,901 | $63,461 | $43,632 | $23,407 | $22,693 | $23,147 | $23,610 | $24,082 | $24,563 | $25,055 | $25,556 | $26,067 | $26,588 |
| Other Current Assets | $0 | $0 | $0 | $0 | $0 | $0 | $0 | $0 | $0 | $0 | $0 | $0 | $0 |
| Total Current Assets | $91,390 | $94,750 | $93,623 | $92,676 | $111,190 | $112,193 | $112,303 | $112,643 | $113,218 | $114,033 | $115,092 | $116,400 | $117,962 |
| Long-term Assets | |||||||||||||
| Long-term Assets | $2,000 | $2,000 | $2,000 | $2,000 | $2,000 | $2,000 | $2,000 | $2,000 | $2,000 | $2,000 | $2,000 | $2,000 | $2,000 |
| Accumulated Depreciation | $0 | $0 | $0 | $0 | $0 | $0 | $0 | $0 | $0 | $0 | $0 | $0 | $0 |
| Total Long-term Assets | $2,000 | $2,000 | $2,000 | $2,000 | $2,000 | $2,000 | $2,000 | $2,000 | $2,000 | $2,000 | $2,000 | $2,000 | $2,000 |
| Total Assets | $93,390 | $96,750 | $95,623 | $94,676 | $113,190 | $114,193 | $114,303 | $114,643 | $115,218 | $116,033 | $117,092 | $118,400 | $119,962 |
| Liabilities and Capital | Month 1 | Month 2 | Month 3 | Month 4 | Month 5 | Month 6 | Month 7 | Month 8 | Month 9 | Month 10 | Month 11 | Month 12 | |
| Current Liabilities | |||||||||||||
| Accounts Payable | $0 | $4,744 | $4,827 | $4,885 | $24,196 | $25,784 | $26,261 | $26,748 | $27,245 | $27,752 | $28,269 | $28,797 | $29,335 |
| Current Borrowing | $0 | $0 | $0 | $0 | $0 | $0 | $0 | $0 | $0 | $0 | $0 | $0 | $0 |
| Other Current Liabilities | $0 | $0 | $0 | $0 | $0 | $0 | $0 | $0 | $0 | $0 | $0 | $0 | $0 |
| Subtotal Current Liabilities | $0 | $4,744 | $4,827 | $4,885 | $24,196 | $25,784 | $26,261 | $26,748 | $27,245 | $27,752 | $28,269 | $28,797 | $29,335 |
| Long-term Liabilities | $60,000 | $59,000 | $58,000 | $57,000 | $56,000 | $55,000 | $54,000 | $53,000 | $52,000 | $51,000 | $50,000 | $49,000 | $48,000 |
| Total Liabilities | $60,000 | $63,744 | $62,827 | $61,885 | $80,196 | $80,784 | $80,261 | $79,748 | $79,245 | $78,752 | $78,269 | $77,797 | $77,335 |
| Paid-in Capital | $40,000 | $40,000 | $40,000 | $40,000 | $40,000 | $40,000 | $40,000 | $40,000 | $40,000 | $40,000 | $40,000 | $40,000 | $40,000 |
| Retained Earnings | ($6,610) | ($6,610) | ($6,610) | ($6,610) | ($6,610) | ($6,610) | ($6,610) | ($6,610) | ($6,610) | ($6,610) | ($6,610) | ($6,610) | ($6,610) |
| Earnings | $0 | ($383) | ($593) | ($599) | ($396) | $19 | $652 | $1,505 | $2,583 | $3,891 | $5,432 | $7,213 | $9,236 |
| Total Capital | $33,390 | $33,007 | $32,797 | $32,791 | $32,994 | $33,409 | $34,042 | $34,895 | $35,973 | $37,281 | $38,822 | $40,603 | $42,626 |
| Total Liabilities and Capital | $93,390 | $96,750 | $95,623 | $94,676 | $113,190 | $114,193 | $114,303 | $114,643 | $115,218 | $116,033 | $117,092 | $118,400 | $119,962 |
| Net Worth | $33,390 | $33,007 | $32,797 | $32,791 | $32,994 | $33,409 | $34,042 | $34,895 | $35,973 | $37,281 | $38,822 | $40,603 | $42,626 |


