
Pita Pal
Executive Summary
Pita Pal is a new restaurant that serves fresh and healthy pita sandwiches. Strategically located in downtown Washington, PA, Pita Pal will quickly become the premier lunch destination downtown, serving locals and students. Pita Pal will attract 35% new customers a year after the second year and will reach profitability by the end of year two.
Keys to Success
Pita Pal has identified three keys that will be instrumental in its success. The first is the design and implementation of strict financial controls, which will be important, since the restaurant industry is quite competitive. The second requirement is that it offers high-quality fresh and healthy food to clearly stand out from the competition. The last key is the need to ensure proper visibility. Pita Pal must have a effective, targeted marketing campaign to support the opening of the store in order to ensure enough business.
Food
Pita Pal will offer the community an exciting menu of pita sandwiches, salads, deserts and coffee beverages. Pita bread, Middle Eastern flat bread, is used as a healthy, tasty foundation for a variety of sandwiches. The customers will have the choice of Middle Eastern filling such as Hummus and Tabouli or more traditional American filling.
Management
Pita Pal will be lead by Steve Jones, a veteran of the restaurant industry. Steve worked for his parents at the family’s restaurant for several years before moving on to work in one of Washington’s finest restaurants while in college, as well as participating in Washington and Jefferson’s Entrepreneurship Program.
Through a combination of extensive business experience, valuable academic course work, and the award of a starter loan from the school’s Entrepreneurship Program, Steve will develop a profitable niche lunch restaurant. Sales for year two and three are $145,299 and $203,676 respectively. Profitability will be reached by the end of year two.
1.1 Mission
It is Pita Pal’s mission to offer the finest, healthiest and best tasting pita sandwiches in Washington, PA. Pita Pal will offer the finest customer service, no customer will leave who is dissatisfied.
1.2 Keys to Success
- Employ strict financial controls. This is extremely important in a retail food establishment.
- Offer the highest-quality lunch time fare.
- Ensure sufficient visibility. A strong marketing campaign required.
1.3 Objectives
- To become the premier sandwich shop in downtown Washington, PA.
- To continually draw students off campus for lunch at a rate of 35% new customers per year after the second year.
- To become profitable within the first two years.

Company Summary
Pita Pal is a recently formed PA based L.L.C. formed by Steve Jones. The company is wholly owned by Steve. The business will be based in downtown Washington and will serve the lunch and early evening crowd.
2.1 Start-up Summary
As a start-up organization, Pita Pal will require a decent amount of equipment to begin operations. The following is a somewhat complete list of the needed equipment:
- Cash register;
- Computer system, including printer, CD-RW, Internet connection;
- Convection oven;
- Refrigeration unit;
- Blender/food processor;
- Assorted knives, cutting boards, serving dishes, silverware, food containers;
- Shelving units;
- Tables, chairs, table clothes and other table accessories;
- Lighting units;
- Espresso machine and coffee maker (these items are subsidized by the coffee vendor who sells the coffee/espresso beans).

| Start-up Funding | |
| Start-up Expenses to Fund | $5,500 |
| Start-up Assets to Fund | $59,500 |
| Total Funding Required | $65,000 |
| Assets | |
| Non-cash Assets from Start-up | $25,000 |
| Cash Requirements from Start-up | $34,500 |
| Additional Cash Raised | $0 |
| Cash Balance on Starting Date | $34,500 |
| Total Assets | $59,500 |
| Liabilities and Capital | |
| Liabilities | |
| Current Borrowing | $0 |
| Long-term Liabilities | $0 |
| Accounts Payable (Outstanding Bills) | $0 |
| Other Current Liabilities (interest-free) | $0 |
| Total Liabilities | $0 |
| Capital | |
| Planned Investment | |
| Entrepreneurship Program Loan | $40,000 |
| Investor 2 | $25,000 |
| Additional Investment Requirement | $0 |
| Total Planned Investment | $65,000 |
| Loss at Start-up (Start-up Expenses) | ($5,500) |
| Total Capital | $59,500 |
| Total Capital and Liabilities | $59,500 |
| Total Funding | $65,000 |
| Start-up | |
| Requirements | |
| Start-up Expenses | |
| Legal | $3,000 |
| Stationery etc. | $300 |
| Brochures | $500 |
| Consultants | $1,000 |
| Rent | $700 |
| Total Start-up Expenses | $5,500 |
| Start-up Assets | |
| Cash Required | $34,500 |
| Other Current Assets | $0 |
| Long-term Assets | $25,000 |
| Total Assets | $59,500 |
| Total Requirements | $65,000 |
2.2 Company Ownership
Pita Pal has been formed as a limited liability company in Pennsylvania. The L.L.C. business formation has been chosen as a way of protecting the owner from personal liability while avoiding double taxation associated with a traditional corporation.
Services
Pita Pal is a downtown based sandwich shop serving the lunch time hour as well as early evening, weekdays from 10-6 pm. Pita bread is chosen for several reasons: it is unusual, healthy, and quite versatile. Each customer will have their choice of different fillings for the pita sandwiches. The range of options for fillings (not an exhaustive list) are: tofu pate, falafel, hummus, baba ganouj, tabouli, turkey, ham, chicken, pesto, assorted vegetables and assorted cheeses. In addition to the pitas, there will be several different salads available, both green as well as pastas, assorted deserts, espresso and coffee.
Market Analysis Summary
Pita Pal will be serving the Washington, PA lunch time and early evening crowd. Two distinct market segments will be targeted: students of Washington and Jefferson College and “towners.” The students will be attracted to Pita Pal as a better alternative to their on-campus meal plan. The towners will appreciate the selection and change from the more traditional offerings currently available on Main Street. Main Street has been chosen in Washington because of the recent renaissance of the downtown area. Currently, there are lots of different businesses that have hungry lunch time workers.
The competitive environment that Pita Pal faces is not too stiff. Most of the lunch time fare in downtown can be categorized as traditional offerings, diner food. While this might appeal to older residents of the town, this does not appeal to many college students and to a growing population of people who are in search of more healthy food, Pita Pal should be a big hit.
4.1 Market Segmentation
Pita Pal has segmented the market into two distinct segments:
Students
This group is primarily from Washington and Jefferson College, a liberal arts school, a tenth of a mile from downtown. The students are looking for food vendors for two main reasons, the first is the desire to get off campus, the second is to have an alternative to the on-campus food service. Demographic data and behavioral traits for the students is as follows:
- 75% of the students are on some sort of financial aid;
- 67% have a part-time job;
- Ages 17-22;
- 42% of the students were in the top 15% of their high school class;
- 36% of the students were in the 85th percentile for the SAT;
- 89% of the students eat out at least twice per week;
- 75% of the students are on the school food program.
This information pertains to the Washington and Jefferson students. There will be a few community college students who will trickle in, but since their campus is six miles away, there will not be a significant number of community college students.
Towners
This group is the people that live and work in Washington, primarily in the downtown area.
- Ages 24-55;
- The average individual income is $38,000;
- 55% of the people have at least some undergraduate schooling;
- 44% of the people work within a seven minute walk from the downtown area;
- 76% of the group go out for lunch one to two times a week.

| Market Analysis | |||||||
| Year 1 | Year 2 | Year 3 | Year 4 | Year 5 | |||
| Potential Customers | Growth | CAGR | |||||
| Students | 8% | 2,285 | 2,468 | 2,665 | 2,878 | 3,108 | 7.99% |
| Towners | 8% | 45,989 | 49,668 | 53,641 | 57,932 | 62,567 | 8.00% |
| Total | 8.00% | 48,274 | 52,136 | 56,306 | 60,810 | 65,675 | 8.00% |
Brought to you by
Create a professional business plan
Using AI and step-by-step instructions
Create Your PlanSecure funding
Validate ideas
Build a strategy
4.2 Target Market Segment Strategy
The two different market segments that Pita Pal will be going after are distinct enough that there will be two different marketing campaigns, one for each group. This is necessary because the two groups respond to different forms of communication. Students spend the majority of their day on campus, but typically venture off campus during the day for lunch. The marketing effort to reach the students will be based on their forms of written media, The General, student newspaper.
The towners can be reached through different sources of communication. These are people who work downtown and tend to patronize the other downtown businesses. These people are more in tune with the different business organizations that exist downtown. Pita Pal will attempt to communicate with this group via the local newspaper.
4.3 Service Business Analysis
Pita Pal exists within the general restaurant industry. There are many different categories within the restaurant industry. Pita Pal fits within two different niches within the industry, fast food and fast casual. Their offerings are similar to fast food in that orders are placed at the counter and served within a few minutes, and the menu is somewhat limited in selection. It is also similar to fast casual where the clientele tends to spend more time at a table relative to a fast food restaurant. The food is more expensive than a normal fast food restaurant and there is a larger product offering.
For the restaurant industry, it is normal for a venture to reach profitability by year two. If they reach it any earlier it is likely that they are cutting corners and that profit is unlikely to be sustainable. If it takes more than two years than it is quite questionable whether they will ever reach profitability.
4.3.1 Competition and Buying Patterns
Pita Pal’s competition exists in many forms:
- Fast food: This takes the form of the traditional restaurants such as McDonald’s, Burger King, and Wendy’s, as well as healthier alternatives such as Subway.
- Pizza: The predominant pizza place for sit down food is Brothers pizza, owned by two brothers who are professors at the college. This place is more popular with locals than with college students based primarily on the fact that the professor owners are not very well liked as professors so many students avoid the place.
- Deli: There are two different delis located downtown that serve deli style sandwiches. These delis serve very basic, standard deli fare, generally sliced deli meats.
- Diners: Based on the aging demographic of Washington, a function of its steel industry roots, there are several diners located in Washington, one of them downtown. These are very traditional diners, the menus are right out of the 1950’s.
- On-campus food service: At least for the students, this is an alternative in terms of food offerings. Most of the students have a food plan. Because of the poor food offerings and the need for variety, many of the students are looking for other alternatives regardless of the fact that their food is already paid for via the plan.
Strategy and Implementation Summary
Pita Pal’s business strategy will be to emphasize its healthy, custom food alternatives. Most of the competitors cannot compete with Pita Pal’s healthy menu. Most places uses a lot of fried foods, compromising the nutritional value of their food. Additionally, no one offers the same flexibility or ability to customize the product offerings. This competitive edge will also be stressed in the marketing campaign.
As mentioned earlier, Pita Pal’s marketing strategy will be distinct for each of the two market segments that it is seeking to attract.
The sales effort will be based on obtaining 100% satisfaction. Pita Pal will work hard to ensure that every customer has a wonderful experience at Pita Pal. Almost anything will be done to ensure any problems that arise are corrected.
5.1 Competitive Edge
Pita Pal has two competitive edges that will help it succeed in its business. The first edge is its healthy menu. Pita Pal takes pride in the fact that the only thing fried on the menu is falafel. Everything else is oil free, or at least free of any oils other than olive oil. In addition to the absence of oil based fats, much of its offered ingredients are vegetables, ensuring a healthy meal.
The other competitive edge that Pita Pal will leverage is customization. Customers are offered a laundry list of ingredients that they get to choose from. It is Pita Pal’s goal to serve the customer in whatever capacity is needed. This takes the form of its competitive edge where it will build the patrons pita pocket any way that they want.
5.2 Marketing Strategy
Pita Pal will employ a two pronged marketing strategy in an attempt to reach potential customers within the two market segments. To reach the students, Pita Pal must use resources that are successful in reaching the students. Recognizing that the students spend the majority of their time on campus, Pita Pal will rely on print advertisements and coupons within the student publications. The print advertisements will serve to draw notice to Pita Pal, increasing the student’s awareness about this new restaurant alternative. Pita Pal will emphasize its menu as a tasty, healthy alternative to the campus meal plan as well as other local food vendors. Pita Pal will also use coupons as a way drawing in students. Coupons are quite effective for students, most of them are on a fixed budget and jump at the chance to save money by using a coupon.
Print advertising will be used for the towners, however, Pita Pal will choose a different media source to reach these people. The readership levels for the local paper, The Sentinel are 67% of the targeted population. This will prove to be an effective method for reaching this group. Since the majority of this market segment work downtown, flyers will be passed around the downtown area calling attention to Pita Pal’s opening. Coupons will be used, but to a lesser degree with this segment as they tend to have much lower response rates relative to the other market segment.
5.3 Sales Strategy
As previously mentioned, Pita Pal will emphasize its 100% customer satisfaction to win over customers. The fact that it advertises 100% satisfaction is far less significant relative to its actions that ensure total satisfaction. This effort is based on the philosophy that it is far cheaper to maintain a current customer than it is to attract a new customer. Additionally, it is far easier and cheaper to remedy any problems with a customer as it occurs instead of dealing with an unhappy customer. With this in mind, the organization has the firm belief that if all customers leave the store happy, there will be a significant increase in sales in the long term, directly correlated with the fact that customers are being properly taken care of.
This sales philosophy is a way of treating customers. While the service offered customers is quite important, there is a need to have a quality product, otherwise the service aspect is in vain in the long term because the customers are treated well but do not perceive value in the food that they are buying. That being said, Pita Pal must offer fresh, healthy, quality food in order to fully support its customer-centered service. The menu has been devised in order to offer a wide selection with menu items that are easy to prepare, remain fresh, and are cost effective to serve. Having both a quality product and excellent service will ensure realization of the sales forecast.
Brought to you by
Create a professional business plan
Using AI and step-by-step instructions
Create Your PlanSecure funding
Validate ideas
Build a strategy
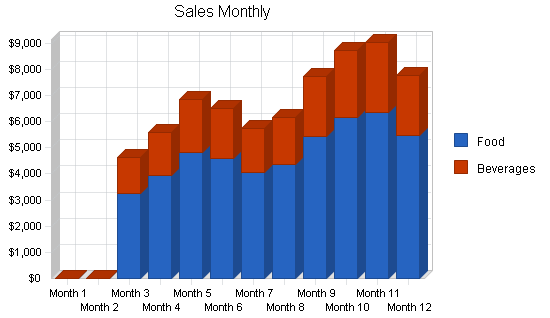
5.3.1 Sales Forecast
Pita Pal has decided to take a conservative viewpoint toward its sales forecast in order to increase the likelihood of achieving the stated goals. Pita Pal has reason to believe that the first three months of business will be fairly slow. It is forecasted that business will steadily increase over the first two years. Profitability is forecasted to be achieved toward the end of year two.
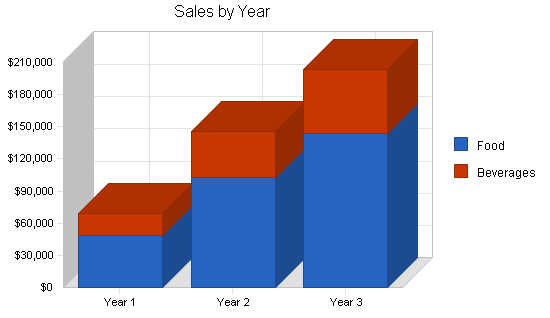
| Sales Forecast | |||
| Year 1 | Year 2 | Year 3 | |
| Sales | |||
| Food | $48,361 | $102,323 | $143,434 |
| Beverages | $20,312 | $42,976 | $60,242 |
| Total Sales | $68,673 | $145,299 | $203,676 |
| Direct Cost of Sales | Year 1 | Year 2 | Year 3 |
| Food | $14,508 | $30,697 | $43,030 |
| Beverages | $4,062 | $8,595 | $12,048 |
| Subtotal Direct Cost of Sales | $18,571 | $39,292 | $55,079 |
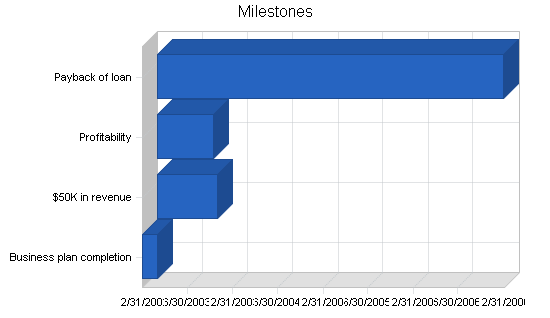
5.4 Milestones
Pita Pal has identified four milestones that are clear in terms of the goals, and are achievable:
- Business plan completion. The final version will be accomplished with in the first two months.
- $50,000 in revenue. A date of expectancy has been established and it will be useful to gauge performance on whether the revenue is realized on schedule.
- Profitability. Very important, it is forecasted to occur within two years.
- Payback of entrepreneurship loan. While non-payment of the loan will not result in serious consequences it is a matter of pride to be able to take a loan from the College’s Entrepreneurship Program and turn it into a successful business.
| Milestones | |||||
| Milestone | Start Date | End Date | Budget | Manager | Department |
| Business plan completion | 1/1/2003 | 3/1/2003 | $0 | Steve | Operations |
| $50K in revenue | 3/1/2003 | 11/1/2003 | $0 | Steve | Sales |
| Profitability | 3/1/2003 | 10/15/2003 | $0 | Steve | Accounting |
| Payback of loan | 3/1/2003 | 1/1/2007 | $0 | Steve | Accounting |
| Totals | $0 | ||||
Management Summary
Steve Jones is the driving force behind Pita Pal. Steve has lived in Washington, PA for the last four years while studying for his Bachelor of Arts from Washington and Jefferson College. Steve’s introduction to the restaurant industry came at the early age of 14 when he worked in his family’s restaurant in Cleveland.
While pursuing his degree Steve was a server at a fine dining restaurant called Angelo’s, where he received more insight into the restaurant industry. He enrolled in the Entrepreneurship Program which combined coursework with speakers and empirical experience. For lucky few, it also provided them with a low interest loan which if the business fails does not personally obligate the borrower to repay.
While Steve became more and more active in this program, he began to realize that he would not be truly happy unless he was operating his own business. He also realized that he would be most effective if he worked within the restaurant industry due to all of his experience as well as the wealth of contacts that he had access to because of his parent’s business. With this in mind, at the end of the last semester of his last year, Steve applied for the a loan through the Entrepreneurship Program and was pleasantly surprised that he won. Steve has written a business plan in response to the application requirements for the loans, however by the time the loan was awarded, many months had passed and Steve felt the need to rewrite the plan before beginning the business. He undertook this task and the business has begun.
6.1 Personnel Plan
Steve will be the main employee of Pita Pal. For the first two months of operation, Steve will be the sole employee. During this period he will oversee the finishing touches on the retail space, will develop the product recipes, and will establish vendor relationships. Month three will mark the first month of sales. Steve will have at least two employees present during open hours. Steve will also have one employee working 1.5 hours before opening to help with food prep and both employees for .5-1 hour after closing. As business ramps, Steve will employ additional employees to help out with food prep, front restaurant help, as well as back kitchen activities such as dishes and clean up.
| Personnel Plan | |||
| Year 1 | Year 2 | Year 3 | |
| Steve | $24,000 | $27,000 | $30,000 |
| employee 1 | $9,000 | $10,800 | $10,800 |
| employee 2 | $9,000 | $10,800 | $10,800 |
| employee 3 | $7,200 | $10,800 | $10,800 |
| employee 4 | $5,400 | $10,800 | $10,800 |
| Total People | 5 | 5 | 5 |
| Total Payroll | $54,600 | $70,200 | $73,200 |
Financial Plan
The following sections will detail important financial information.
7.1 Important Assumptions
The following table will detail important Financial Assumptions.
| General Assumptions | |||
| Year 1 | Year 2 | Year 3 | |
| Plan Month | 1 | 2 | 3 |
| Current Interest Rate | 10.00% | 10.00% | 10.00% |
| Long-term Interest Rate | 10.00% | 10.00% | 10.00% |
| Tax Rate | 30.00% | 30.00% | 30.00% |
| Other | 0 | 0 | 0 |
7.2 Break-even Analysis
The following table and chart show our Break-even Analysis.

| Break-even Analysis | |
| Monthly Revenue Break-even | $9,799 |
| Assumptions: | |
| Average Percent Variable Cost | 27% |
| Estimated Monthly Fixed Cost | $7,149 |
7.3 Projected Profit and Loss
The following table and charts illustrate the Projected Profit and Loss.


| Pro Forma Profit and Loss | |||
| Year 1 | Year 2 | Year 3 | |
| Sales | $68,673 | $145,299 | $203,676 |
| Direct Cost of Sales | $18,571 | $39,292 | $55,079 |
| Other Costs of Goods | $0 | $0 | $0 |
| Total Cost of Sales | $18,571 | $39,292 | $55,079 |
| Gross Margin | $50,102 | $106,007 | $148,598 |
| Gross Margin % | 72.96% | 72.96% | 72.96% |
| Expenses | |||
| Payroll | $54,600 | $70,200 | $73,200 |
| Sales and Marketing and Other Expenses | $2,400 | $2,400 | $2,400 |
| Depreciation | $5,004 | $5,004 | $5,004 |
| Rent | $9,000 | $9,000 | $9,000 |
| Utilities | $3,600 | $3,600 | $3,600 |
| Insurance | $3,000 | $3,000 | $3,000 |
| Payroll Taxes | $8,190 | $10,530 | $10,980 |
| Other | $0 | $0 | $0 |
| Total Operating Expenses | $85,794 | $103,734 | $107,184 |
| Profit Before Interest and Taxes | ($35,691) | $2,273 | $41,414 |
| EBITDA | ($30,688) | $7,277 | $46,418 |
| Interest Expense | $0 | $0 | $0 |
| Taxes Incurred | $0 | $682 | $12,424 |
| Net Profit | ($35,691) | $1,591 | $28,990 |
| Net Profit/Sales | -51.97% | 1.09% | 14.23% |
7.4 Projected Cash Flow
The following table and chart will indicate Projected Cash Flow.

| Pro Forma Cash Flow | |||
| Year 1 | Year 2 | Year 3 | |
| Cash Received | |||
| Cash from Operations | |||
| Cash Sales | $68,673 | $145,299 | $203,676 |
| Subtotal Cash from Operations | $68,673 | $145,299 | $203,676 |
| Additional Cash Received | |||
| Sales Tax, VAT, HST/GST Received | $0 | $0 | $0 |
| New Current Borrowing | $0 | $0 | $0 |
| New Other Liabilities (interest-free) | $0 | $0 | $0 |
| New Long-term Liabilities | $0 | $0 | $0 |
| Sales of Other Current Assets | $0 | $0 | $0 |
| Sales of Long-term Assets | $0 | $0 | $0 |
| New Investment Received | $0 | $0 | $0 |
| Subtotal Cash Received | $68,673 | $145,299 | $203,676 |
| Expenditures | Year 1 | Year 2 | Year 3 |
| Expenditures from Operations | |||
| Cash Spending | $54,600 | $70,200 | $73,200 |
| Bill Payments | $40,474 | $67,160 | $94,183 |
| Subtotal Spent on Operations | $95,074 | $137,360 | $167,383 |
| Additional Cash Spent | |||
| Sales Tax, VAT, HST/GST Paid Out | $0 | $0 | $0 |
| Principal Repayment of Current Borrowing | $0 | $0 | $0 |
| Other Liabilities Principal Repayment | $0 | $0 | $0 |
| Long-term Liabilities Principal Repayment | $0 | $0 | $0 |
| Purchase Other Current Assets | $0 | $0 | $0 |
| Purchase Long-term Assets | $0 | $0 | $0 |
| Dividends | $0 | $0 | $0 |
| Subtotal Cash Spent | $95,074 | $137,360 | $167,383 |
| Net Cash Flow | ($26,401) | $7,939 | $36,293 |
| Cash Balance | $8,099 | $16,037 | $52,331 |
7.5 Projected Balance Sheet
The following table will indicate the Projected Balance Sheet.
| Pro Forma Balance Sheet | |||
| Year 1 | Year 2 | Year 3 | |
| Assets | |||
| Current Assets | |||
| Cash | $8,099 | $16,037 | $52,331 |
| Other Current Assets | $0 | $0 | $0 |
| Total Current Assets | $8,099 | $16,037 | $52,331 |
| Long-term Assets | |||
| Long-term Assets | $25,000 | $25,000 | $25,000 |
| Accumulated Depreciation | $5,004 | $10,008 | $15,012 |
| Total Long-term Assets | $19,996 | $14,992 | $9,988 |
| Total Assets | $28,095 | $31,030 | $62,319 |
| Liabilities and Capital | Year 1 | Year 2 | Year 3 |
| Current Liabilities | |||
| Accounts Payable | $4,287 | $5,630 | $7,930 |
| Current Borrowing | $0 | $0 | $0 |
| Other Current Liabilities | $0 | $0 | $0 |
| Subtotal Current Liabilities | $4,287 | $5,630 | $7,930 |
| Long-term Liabilities | $0 | $0 | $0 |
| Total Liabilities | $4,287 | $5,630 | $7,930 |
| Paid-in Capital | $65,000 | $65,000 | $65,000 |
| Retained Earnings | ($5,500) | ($41,191) | ($39,601) |
| Earnings | ($35,691) | $1,591 | $28,990 |
| Total Capital | $23,809 | $25,399 | $54,389 |
| Total Liabilities and Capital | $28,095 | $31,030 | $62,319 |
| Net Worth | $23,809 | $25,399 | $54,389 |
7.6 Business Ratios
The following table displays Business Ratios of this company as well as those within the restaurant industry.
| Ratio Analysis | ||||
| Year 1 | Year 2 | Year 3 | Industry Profile | |
| Sales Growth | 0.00% | 111.58% | 40.18% | 6.96% |
| Percent of Total Assets | ||||
| Other Current Assets | 0.00% | 0.00% | 0.00% | 28.39% |
| Total Current Assets | 28.83% | 51.68% | 83.97% | 37.68% |
| Long-term Assets | 71.17% | 48.32% | 16.03% | 62.32% |
| Total Assets | 100.00% | 100.00% | 100.00% | 100.00% |
| Current Liabilities | 15.26% | 18.15% | 12.72% | 19.17% |
| Long-term Liabilities | 0.00% | 0.00% | 0.00% | 29.21% |
| Total Liabilities | 15.26% | 18.15% | 12.72% | 48.38% |
| Net Worth | 84.74% | 81.85% | 87.28% | 51.62% |
| Percent of Sales | ||||
| Sales | 100.00% | 100.00% | 100.00% | 100.00% |
| Gross Margin | 72.96% | 72.96% | 72.96% | 59.31% |
| Selling, General & Administrative Expenses | 124.93% | 71.86% | 58.72% | 39.09% |
| Advertising Expenses | 0.00% | 0.00% | 0.00% | 2.75% |
| Profit Before Interest and Taxes | -51.97% | 1.56% | 20.33% | 1.59% |
| Main Ratios | ||||
| Current | 1.89 | 2.85 | 6.60 | 1.26 |
| Quick | 1.89 | 2.85 | 6.60 | 0.87 |
| Total Debt to Total Assets | 15.26% | 18.15% | 12.72% | 54.38% |
| Pre-tax Return on Net Worth | -149.91% | 8.95% | 76.14% | 3.27% |
| Pre-tax Return on Assets | -127.04% | 7.32% | 66.45% | 7.17% |
| Additional Ratios | Year 1 | Year 2 | Year 3 | |
| Net Profit Margin | -51.97% | 1.09% | 14.23% | n.a |
| Return on Equity | -149.91% | 6.26% | 53.30% | n.a |
| Activity Ratios | ||||
| Accounts Payable Turnover | 10.44 | 12.17 | 12.17 | n.a |
| Payment Days | 27 | 26 | 26 | n.a |
| Total Asset Turnover | 2.44 | 4.68 | 3.27 | n.a |
| Debt Ratios | ||||
| Debt to Net Worth | 0.18 | 0.22 | 0.15 | n.a |
| Current Liab. to Liab. | 1.00 | 1.00 | 1.00 | n.a |
| Liquidity Ratios | ||||
| Net Working Capital | $3,812 | $10,407 | $44,401 | n.a |
| Interest Coverage | 0.00 | 0.00 | 0.00 | n.a |
| Additional Ratios | ||||
| Assets to Sales | 0.41 | 0.21 | 0.31 | n.a |
| Current Debt/Total Assets | 15% | 18% | 13% | n.a |
| Acid Test | 1.89 | 2.85 | 6.60 | n.a |
| Sales/Net Worth | 2.88 | 5.72 | 3.74 | n.a |
| Dividend Payout | 0.00 | 0.00 | 0.00 | n.a |
Appendix
| Sales Forecast | |||||||||||||
| Month 1 | Month 2 | Month 3 | Month 4 | Month 5 | Month 6 | Month 7 | Month 8 | Month 9 | Month 10 | Month 11 | Month 12 | ||
| Sales | |||||||||||||
| Food | 0% | $0 | $0 | $3,248 | $3,939 | $4,828 | $4,577 | $4,044 | $4,348 | $5,430 | $6,148 | $6,346 | $5,454 |
| Beverages | 0% | $0 | $0 | $1,364 | $1,654 | $2,028 | $1,922 | $1,699 | $1,826 | $2,281 | $2,582 | $2,665 | $2,291 |
| Total Sales | $0 | $0 | $4,612 | $5,593 | $6,855 | $6,499 | $5,743 | $6,174 | $7,711 | $8,730 | $9,011 | $7,745 | |
| Direct Cost of Sales | Month 1 | Month 2 | Month 3 | Month 4 | Month 5 | Month 6 | Month 7 | Month 8 | Month 9 | Month 10 | Month 11 | Month 12 | |
| Food | $0 | $0 | $974 | $1,182 | $1,448 | $1,373 | $1,213 | $1,304 | $1,629 | $1,844 | $1,904 | $1,636 | |
| Beverages | $0 | $0 | $273 | $331 | $406 | $384 | $340 | $365 | $456 | $516 | $533 | $458 | |
| Subtotal Direct Cost of Sales | $0 | $0 | $1,247 | $1,512 | $1,854 | $1,757 | $1,553 | $1,670 | $2,085 | $2,361 | $2,437 | $2,094 | |
| Personnel Plan | |||||||||||||
| Month 1 | Month 2 | Month 3 | Month 4 | Month 5 | Month 6 | Month 7 | Month 8 | Month 9 | Month 10 | Month 11 | Month 12 | ||
| Steve | 0% | $2,000 | $2,000 | $2,000 | $2,000 | $2,000 | $2,000 | $2,000 | $2,000 | $2,000 | $2,000 | $2,000 | $2,000 |
| employee 1 | 0% | $0 | $0 | $900 | $900 | $900 | $900 | $900 | $900 | $900 | $900 | $900 | $900 |
| employee 2 | 0% | $0 | $0 | $900 | $900 | $900 | $900 | $900 | $900 | $900 | $900 | $900 | $900 |
| employee 3 | 0% | $0 | $0 | $0 | $0 | $900 | $900 | $900 | $900 | $900 | $900 | $900 | $900 |
| employee 4 | 0% | $0 | $0 | $0 | $0 | $0 | $0 | $900 | $900 | $900 | $900 | $900 | $900 |
| Total People | 1 | 1 | 3 | 3 | 4 | 4 | 5 | 5 | 5 | 5 | 5 | 5 | |
| Total Payroll | $2,000 | $2,000 | $3,800 | $3,800 | $4,700 | $4,700 | $5,600 | $5,600 | $5,600 | $5,600 | $5,600 | $5,600 | |
Brought to you by
Create a professional business plan
Using AI and step-by-step instructions
Create Your PlanSecure funding
Validate ideas
Build a strategy
| General Assumptions | |||||||||||||
| Month 1 | Month 2 | Month 3 | Month 4 | Month 5 | Month 6 | Month 7 | Month 8 | Month 9 | Month 10 | Month 11 | Month 12 | ||
| Plan Month | 1 | 2 | 3 | 4 | 5 | 6 | 7 | 8 | 9 | 10 | 11 | 12 | |
| Current Interest Rate | 10.00% | 10.00% | 10.00% | 10.00% | 10.00% | 10.00% | 10.00% | 10.00% | 10.00% | 10.00% | 10.00% | 10.00% | |
| Long-term Interest Rate | 10.00% | 10.00% | 10.00% | 10.00% | 10.00% | 10.00% | 10.00% | 10.00% | 10.00% | 10.00% | 10.00% | 10.00% | |
| Tax Rate | 30.00% | 30.00% | 30.00% | 30.00% | 30.00% | 30.00% | 30.00% | 30.00% | 30.00% | 30.00% | 30.00% | 30.00% | |
| Other | 0 | 0 | 0 | 0 | 0 | 0 | 0 | 0 | 0 | 0 | 0 | 0 | |
| Pro Forma Profit and Loss | |||||||||||||
| Month 1 | Month 2 | Month 3 | Month 4 | Month 5 | Month 6 | Month 7 | Month 8 | Month 9 | Month 10 | Month 11 | Month 12 | ||
| Sales | $0 | $0 | $4,612 | $5,593 | $6,855 | $6,499 | $5,743 | $6,174 | $7,711 | $8,730 | $9,011 | $7,745 | |
| Direct Cost of Sales | $0 | $0 | $1,247 | $1,512 | $1,854 | $1,757 | $1,553 | $1,670 | $2,085 | $2,361 | $2,437 | $2,094 | |
| Other Costs of Goods | $0 | $0 | $0 | $0 | $0 | $0 | $0 | $0 | $0 | $0 | $0 | $0 | |
| Total Cost of Sales | $0 | $0 | $1,247 | $1,512 | $1,854 | $1,757 | $1,553 | $1,670 | $2,085 | $2,361 | $2,437 | $2,094 | |
| Gross Margin | $0 | $0 | $3,365 | $4,081 | $5,001 | $4,742 | $4,190 | $4,505 | $5,626 | $6,369 | $6,574 | $5,650 | |
| Gross Margin % | 0.00% | 0.00% | 72.96% | 72.96% | 72.96% | 72.96% | 72.96% | 72.96% | 72.96% | 72.96% | 72.96% | 72.96% | |
| Expenses | |||||||||||||
| Payroll | $2,000 | $2,000 | $3,800 | $3,800 | $4,700 | $4,700 | $5,600 | $5,600 | $5,600 | $5,600 | $5,600 | $5,600 | |
| Sales and Marketing and Other Expenses | $200 | $200 | $200 | $200 | $200 | $200 | $200 | $200 | $200 | $200 | $200 | $200 | |
| Depreciation | $417 | $417 | $417 | $417 | $417 | $417 | $417 | $417 | $417 | $417 | $417 | $417 | |
| Rent | $750 | $750 | $750 | $750 | $750 | $750 | $750 | $750 | $750 | $750 | $750 | $750 | |
| Utilities | $300 | $300 | $300 | $300 | $300 | $300 | $300 | $300 | $300 | $300 | $300 | $300 | |
| Insurance | $250 | $250 | $250 | $250 | $250 | $250 | $250 | $250 | $250 | $250 | $250 | $250 | |
| Payroll Taxes | 15% | $300 | $300 | $570 | $570 | $705 | $705 | $840 | $840 | $840 | $840 | $840 | $840 |
| Other | $0 | $0 | $0 | $0 | $0 | $0 | $0 | $0 | $0 | $0 | $0 | $0 | |
| Total Operating Expenses | $4,217 | $4,217 | $6,287 | $6,287 | $7,322 | $7,322 | $8,357 | $8,357 | $8,357 | $8,357 | $8,357 | $8,357 | |
| Profit Before Interest and Taxes | ($4,217) | ($4,217) | ($2,922) | ($2,206) | ($2,321) | ($2,580) | ($4,167) | ($3,852) | ($2,731) | ($1,988) | ($1,783) | ($2,707) | |
| EBITDA | ($3,800) | ($3,800) | ($2,505) | ($1,789) | ($1,904) | ($2,163) | ($3,750) | ($3,435) | ($2,314) | ($1,571) | ($1,366) | ($2,290) | |
| Interest Expense | $0 | $0 | $0 | $0 | $0 | $0 | $0 | $0 | $0 | $0 | $0 | $0 | |
| Taxes Incurred | $0 | $0 | $0 | $0 | $0 | $0 | $0 | $0 | $0 | $0 | $0 | $0 | |
| Net Profit | ($4,217) | ($4,217) | ($2,922) | ($2,206) | ($2,321) | ($2,580) | ($4,167) | ($3,852) | ($2,731) | ($1,988) | ($1,783) | ($2,707) | |
| Net Profit/Sales | 0.00% | 0.00% | -63.36% | -39.45% | -33.85% | -39.70% | -72.56% | -62.40% | -35.42% | -22.77% | -19.79% | -34.95% | |
| Pro Forma Cash Flow | |||||||||||||
| Month 1 | Month 2 | Month 3 | Month 4 | Month 5 | Month 6 | Month 7 | Month 8 | Month 9 | Month 10 | Month 11 | Month 12 | ||
| Cash Received | |||||||||||||
| Cash from Operations | |||||||||||||
| Cash Sales | $0 | $0 | $4,612 | $5,593 | $6,855 | $6,499 | $5,743 | $6,174 | $7,711 | $8,730 | $9,011 | $7,745 | |
| Subtotal Cash from Operations | $0 | $0 | $4,612 | $5,593 | $6,855 | $6,499 | $5,743 | $6,174 | $7,711 | $8,730 | $9,011 | $7,745 | |
| Additional Cash Received | |||||||||||||
| Sales Tax, VAT, HST/GST Received | 0.00% | $0 | $0 | $0 | $0 | $0 | $0 | $0 | $0 | $0 | $0 | $0 | $0 |
| New Current Borrowing | $0 | $0 | $0 | $0 | $0 | $0 | $0 | $0 | $0 | $0 | $0 | $0 | |
| New Other Liabilities (interest-free) | $0 | $0 | $0 | $0 | $0 | $0 | $0 | $0 | $0 | $0 | $0 | $0 | |
| New Long-term Liabilities | $0 | $0 | $0 | $0 | $0 | $0 | $0 | $0 | $0 | $0 | $0 | $0 | |
| Sales of Other Current Assets | $0 | $0 | $0 | $0 | $0 | $0 | $0 | $0 | $0 | $0 | $0 | $0 | |
| Sales of Long-term Assets | $0 | $0 | $0 | $0 | $0 | $0 | $0 | $0 | $0 | $0 | $0 | $0 | |
| New Investment Received | $0 | $0 | $0 | $0 | $0 | $0 | $0 | $0 | $0 | $0 | $0 | $0 | |
| Subtotal Cash Received | $0 | $0 | $4,612 | $5,593 | $6,855 | $6,499 | $5,743 | $6,174 | $7,711 | $8,730 | $9,011 | $7,745 | |
| Expenditures | Month 1 | Month 2 | Month 3 | Month 4 | Month 5 | Month 6 | Month 7 | Month 8 | Month 9 | Month 10 | Month 11 | Month 12 | |
| Expenditures from Operations | |||||||||||||
| Cash Spending | $2,000 | $2,000 | $3,800 | $3,800 | $4,700 | $4,700 | $5,600 | $5,600 | $5,600 | $5,600 | $5,600 | $5,600 | |
| Bill Payments | $60 | $1,800 | $1,851 | $3,326 | $3,598 | $4,056 | $3,960 | $3,897 | $4,023 | $4,434 | $4,703 | $4,765 | |
| Subtotal Spent on Operations | $2,060 | $3,800 | $5,651 | $7,126 | $8,298 | $8,756 | $9,560 | $9,497 | $9,623 | $10,034 | $10,303 | $10,365 | |
| Additional Cash Spent | |||||||||||||
| Sales Tax, VAT, HST/GST Paid Out | $0 | $0 | $0 | $0 | $0 | $0 | $0 | $0 | $0 | $0 | $0 | $0 | |
| Principal Repayment of Current Borrowing | $0 | $0 | $0 | $0 | $0 | $0 | $0 | $0 | $0 | $0 | $0 | $0 | |
| Other Liabilities Principal Repayment | $0 | $0 | $0 | $0 | $0 | $0 | $0 | $0 | $0 | $0 | $0 | $0 | |
| Long-term Liabilities Principal Repayment | $0 | $0 | $0 | $0 | $0 | $0 | $0 | $0 | $0 | $0 | $0 | $0 | |
| Purchase Other Current Assets | $0 | $0 | $0 | $0 | $0 | $0 | $0 | $0 | $0 | $0 | $0 | $0 | |
| Purchase Long-term Assets | $0 | $0 | $0 | $0 | $0 | $0 | $0 | $0 | $0 | $0 | $0 | $0 | |
| Dividends | $0 | $0 | $0 | $0 | $0 | $0 | $0 | $0 | $0 | $0 | $0 | $0 | |
| Subtotal Cash Spent | $2,060 | $3,800 | $5,651 | $7,126 | $8,298 | $8,756 | $9,560 | $9,497 | $9,623 | $10,034 | $10,303 | $10,365 | |
| Net Cash Flow | ($2,060) | ($3,800) | ($1,038) | ($1,533) | ($1,443) | ($2,257) | ($3,817) | ($3,323) | ($1,912) | ($1,305) | ($1,292) | ($2,621) | |
| Cash Balance | $32,440 | $28,640 | $27,602 | $26,069 | $24,625 | $22,369 | $18,552 | $15,229 | $13,317 | $12,012 | $10,719 | $8,099 | |
| Pro Forma Balance Sheet | |||||||||||||
| Month 1 | Month 2 | Month 3 | Month 4 | Month 5 | Month 6 | Month 7 | Month 8 | Month 9 | Month 10 | Month 11 | Month 12 | ||
| Assets | Starting Balances | ||||||||||||
| Current Assets | |||||||||||||
| Cash | $34,500 | $32,440 | $28,640 | $27,602 | $26,069 | $24,625 | $22,369 | $18,552 | $15,229 | $13,317 | $12,012 | $10,719 | $8,099 |
| Other Current Assets | $0 | $0 | $0 | $0 | $0 | $0 | $0 | $0 | $0 | $0 | $0 | $0 | $0 |
| Total Current Assets | $34,500 | $32,440 | $28,640 | $27,602 | $26,069 | $24,625 | $22,369 | $18,552 | $15,229 | $13,317 | $12,012 | $10,719 | $8,099 |
| Long-term Assets | |||||||||||||
| Long-term Assets | $25,000 | $25,000 | $25,000 | $25,000 | $25,000 | $25,000 | $25,000 | $25,000 | $25,000 | $25,000 | $25,000 | $25,000 | $25,000 |
| Accumulated Depreciation | $0 | $417 | $834 | $1,251 | $1,668 | $2,085 | $2,502 | $2,919 | $3,336 | $3,753 | $4,170 | $4,587 | $5,004 |
| Total Long-term Assets | $25,000 | $24,583 | $24,166 | $23,749 | $23,332 | $22,915 | $22,498 | $22,081 | $21,664 | $21,247 | $20,830 | $20,413 | $19,996 |
| Total Assets | $59,500 | $57,023 | $52,806 | $51,351 | $49,401 | $47,541 | $44,867 | $40,633 | $36,893 | $34,564 | $32,842 | $31,133 | $28,095 |
| Liabilities and Capital | Month 1 | Month 2 | Month 3 | Month 4 | Month 5 | Month 6 | Month 7 | Month 8 | Month 9 | Month 10 | Month 11 | Month 12 | |
| Current Liabilities | |||||||||||||
| Accounts Payable | $0 | $1,740 | $1,740 | $3,207 | $3,463 | $3,924 | $3,830 | $3,763 | $3,876 | $4,278 | $4,544 | $4,617 | $4,287 |
| Current Borrowing | $0 | $0 | $0 | $0 | $0 | $0 | $0 | $0 | $0 | $0 | $0 | $0 | $0 |
| Other Current Liabilities | $0 | $0 | $0 | $0 | $0 | $0 | $0 | $0 | $0 | $0 | $0 | $0 | $0 |
| Subtotal Current Liabilities | $0 | $1,740 | $1,740 | $3,207 | $3,463 | $3,924 | $3,830 | $3,763 | $3,876 | $4,278 | $4,544 | $4,617 | $4,287 |
| Long-term Liabilities | $0 | $0 | $0 | $0 | $0 | $0 | $0 | $0 | $0 | $0 | $0 | $0 | $0 |
| Total Liabilities | $0 | $1,740 | $1,740 | $3,207 | $3,463 | $3,924 | $3,830 | $3,763 | $3,876 | $4,278 | $4,544 | $4,617 | $4,287 |
| Paid-in Capital | $65,000 | $65,000 | $65,000 | $65,000 | $65,000 | $65,000 | $65,000 | $65,000 | $65,000 | $65,000 | $65,000 | $65,000 | $65,000 |
| Retained Earnings | ($5,500) | ($5,500) | ($5,500) | ($5,500) | ($5,500) | ($5,500) | ($5,500) | ($5,500) | ($5,500) | ($5,500) | ($5,500) | ($5,500) | ($5,500) |
| Earnings | $0 | ($4,217) | ($8,434) | ($11,356) | ($13,562) | ($15,883) | ($18,463) | ($22,630) | ($26,483) | ($29,214) | ($31,202) | ($32,985) | ($35,691) |
| Total Capital | $59,500 | $55,283 | $51,066 | $48,144 | $45,938 | $43,617 | $41,037 | $36,870 | $33,017 | $30,286 | $28,298 | $26,515 | $23,809 |
| Total Liabilities and Capital | $59,500 | $57,023 | $52,806 | $51,351 | $49,401 | $47,541 | $44,867 | $40,633 | $36,893 | $34,564 | $32,842 | $31,133 | $28,095 |
| Net Worth | $59,500 | $55,283 | $51,066 | $48,144 | $45,938 | $43,617 | $41,037 | $36,870 | $33,017 | $30,286 | $28,298 | $26,515 | $23,809 |


