
Quaestor Services
Executive Summary
Quaestor Services is in the process of being formed as a sole proprietorship owned and operated by Sheila Claflin. This plan is written as a guide for financing, start-up and management of this new business and will also serve as the basis for measurement. The following is a summary of the main points of this plan.
- The objectives of Quaestor are to generate a profit, grow at a challenging and manageable rate, and to be a good citizen in the community.
- The mission of Quaestor is to provide products and services with high quality, protection and value pricing.
- The keys to success for Quaestor are variety of business services and products, personal contact, timely and accurate service, development of one-to-one relationships, and a reputation of honesty and integrity.
- The primary products offered will be from Whelnoan Insurance Company, and the added value to small businesses will be the accounting and financial services offered.
- The local market for this business is wide open. Whelnoan Insurance Company has captured 23% of the market share and is considered the second largest insurance company in Plainstate.
- In the first year of operation, a customer base is being established. Over 85% of the new and established insurance business will renew each year creating compounding growth in sales of over 200% with limited increase in operational expense.
In conclusion, as shown in the highlights chart below, this plan projects rapid growth over the next three years with a profit forecasted in the second year of operation and continuing into future years of operation. Implementing this plan, will ensure that Quaestor Services becomes a profitable venture.

1.1 Objectives
The main objectives of Quaestor Services are:
- Profit – to create enough prosperity for the owner and employees to have a secure and comfortable lifestyle.
- Growth – to grow the business at a rate that is both challenging and manageable.
- Citizenship – to be a social asset to the community and contribute to others who are less fortunate.
1.2 Mission
Quaestor Services is dedicated to providing insurance products and business services that provide high quality, protection, and value pricing. We wish to establish a successful partnership with our clients that respects their interests and goals.
Success will be measured by our clients choosing us because of their belief in our ability to meet or exceed their expectations of price, service, and expertise.
1.3 Keys to Success
The keys to the success for Quaestor Services are:
- A wide variety of business services and insurance products that are affordable, available and understandable.
- Personal contact and service that meets or exceeds the expectations of our clients.
- Services and products that are delivered with accuracy and timeliness.
- Relationships with our clients that fosters renewal business.
- A reputation in the community for it’s honesty and integrity.
Company Summary
Quaestor Services is a start-up company located in Smileyville, Plainstate, a suburb of Niceburg, providing both accounting and full-charge bookkeeping services and insurance and retirement products to individuals, families, and small businesses.
2.1 Company Ownership
Quaestor Services is a sole proprietorship, owned by Sheila Claflin. Born and raised in the Pacific Northwest with Native American Indian heritage, Sheila was relocated to Plainstate in 1994 by her employer.
She has over 30 years of experience in Finance, Accounting, Management, and Consulting and recently received her Plainstate insurance agent license for Life, Health, Property and Casualty insurance.
In the near future she intends to receive her Series 6 Securities license and take H & R Block Income Tax Course.
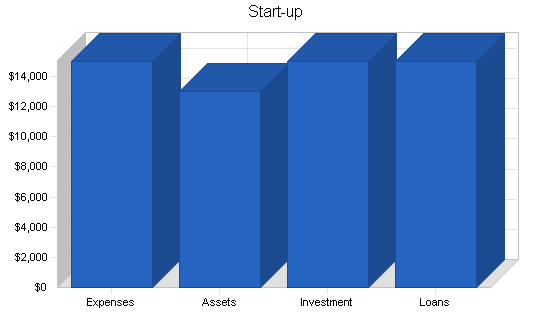
2.2 Start-up Summary
Quaestor Services start-up costs include:
- Marketing/Lead Services: marketing and lead generation services to establish client base
- Website Development: professionally developed business website on the Internet
- Logo: professionally developed business logo for business recognition in the market place
- Stationary: the printing of letterhead and envelopes with the company logo
- Business Cards: the printing of business cards with company logo
- Brochures: development and printing of brochures for marketing the business
- Cell Phone and Pager: business cell phone and pager for communication with the clients at all times
- Office Supplies: supplies necessary to set up an office
- Training/Licensing: costs associated with the three state licenses required for insurance business
- Business Associations: membership into several business associations such as Chamber of Commerce
Quaestor Services long-term assets include:
- Laptop Computer: used in meetings with clients for printing insurance quotes and on-line applications
- PC Computer/Monitor: used in office for accounting services and record of business transactions
- Printer/Copier/Scanner: used in office for business transactions
Start-up costs come to $30,000 of which $15,000 is being financed by a direct owner investment. In the first six months of operation $15,000 financing is being sought after for the start-up costs. In mid-Year 1 an additional $10,000 in financing will be required to ensure business operations, marketing and stability during the first year of operation.
| Start-up | |
| Requirements | |
| Start-up Expenses | |
| Marketing/Lead Services | $4,000 |
| Website Development | $1,500 |
| Business Logo | $800 |
| Stationary | $750 |
| Business Cards | $300 |
| Marketing Brochures | $2,500 |
| Cell Phone and Pager | $300 |
| Office Supplies | $350 |
| Training/Licensing | $2,500 |
| Business Associations | $2,000 |
| Miscellaneous | $0 |
| Total Start-up Expenses | $15,000 |
| Start-up Assets | |
| Cash Required | $10,000 |
| Other Current Assets | $0 |
| Long-term Assets | $3,000 |
| Total Assets | $13,000 |
| Total Requirements | $28,000 |
Services
Quaestor Services provides accounting and full-charge bookkeeping services, insurance and retirement products to individuals, families, and small businesses.
As a representative of Whelnoan Insurance Company the following product and services are offered:
- Personal Lines – auto, renters, home, motorcycle, boat/yacht, snowmobile, jet ski
- Commercial Lines – businesses, workers compensation, surety bonds
- Life & Disability Products – term, whole, universal and variable life, long-term care, disability
- Retirement Products – fixed, equity indexed, and variable annuities, mutual funds
- Retirement Plans – IRA, Roth IRA, pension plans, SEP plans, SIMPLE plans
- Life Planning Concepts – mortgage protector, business continuation, buy/sell agreements
- Value Added Products
In the future we intend to offer the following independent products and services:
- Health Insurance
- Pet Care Insurance
Accounting and Full-Charge Bookkeeping Services are available at either the client’s location or in our offices on a regular, permanent basis with a schedule that accommodates the client’s needs. Rates are based on the needs of the business. These services include:
- Accounts Payable
- Accounts Receivable
- Credit/Collection
- Payroll
- Reconciliations
- General Ledger Maintenance
- Financial Statements
In the future we intend to offer the following accounting service:
- Income Tax Preparation
Market Analysis Summary
The market area for Quaestor Services will be focused on three counties, Pleasant, Niceburg and Contented, in Plainstate. These counties are experiencing a combined average growth in population over the 2000 census of 6.45%.
As of 2004, the Whelnoan Insurance Company is the second largest insurance company in Plainstate with 23% of the market share. The overall market for Quaestor is wide open. This business plan has identified over 1.3 million individuals and business as potential clients in the market area.
4.1 Market Segmentation
Quaestor Services has targeted the following market segments:
| – | State | Pleasant | Niceburg | Contented | Total | % |
| YR 2004 Estimate-Total Population | 4,814,628 | 545,991 | 560,265 | 284,032 | 1,390,288 | 28.9% |
| – | – | – | – | – | – | – |
| YR 2004 Estimate-15 to 24 years old | 528,756 | 55,264 | 60,509 | 19,652 | 135,425 | 25.6% |
| YR 2004 Estimate-24 to 74 years old | 2,224,217 | 255,517 | 265,626 | 136,052 | 657,195 | 29.5% |
| Available Market Share 77% | 2,752,973 | 310,781 | 326,135 | 155,704 | 792,620 | 28.8% |
| – | – | – | – | – | – | – |
| YR 2004 Estimate-Total Housing Units | 2,244,113 | 237,308 | 279,912 | 97,555 | 614,774 | 27.4% |
| Available market Share 77% | 1,727,967 | 182,727 | 215,532 | 75,117 | 473,376 | 27.4% |
| Housing Units-Owner Occupied | 1,162,922 | 124,254 | 113,154 | 66,028 | 303,436 | 26.1% |
| Housing Units-Renters | 119,230 | 9,502 | 13,363 | 7,887 | 30,752 | 25.8% |
| – | – | – | – | – | – | – |
| YR 2004 Estimate-Small Bus > 20 Emp | 122,452 | – | – | – | 94,288 | 77.0% |
Brought to you by
Create a professional business plan
Using AI and step-by-step instructions
Create Your PlanSecure funding
Validate ideas
Build a strategy
The available market share of 77% represents the market that Whelnoan Insurance has not captured at this time. Although,the entire state is an available marketing area, the tri-county area will be the focus marketing area at this time. The total population of the tri-county area available for marketing is 29% of the total available population in Plainstate.
The first and most important market segment is population broken down by age groups. This can be used for determining the market for personal lines of insurance such as auto and various recreational vehicles, life and life planning products.
Note that the population of 15 to 24 year olds has been separated from the available population as a market segment in itself for determining the possibility of high risk auto insurance policies.
The second market segment is housing units broken down by owner occupied and renters. This can be used for determining the market for personal lines of insurance such as home, townhouses, condominium, renters and mortgage protection.
The third market segment is small businesses with less than 20 employees. This can be used for determining the market for accounting and bookkeeping services and commercial lines of insurance including property and casualty, retirement and workers compensation.


| Market Analysis | |||||||
| Year 1 | Year 2 | Year 3 | Year 4 | Year 5 | |||
| Potential Customers | Growth | CAGR | |||||
| Focus Population (Ages 15 to 24 years old) | 6% | 135,425 | 144,160 | 153,458 | 163,356 | 173,892 | 6.45% |
| Focus Population (Ages 25 to 74 years old) | 6% | 657,195 | 699,584 | 744,707 | 792,741 | 843,873 | 6.45% |
| Small Business (Less than 20 employees) | 6% | 94,288 | 99,757 | 105,543 | 111,664 | 118,141 | 5.80% |
| Focus Housing Units (Owned) | 12% | 303,436 | 339,059 | 378,865 | 423,344 | 473,045 | 11.74% |
| Focus Housing Units (Rented) | 12% | 30,752 | 34,362 | 38,396 | 42,904 | 47,941 | 11.74% |
| Total | 7.93% | 1,221,096 | 1,316,922 | 1,420,969 | 1,534,009 | 1,656,892 | 7.93% |
Strategy and Implementation Summary
- Emphasize value instead of price. Quaestor is dedicated to working closely with each client and educating them on the importance of value over price.
- Build long term relationships. Quaestor is dedicated to establishing a successful partnership with each client, respecting their interests and goals by cultivating a long term relationship to enhance client retention.
- Focus on increasing market share. Quaestor will focus on personal and business clients that have been identified in the targeted markets.
5.1 Competitive Edge
Quaestor’s competitive edge is our positioning as strategic ally with our clients, who are clients more than customers. By building a business based on long-standing relationships with satisfied clients, we simultaneously build defenses against competition. The longer the relationship stands, the more we help our clients understand what we offer them and why they need it.
5.2 Marketing Strategy
The marketing strategy is the core of Quaestor’s main strategy:
- Emphasize, and educate the client on, the importance of value over price
- Build a relationship business that fosters client retention
- Develop specific programs for each target market segment
5.3 Sales Strategy
Quaestor’s sales strategy will be based on systematic person-to-person contacts through referrals, direct mail, telemarketing and the Internet. A list of potential prospects has already been compiled and will serve as a launching pad for marketing the products and services.
5.3.1 Sales Forecast
The important elements of the sales forecasts are summarized on three line items, Accounting Services, Insurance Sales, and Miscellaneous Revenue. The summary of the initial sales forecast indicates a first year revenue of $39,500 increasing to over $108,310 by the end of the second year, then $122,110 by the end of the third year. It should be noted that although sales triple in the second year, all revenue has been forecasted very conservatively for the three year forecast. Forecasted sales increases are overstated by the Whelnoan Insurance subsidies or Miscellaneous sales. Actual sales growth for the second year is 160% due to adding a producer for continued sales growth and exponential growth of insurance renewals. The third year of sales reflects an actual growth of 76% due mostly to the increase in insurance renewals. Each element will be discussed separately and in its entirety below:
Accounting Services – it has been determined in order to be conservative for this forecast, that the average accounting client requires services at approximately $500 a month, or 25 hours (x) $20 hour. Obviously this can vary depending on the needs of the client, but for forecasting purposes this is the standard used in determining the monthly revenue. In addition, it is assumed that once our services are sold to the accounting client, they will continue to generate a monthly revenue until replaced. Income tax preparation which will yield a substantial increase in revenue as a future service, but is not considered in this forecast. The illustration below, shows two clients are forecasted for the second year and three clients are forecasted for the third year. Accounting clients can sometimes require substantial time at first, until the clients’ needs are defined and set up. Limited clients are being forecasted due to the time required growing the client base for insurance.
| Month | FY2005 | FY2006 | FY2007 |
| Jan | – | 1,000 | 1,500 |
| Feb | – | 1,000 | 1,500 |
| Mar | 500 | 1,000 | 1,500 |
| Apr | 500 | 1,000 | 1,500 |
| May | 500 | 1,000 | 1,500 |
| Jun | 500 | 1,000 | 1,500 |
| Jul | 1,000 | 1,000 | 1,500 |
| Aug | 1,000 | 1,000 | 1,500 |
| Sep | 1,000 | 1,000 | 1,500 |
| Oct | 1,000 | 1,000 | 1,500 |
| Nov | 1,000 | 1,000 | 1,500 |
| Dec | 1,000 | 1,000 | 1,500 |
| Sales Increase | – | 50% | 50% |
| TOTAL | $8,000 | $12,000 | $18,000 |
Insurance Sales – are comprised of two categories, 1) insurance-new sales and 2) insurance-renewals. The insurance products used to forecast new sales are, auto and high risk auto (renews every six months), property structures such as homes, townhouses, condominiums, renters and landlord insurance, commercial, life and all other types of recreation vehicle insurance, (renews annually). It should be noted that in order to be conservative, not all insurance products that are offered were forecast, such as health, retirement products and plans. Whelnoan Insurance Company District Office supplied the necessary documentation needed for the formulation of the insurance sales and renewals. Sales are based on actual results (averaged) created for the first three years of a new Whelnoan Insurance agency. All numbers have been reviewed and approved by them before the forecast was entered into this business plan.
What makes insurance sales different from other sales are the renewals. In most cases, without an increase in monthly production, the monthly income will almost double due to renewals. It has been determined by Whelnoan Insurance that customer loyalty in the first year is 87%, second year is 85% and third year is 89%. Other than auto, which renews every six months, all other insurance products renew on an annual basis. Because of renewals, it is possible to double sales revenue without increasing production costs. The following is the monthly forecast:
| NEW INSURANCE SALES | INSURANCE RENEWALS | TOTAL |
| Month | FY2005 | FY2006 | FY2007 | FY2005 | FY2006 | FY2007 | FY2005 | FY2006 | FY2007 |
| Jan | 290 | 2,132 | 3,961 | – | 593 | 2,504 | 290 | 2,725 | 6,465 |
| Feb | 1,255 | 2,868 | 3,960 | – | 927 | 3,370 | 1,255 | 3,795 | 7,330 |
| Mar | 1,290 | 2,901 | 3,961 | – | 954 | 3,424 | 1,290 | 3,855 | 7,385 |
| Apr | 1,325 | 3,107 | 4,129 | – | 1,008 | 3,706 | 1,325 | 4,115 | 7,835 |
| May | 1,355 | 3,104 | 4,129 | – | 1,026 | 3,641 | 1,355 | 4,130 | 7,770 |
| Jun | 1,415 | 3,239 | 4,130 | – | 1,246 | 3,955 | 1,415 | 4,485 | 8,085 |
| Jul | 1,490 | 3,405 | 4,466 | 60 | 1,255 | 4,084 | 1,550 | 4,660 | 8,550 |
| Aug | 1,490 | 3,408 | 4,468 | 270 | 1,632 | 4,462 | 1,760 | 5,040 | 8,930 |
| Sep | 1,490 | 3,407 | 4,468 | 300 | 1,813 | 4,462 | 1,790 | 5,220 | 9,110 |
| Oct | 1,525 | 3,609 | 4,803 | 330 | 1,821 | 4,852 | 1,855 | 5,430 | 9,655 |
| Nov | 1,525 | 3,504 | 4,299 | 330 | 1,821 | 4,771 | 1,855 | 5,325 | 9,070 |
| Dec | 1,525 | 3,955 | 4,300 | 360 | 1,875 | 4,825 | 1,885 | 5,830 | 9,125 |
| Sales Increase | – | 142% | 32% | – | 868% | 202% | – | 210% | 82% |
| TOTAL | $15,975 | $38,639 | $51,074 | $1,650 | $15,971 | $48,236 | $17,625 | $54,610 | $99,310 |
Miscellaneous – the amounts forecasted in Miscellaneous are Whelnoan Insurance subsidies offered at pivotal times throughout the first two years to financially support the insurance agency during the development stage. The subsidies are broken down into four categories, and require that milestone production levels be achieved before the subsidy is made available, 1) commissions on new sales 2) marketing leads, 3) office space, and 4) staff. At the end of two full years of operations as a career agent, subsidies are no longer available. The total subsidies forecasted in the first year is $13,875, in the second year $41,700, and $4,800 in third year, for a total of $60,375.


| Sales Forecast | |||
| Year 1 | Year 2 | Year 3 | |
| Sales | |||
| Accounting Services | $8,000 | $12,000 | $18,000 |
| Insurance Sales | $17,625 | $54,610 | $99,310 |
| Miscellaneous | $13,875 | $41,700 | $4,800 |
| Total Sales | $39,500 | $108,310 | $122,110 |
| Direct Cost of Sales | Year 1 | Year 2 | Year 3 |
| Direct Cost of Sales (owner/agent salary) | $27,900 | $58,500 | $65,500 |
| Other Cost of Sales | $0 | $4,500 | $5,400 |
| Subtotal Direct Cost of Sales | $27,900 | $63,000 | $70,900 |
Brought to you by
Create a professional business plan
Using AI and step-by-step instructions
Create Your PlanSecure funding
Validate ideas
Build a strategy
5.4 Milestones
The table below lists important program milestones, with dates and managers in charge. The milestone schedule indicates Quaestor’s emphasis on planning for implementation and the measurement of these activities. In addition, each milestone is important to achieving the financial forecast used in this business plan. The following is a brief description of each milestone:
- 12/01/04-01/31/05-Business Financing – obtain the very important start-up financing necessary for the first year of operation.
- 01/01/05-03/31/05-Career Agent – the Whelnoan Career Agent Program starts when a new agent has completed their training, received the required insurance licenses and in the last 90 days sold 30 policies including three life insurance policies.
- 01/01/05-02/28/05-Accounting Services (1st Client) – obtain the first monthly client for accounting services.
- 03/01/05-06/30/05-Accounting Services (2nd Client) – obtain the second monthly client for accounting services.
- 04/01/05-09/30/05-Career Agent (6 months) – the first milestone in the Whelnoan Career Agent Program. A Career Agent receives $1,500/monthly for the first six months. At the end of six months, a Career Agent’s production is checked for the number of policies issued-and-paid to determine subsidy level. Required level per financial forecast is 80 property and casualty policies and eight life policies which allows a subsidy match of commission dollar for dollar on new business commissions up to $2,000/month and a lead subsidy of $100/month.
- 05/01/05-06/30/05-Business Financing – obtain additional financing to ensure business operations, marketing and stability during the first year of operation.
- 11/01/05-12/31/05-Hire Agent – hire and train new agent for a start date of 1/01/06.
- 04/01/05-03/31/06-Career Agent (12 months) – the second milestone in the Whelnoan Career Agent Program. At the end of twelve months, a Career Agent’s production is checked for the number of policies issued-and-paid to determine a new subsidy level. Required level per financial forecast is 180 property and casualty policies and 18 life policies which allows an additional subsidy for staff at $1,500/month and office space of $750/month.
Whelnoan Insurance Subsidies are available for 24 months only or 4/1/05-03/31/07
- 04/01/05-03/31/07-Run to Daylight (24 months) – the third milestone in the Whelnoan Career Agent Program. At the end of twenty-four months, a Career Agent’s production is checked for the number of policies in force to determine waiver of one third of the subsidies paid to the agent. In order to be eligible, an agent must have 400 property and casualty policies and 40 life policies in force.
- 04/01/05-03/31/08-Run to Daylight (36 months) – the fourth milestone in the Whelnoan Career Agent Program. At the end of thirty-six months, a Career Agent’s production is checked for the number of policies in force to determine waiver of second third of the subsidies paid to the agent. In order to be eligible, an agent must have 540 property and casualty policies and 54 life policies in force.
- 04/01/05-03/31/09-Run to Daylight (48 months) – the fifth milestone in the Whelnoan Career Agent Program. At the end of forty-eight months, a Career Agent’s production is checked for the number of policies in force to determine waiver of last third of the subsidies paid to the agent. In order to be eligible, an agent must have 660 property and casualty policies and 66 life policies in force.

| Milestones | |||||
| Milestone | Start Date | End Date | Budget | Manager | Department |
| Business Financing | 12/1/2004 | 1/31/2005 | $0 | Owner | Finance |
| Career Agent | 1/1/2005 | 3/31/2005 | $0 | Owner | Marketing |
| Accounting Serv-(1st Client) | 1/1/2005 | 2/28/2005 | $0 | Owner | Marketing |
| Accounting Serv-(2nd Client) | 3/1/2005 | 6/30/2005 | $0 | Owner | Marketing |
| Career Agent (6 mos) | 4/1/2005 | 9/30/2005 | $0 | Owner | Marketing |
| Business Financing | 5/1/2005 | 6/30/2005 | $0 | Owner | Finance |
| Hire Agent | 11/1/2005 | 12/31/2005 | $0 | Owner | Administrative |
| Career Agent (12 mos) | 4/1/2005 | 3/31/2006 | $0 | Owner | Marketing |
| Run to Daylight (24 mos) | 4/1/2005 | 3/31/2007 | $0 | Owner | Marketing |
| Run to Daylight (36 mos) | 4/1/2005 | 3/31/2008 | $0 | Owner | Marketing |
| Run to Daylight (48 mos) | 4/1/2005 | 3/31/2009 | $0 | Owner | Marketing |
| Totals | $0 | ||||
Management Summary
The management philosophy of Quaestor Services is based on respect for every client, and individual responsibility. For the first year the only employee will be the owner, Sheila Claflin. In January of 2006 the financial forecast supports the hiring of an insurance agent to help increase the growth of the business.
Quaestor’s intention is to hire only those who demonstrate the qualities necessary for working in a professional environment, and the willingness to move forward in continuing education. We will be hiring the ultimate “people persons” to provide world class service.
6.1 Personnel Plan
The Personnel Plan reflects the staffing levels required to create, and establish the customer base needed to achieve the revenues projected and reach profitability.
All insurance sales and business service personnel salaries are considered a direct cost of sales, and are listed as such in the financials.
Financial Plan
Quaestor Services’ financial plan is based on obtaining a loan by January of 2005 of $15,000 to cover the start-up expenses. In July of 2005 an additional $10,000 in financing will be required to ensure business operations, marketing and stability during the first year of operation. For financial forecasting the loan is a seven year loan at an interest rate of 9.09%. Quaestor will achieve profitability in the second year.
The fiscal year is a calendar year, January through December.
7.1 Start-up Funding
Start-up costs come to $30,000 of which $15,000 is being financed by a direct owner investment. Before the first six months of operation, $15,000 financing is being sought for the start-up costs. In July of 2005 an additional $10,000 in financing will be required to ensure business operations, marketing and stability during the first year of operation.
| Start-up Funding | |
| Start-up Expenses to Fund | $15,000 |
| Start-up Assets to Fund | $13,000 |
| Total Funding Required | $28,000 |
| Assets | |
| Non-cash Assets from Start-up | $3,000 |
| Cash Requirements from Start-up | $10,000 |
| Additional Cash Raised | $2,000 |
| Cash Balance on Starting Date | $12,000 |
| Total Assets | $15,000 |
| Liabilities and Capital | |
| Liabilities | |
| Current Borrowing | $0 |
| Long-term Liabilities | $15,000 |
| Accounts Payable (Outstanding Bills) | $0 |
| Other Current Liabilities (interest-free) | $0 |
| Total Liabilities | $15,000 |
| Capital | |
| Planned Investment | |
| Owner | $15,000 |
| Other | $0 |
| Additional Investment Requirement | $0 |
| Total Planned Investment | $15,000 |
| Loss at Start-up (Start-up Expenses) | ($15,000) |
| Total Capital | $0 |
| Total Capital and Liabilities | $15,000 |
| Total Funding | $30,000 |
7.2 Important Assumptions
The key underlying assumptions of Quaestor financial plan shown in the following general assumption table are:
- We assume access to financing of $30,000 to support our financial plan.
- We assume our financial progress is based on a very conservative sales forecast supported by data received and reviewed by Whelnoan Insurance.
- We assume that all sales milestones have been achieved.
| General Assumptions | |||
| Year 1 | Year 2 | Year 3 | |
| Plan Month | 1 | 2 | 3 |
| Current Interest Rate | 9.09% | 9.09% | 9.09% |
| Long-term Interest Rate | 9.09% | 9.09% | 9.09% |
| Tax Rate | 20.00% | 20.00% | 20.00% |
| Other | 0 | 0 | 0 |
7.3 Break-even Analysis
The following table and chart show our Break-even Analysis. The first year due to start-up costs and expenses will not be included in the break-even analysis.

| Break-even Analysis | |
| Monthly Revenue Break-even | $4,997 |
| Assumptions: | |
| Average Percent Variable Cost | 71% |
| Estimated Monthly Fixed Cost | $1,468 |
7.4 Projected Profit and Loss
Based on the realistic sales projections and efficient cost control measures in place, Quaestor will achieve profitability in the second year of operation. Monthly profitability is first achieved in November 2005, but due to developing a customer base, the first months of operations reflect a loss.
In the second year of operation, sales increased $68,810 or 174%, resulting in a net profit. Significant changes in the second year are the hiring of an agent in January 2006, resulting in additional costs to the direct cost of sales of $34,500 and the set-up of an office outside of the owner’s home and Whelnoan Insurance District 15 office, resulting in additional operating costs of $7,120.
In the third year of operation, sales increased $13,800 or 13%. This yields an increase on the bottom line. In the third year of operations, Whelnoan Insurance subsidies are no longer available, resulting in a decrease in Miscellaneous revenue of $36,800 over the prior year. There are no significant changes in the third year of operations.
Brought to you by
Create a professional business plan
Using AI and step-by-step instructions
Create Your PlanSecure funding
Validate ideas
Build a strategy


| Pro Forma Profit and Loss | |||
| Year 1 | Year 2 | Year 3 | |
| Sales | $39,500 | $108,310 | $122,110 |
| Direct Cost of Sales | $27,900 | $63,000 | $70,900 |
| Other Costs of Sales | $0 | $0 | $0 |
| Total Cost of Sales | $27,900 | $63,000 | $70,900 |
| Gross Margin | $11,600 | $45,310 | $51,210 |
| Gross Margin % | 29.37% | 41.83% | 41.94% |
| Expenses | |||
| Payroll | $0 | $0 | $0 |
| Marketing/Promotion | $4,200 | $6,600 | $7,200 |
| Depreciation | $1,020 | $2,520 | $3,180 |
| Employee Benefits | $2,250 | $3,000 | $3,000 |
| Rent | $3,000 | $6,000 | $6,000 |
| Utilities | $600 | $1,500 | $1,500 |
| Telephone/DSL/Cell | $3,000 | $4,050 | $4,200 |
| Office Supplies | $900 | $1,650 | $2,150 |
| Professional Services | $250 | $500 | $500 |
| Training/Licensing | $290 | $250 | $0 |
| Insurance | $900 | $1,200 | $1,200 |
| Payroll Taxes | $0 | $0 | $0 |
| Miscellaneous | $1,200 | $1,200 | $1,200 |
| Total Operating Expenses | $17,610 | $28,470 | $30,130 |
| Profit Before Interest and Taxes | ($6,010) | $16,840 | $21,080 |
| EBITDA | ($4,990) | $19,360 | $24,260 |
| Interest Expense | $1,719 | $1,899 | $1,572 |
| Taxes Incurred | $0 | $2,988 | $3,902 |
| Net Profit | ($7,729) | $11,953 | $15,607 |
| Net Profit/Sales | -19.57% | 11.04% | 12.78% |
7.5 Projected Cash Flow
Due the fact that Quaestor is a new start-up company, the cash flow for FY2005 is somewhat exaggerated by the instant influx of new capital. Subsequent years however show a healthy growth in cash flow, mainly due to the 84-month repayment of the start-up loan and increased sales.

| Pro Forma Cash Flow | |||
| Year 1 | Year 2 | Year 3 | |
| Cash Received | |||
| Cash from Operations | |||
| Cash Sales | $33,575 | $92,064 | $103,794 |
| Subtotal Cash from Operations | $38,846 | $107,171 | $121,882 |
| Additional Cash Received | |||
| Sales Tax, VAT, HST/GST Received | $0 | $0 | $0 |
| New Current Borrowing | $0 | $0 | $0 |
| New Other Liabilities (interest-free) | $0 | $0 | $0 |
| New Long-term Liabilities | $10,000 | $0 | $0 |
| Sales of Other Current Assets | $0 | $0 | $0 |
| Sales of Long-term Assets | $0 | $0 | $0 |
| New Investment Received | $0 | $0 | $0 |
| Subtotal Cash Received | $48,846 | $107,171 | $121,882 |
| Expenditures | Year 1 | Year 2 | Year 3 |
| Expenditures from Operations | |||
| Cash Spending | $0 | $0 | $0 |
| Bill Payments | $42,322 | $90,012 | $102,544 |
| Subtotal Spent on Operations | $42,322 | $90,012 | $102,544 |
| Additional Cash Spent | |||
| Sales Tax, VAT, HST/GST Paid Out | $0 | $0 | $0 |
| Principal Repayment of Current Borrowing | $0 | $0 | $0 |
| Other Liabilities Principal Repayment | $0 | $0 | $0 |
| Long-term Liabilities Principal Repayment | $2,387 | $3,440 | $3,766 |
| Purchase Other Current Assets | $0 | $0 | $0 |
| Purchase Long-term Assets | $0 | $7,500 | $2,000 |
| Dividends | $0 | $0 | $0 |
| Subtotal Cash Spent | $44,709 | $100,952 | $108,310 |
| Net Cash Flow | $4,137 | $6,219 | $13,572 |
| Cash Balance | $16,137 | $22,356 | $35,928 |
7.6 Projected Balance Sheet
The table below presents the balance sheet for Quaestor Services. This table reflects a positive cash position throughout the period of this financial plan. The negative net worth is created in the first year due to the start-up costs showing as a negative retained earnings. As the balance sheet shows, Quaestor will not have any difficulty meeting their debt obligations as long as the conservative revenue projections are met.
| Pro Forma Balance Sheet | |||
| Year 1 | Year 2 | Year 3 | |
| Assets | |||
| Current Assets | |||
| Cash | $16,137 | $22,356 | $35,928 |
| Accounts Receivable | $654 | $1,793 | $2,022 |
| Other Current Assets | $0 | $0 | $0 |
| Total Current Assets | $16,791 | $24,149 | $37,950 |
| Long-term Assets | |||
| Long-term Assets | $3,000 | $10,500 | $12,500 |
| Accumulated Depreciation | $1,020 | $3,540 | $6,720 |
| Total Long-term Assets | $1,980 | $6,960 | $5,780 |
| Total Assets | $18,771 | $31,109 | $43,730 |
| Liabilities and Capital | Year 1 | Year 2 | Year 3 |
| Current Liabilities | |||
| Accounts Payable | $3,887 | $7,713 | $8,492 |
| Current Borrowing | $0 | $0 | $0 |
| Other Current Liabilities | $0 | $0 | $0 |
| Subtotal Current Liabilities | $3,887 | $7,713 | $8,492 |
| Long-term Liabilities | $22,613 | $19,173 | $15,407 |
| Total Liabilities | $26,500 | $26,886 | $23,899 |
| Paid-in Capital | $15,000 | $15,000 | $15,000 |
| Retained Earnings | ($15,000) | ($22,729) | ($10,776) |
| Earnings | ($7,729) | $11,953 | $15,607 |
| Total Capital | ($7,729) | $4,224 | $19,830 |
| Total Liabilities and Capital | $18,771 | $31,109 | $43,730 |
| Net Worth | ($7,729) | $4,224 | $19,830 |
7.7 Business Ratios
The table below presents common business ratios as a reference. Industry Profile comparisons are for Standard Industrial Classification code 6411.0000, Insurance Agents, Brokers and Service as the majority of our revenue comes from insurance sales. However, since the combined business of accounting/bookkeeping services and insurance sales does not fall underneath any predefined Industry dataset, the Industry ratios are not wholly accurate nor representative for Quaestor Services.
| Ratio Analysis | ||||
| Year 1 | Year 2 | Year 3 | Industry Profile | |
| Sales Growth | 0.00% | 174.20% | 12.74% | 8.23% |
| Percent of Total Assets | ||||
| Accounts Receivable | 3.48% | 5.76% | 4.62% | 24.10% |
| Other Current Assets | 0.00% | 0.00% | 0.00% | 69.87% |
| Total Current Assets | 89.45% | 77.63% | 86.78% | 94.00% |
| Long-term Assets | 10.55% | 22.37% | 13.22% | 6.00% |
| Total Assets | 100.00% | 100.00% | 100.00% | 100.00% |
| Current Liabilities | 20.71% | 24.79% | 19.42% | 36.78% |
| Long-term Liabilities | 120.47% | 61.63% | 35.23% | 9.58% |
| Total Liabilities | 141.17% | 86.42% | 54.65% | 46.36% |
| Net Worth | -41.17% | 13.58% | 45.35% | 53.64% |
| Percent of Sales | ||||
| Sales | 100.00% | 100.00% | 100.00% | 100.00% |
| Gross Margin | 29.37% | 41.83% | 41.94% | 100.00% |
| Selling, General & Administrative Expenses | 48.93% | 30.80% | 29.16% | 74.71% |
| Advertising Expenses | 0.00% | 0.00% | 0.00% | 0.48% |
| Profit Before Interest and Taxes | -15.22% | 15.55% | 17.26% | 5.37% |
| Main Ratios | ||||
| Current | 4.32 | 3.13 | 4.47 | 1.82 |
| Quick | 4.32 | 3.13 | 4.47 | 1.62 |
| Total Debt to Total Assets | 141.17% | 86.42% | 54.65% | 51.49% |
| Pre-tax Return on Net Worth | 100.00% | 353.74% | 98.38% | 7.25% |
| Pre-tax Return on Assets | -41.17% | 48.03% | 44.61% | 14.94% |
| Additional Ratios | Year 1 | Year 2 | Year 3 | |
| Net Profit Margin | -19.57% | 11.04% | 12.78% | n.a |
| Return on Equity | 0.00% | 282.99% | 78.70% | n.a |
| Activity Ratios | ||||
| Accounts Receivable Turnover | 9.06 | 9.06 | 9.06 | n.a |
| Collection Days | 29 | 27 | 38 | n.a |
| Accounts Payable Turnover | 11.89 | 12.17 | 12.17 | n.a |
| Payment Days | 27 | 23 | 29 | n.a |
| Total Asset Turnover | 2.10 | 3.48 | 2.79 | n.a |
| Debt Ratios | ||||
| Debt to Net Worth | 0.00 | 6.37 | 1.21 | n.a |
| Current Liab. to Liab. | 0.15 | 0.29 | 0.36 | n.a |
| Liquidity Ratios | ||||
| Net Working Capital | $12,904 | $16,437 | $29,457 | n.a |
| Interest Coverage | -3.50 | 8.87 | 13.41 | n.a |
| Additional Ratios | ||||
| Assets to Sales | 0.48 | 0.29 | 0.36 | n.a |
| Current Debt/Total Assets | 21% | 25% | 19% | n.a |
| Acid Test | 4.15 | 2.90 | 4.23 | n.a |
| Sales/Net Worth | 0.00 | 25.64 | 6.16 | n.a |
| Dividend Payout | 0.00 | 0.00 | 0.00 | n.a |
Appendix
| General Assumptions | |||||||||||||
| Month 1 | Month 2 | Month 3 | Month 4 | Month 5 | Month 6 | Month 7 | Month 8 | Month 9 | Month 10 | Month 11 | Month 12 | ||
| Plan Month | 1 | 2 | 3 | 4 | 5 | 6 | 7 | 8 | 9 | 10 | 11 | 12 | |
| Current Interest Rate | 9.09% | 9.09% | 9.09% | 9.09% | 9.09% | 9.09% | 9.09% | 9.09% | 9.09% | 9.09% | 9.09% | 9.09% | |
| Long-term Interest Rate | 9.09% | 9.09% | 9.09% | 9.09% | 9.09% | 9.09% | 9.09% | 9.09% | 9.09% | 9.09% | 9.09% | 9.09% | |
| Tax Rate | 20.00% | 20.00% | 20.00% | 20.00% | 20.00% | 20.00% | 20.00% | 20.00% | 20.00% | 20.00% | 20.00% | 20.00% | |
| Other | 0 | 0 | 0 | 0 | 0 | 0 | 0 | 0 | 0 | 0 | 0 | 0 | |
| Sales Forecast | |||||||||||||
| Month 1 | Month 2 | Month 3 | Month 4 | Month 5 | Month 6 | Month 7 | Month 8 | Month 9 | Month 10 | Month 11 | Month 12 | ||
| Sales | |||||||||||||
| Accounting Services | 0% | $0 | $0 | $500 | $500 | $500 | $500 | $1,000 | $1,000 | $1,000 | $1,000 | $1,000 | $1,000 |
| Insurance Sales | 0% | $290 | $1,255 | $1,290 | $1,325 | $1,355 | $1,415 | $1,550 | $1,760 | $1,790 | $1,855 | $1,855 | $1,885 |
| Miscellaneous | 0% | $0 | $0 | $0 | $1,500 | $1,500 | $1,500 | $1,500 | $1,500 | $1,500 | $1,625 | $1,625 | $1,625 |
| Total Sales | $290 | $1,255 | $1,790 | $3,325 | $3,355 | $3,415 | $4,050 | $4,260 | $4,290 | $4,480 | $4,480 | $4,510 | |
| Direct Cost of Sales | Month 1 | Month 2 | Month 3 | Month 4 | Month 5 | Month 6 | Month 7 | Month 8 | Month 9 | Month 10 | Month 11 | Month 12 | |
| Direct Cost of Sales (owner/agent salary) | $2,200 | $2,200 | $2,200 | $2,200 | $2,200 | $2,500 | $2,400 | $2,400 | $2,400 | $2,400 | $2,400 | $2,400 | |
| Other Cost of Sales | $0 | $0 | $0 | $0 | $0 | $0 | $0 | $0 | $0 | $0 | $0 | $0 | |
| Subtotal Direct Cost of Sales | $2,200 | $2,200 | $2,200 | $2,200 | $2,200 | $2,500 | $2,400 | $2,400 | $2,400 | $2,400 | $2,400 | $2,400 | |
| Pro Forma Profit and Loss | |||||||||||||
| Month 1 | Month 2 | Month 3 | Month 4 | Month 5 | Month 6 | Month 7 | Month 8 | Month 9 | Month 10 | Month 11 | Month 12 | ||
| Sales | $290 | $1,255 | $1,790 | $3,325 | $3,355 | $3,415 | $4,050 | $4,260 | $4,290 | $4,480 | $4,480 | $4,510 | |
| Direct Cost of Sales | $2,200 | $2,200 | $2,200 | $2,200 | $2,200 | $2,500 | $2,400 | $2,400 | $2,400 | $2,400 | $2,400 | $2,400 | |
| Other Costs of Sales | $0 | $0 | $0 | $0 | $0 | $0 | $0 | $0 | $0 | $0 | $0 | $0 | |
| Total Cost of Sales | $2,200 | $2,200 | $2,200 | $2,200 | $2,200 | $2,500 | $2,400 | $2,400 | $2,400 | $2,400 | $2,400 | $2,400 | |
| Gross Margin | ($1,910) | ($945) | ($410) | $1,125 | $1,155 | $915 | $1,650 | $1,860 | $1,890 | $2,080 | $2,080 | $2,110 | |
| Gross Margin % | -658.62% | -75.30% | -22.91% | 33.83% | 34.43% | 26.79% | 40.74% | 43.66% | 44.06% | 46.43% | 46.43% | 46.78% | |
| Expenses | |||||||||||||
| Payroll | $0 | $0 | $0 | $0 | $0 | $0 | $0 | $0 | $0 | $0 | $0 | $0 | |
| Marketing/Promotion | $350 | $350 | $350 | $350 | $350 | $350 | $350 | $350 | $350 | $350 | $350 | $350 | |
| Depreciation | $85 | $85 | $85 | $85 | $85 | $85 | $85 | $85 | $85 | $85 | $85 | $85 | |
| Employee Benefits | $0 | $0 | $0 | $250 | $250 | $250 | $250 | $250 | $250 | $250 | $250 | $250 | |
| Rent | $250 | $250 | $250 | $250 | $250 | $250 | $250 | $250 | $250 | $250 | $250 | $250 | |
| Utilities | $50 | $50 | $50 | $50 | $50 | $50 | $50 | $50 | $50 | $50 | $50 | $50 | |
| Telephone/DSL/Cell | $250 | $250 | $250 | $250 | $250 | $250 | $250 | $250 | $250 | $250 | $250 | $250 | |
| Office Supplies | $50 | $50 | $100 | $50 | $50 | $100 | $50 | $50 | $100 | $100 | $100 | $100 | |
| Professional Services | $0 | $0 | $0 | $0 | $250 | $0 | $0 | $0 | $0 | $0 | $0 | $0 | |
| Training/Licensing | $0 | $0 | $0 | $0 | $0 | $0 | $0 | $90 | $100 | $100 | $0 | $0 | |
| Insurance | $0 | $0 | $0 | $100 | $100 | $100 | $100 | $100 | $100 | $100 | $100 | $100 | |
| Payroll Taxes | 15% | $0 | $0 | $0 | $0 | $0 | $0 | $0 | $0 | $0 | $0 | $0 | $0 |
| Miscellaneous | $100 | $100 | $100 | $100 | $100 | $100 | $100 | $100 | $100 | $100 | $100 | $100 | |
| Total Operating Expenses | $1,135 | $1,135 | $1,185 | $1,485 | $1,735 | $1,535 | $1,485 | $1,575 | $1,635 | $1,635 | $1,535 | $1,535 | |
| Profit Before Interest and Taxes | ($3,045) | ($2,080) | ($1,595) | ($360) | ($580) | ($620) | $165 | $285 | $255 | $445 | $545 | $575 | |
| EBITDA | ($2,960) | ($1,995) | ($1,510) | ($275) | ($495) | ($535) | $250 | $370 | $340 | $530 | $630 | $660 | |
| Interest Expense | $113 | $112 | $111 | $110 | $109 | $108 | $181 | $179 | $177 | $175 | $173 | $171 | |
| Taxes Incurred | $0 | $0 | $0 | $0 | $0 | $0 | $0 | $0 | $0 | $0 | $0 | $0 | |
| Net Profit | ($3,158) | ($2,192) | ($1,706) | ($470) | ($689) | ($728) | ($16) | $106 | $78 | $270 | $372 | $404 | |
| Net Profit/Sales | -1088.83% | -174.63% | -95.29% | -14.13% | -20.53% | -21.31% | -0.40% | 2.48% | 1.81% | 6.02% | 8.30% | 8.95% | |
| Pro Forma Cash Flow | |||||||||||||
| Month 1 | Month 2 | Month 3 | Month 4 | Month 5 | Month 6 | Month 7 | Month 8 | Month 9 | Month 10 | Month 11 | Month 12 | ||
| Cash Received | |||||||||||||
| Cash from Operations | |||||||||||||
| Cash Sales | $247 | $1,067 | $1,522 | $2,826 | $2,852 | $2,903 | $3,443 | $3,621 | $3,647 | $3,808 | $3,808 | $3,834 | |
| Subtotal Cash from Operations | $248 | $1,115 | $1,712 | $3,102 | $3,351 | $3,406 | $3,958 | $4,230 | $4,286 | $4,452 | $4,480 | $4,506 | |
| Additional Cash Received | |||||||||||||
| Sales Tax, VAT, HST/GST Received | 0.00% | $0 | $0 | $0 | $0 | $0 | $0 | $0 | $0 | $0 | $0 | $0 | $0 |
| New Current Borrowing | $0 | $0 | $0 | $0 | $0 | $0 | $0 | $0 | $0 | $0 | $0 | $0 | |
| New Other Liabilities (interest-free) | $0 | $0 | $0 | $0 | $0 | $0 | $0 | $0 | $0 | $0 | $0 | $0 | |
| New Long-term Liabilities | $0 | $0 | $0 | $0 | $0 | $0 | $10,000 | $0 | $0 | $0 | $0 | $0 | |
| Sales of Other Current Assets | $0 | $0 | $0 | $0 | $0 | $0 | $0 | $0 | $0 | $0 | $0 | $0 | |
| Sales of Long-term Assets | $0 | $0 | $0 | $0 | $0 | $0 | $0 | $0 | $0 | $0 | $0 | $0 | |
| New Investment Received | $0 | $0 | $0 | $0 | $0 | $0 | $0 | $0 | $0 | $0 | $0 | $0 | |
| Subtotal Cash Received | $248 | $1,115 | $1,712 | $3,102 | $3,351 | $3,406 | $13,958 | $4,230 | $4,286 | $4,452 | $4,480 | $4,506 | |
| Expenditures | Month 1 | Month 2 | Month 3 | Month 4 | Month 5 | Month 6 | Month 7 | Month 8 | Month 9 | Month 10 | Month 11 | Month 12 | |
| Expenditures from Operations | |||||||||||||
| Cash Spending | $0 | $0 | $0 | $0 | $0 | $0 | $0 | $0 | $0 | $0 | $0 | $0 | |
| Bill Payments | $112 | $3,363 | $3,363 | $3,421 | $3,718 | $3,962 | $4,055 | $3,984 | $4,071 | $4,127 | $4,122 | $4,023 | |
| Subtotal Spent on Operations | $112 | $3,363 | $3,363 | $3,421 | $3,718 | $3,962 | $4,055 | $3,984 | $4,071 | $4,127 | $4,122 | $4,023 | |
| Additional Cash Spent | |||||||||||||
| Sales Tax, VAT, HST/GST Paid Out | $0 | $0 | $0 | $0 | $0 | $0 | $0 | $0 | $0 | $0 | $0 | $0 | |
| Principal Repayment of Current Borrowing | $0 | $0 | $0 | $0 | $0 | $0 | $0 | $0 | $0 | $0 | $0 | $0 | |
| Other Liabilities Principal Repayment | $0 | $0 | $0 | $0 | $0 | $0 | $0 | $0 | $0 | $0 | $0 | $0 | |
| Long-term Liabilities Principal Repayment | $129 | $129 | $130 | $131 | $132 | $133 | $263 | $263 | $266 | $268 | $270 | $273 | |
| Purchase Other Current Assets | $0 | $0 | $0 | $0 | $0 | $0 | $0 | $0 | $0 | $0 | $0 | $0 | |
| Purchase Long-term Assets | $0 | $0 | $0 | $0 | $0 | $0 | $0 | $0 | $0 | $0 | $0 | $0 | |
| Dividends | $0 | $0 | $0 | $0 | $0 | $0 | $0 | $0 | $0 | $0 | $0 | $0 | |
| Subtotal Cash Spent | $241 | $3,492 | $3,493 | $3,552 | $3,850 | $4,095 | $4,318 | $4,247 | $4,337 | $4,395 | $4,392 | $4,296 | |
| Net Cash Flow | $7 | ($2,377) | ($1,781) | ($449) | ($499) | ($689) | $9,640 | ($18) | ($52) | $57 | $88 | $209 | |
| Cash Balance | $12,007 | $9,630 | $7,850 | $7,400 | $6,901 | $6,212 | $15,852 | $15,834 | $15,783 | $15,840 | $15,928 | $16,137 | |
| Pro Forma Balance Sheet | |||||||||||||
| Month 1 | Month 2 | Month 3 | Month 4 | Month 5 | Month 6 | Month 7 | Month 8 | Month 9 | Month 10 | Month 11 | Month 12 | ||
| Assets | Starting Balances | ||||||||||||
| Current Assets | |||||||||||||
| Cash | $12,000 | $12,007 | $9,630 | $7,850 | $7,400 | $6,901 | $6,212 | $15,852 | $15,834 | $15,783 | $15,840 | $15,928 | $16,137 |
| Accounts Receivable | $0 | $42 | $182 | $260 | $482 | $486 | $495 | $587 | $618 | $622 | $650 | $650 | $654 |
| Other Current Assets | $0 | $0 | $0 | $0 | $0 | $0 | $0 | $0 | $0 | $0 | $0 | $0 | $0 |
| Total Current Assets | $12,000 | $12,049 | $9,812 | $8,109 | $7,882 | $7,387 | $6,708 | $16,439 | $16,452 | $16,405 | $16,489 | $16,577 | $16,791 |
| Long-term Assets | |||||||||||||
| Long-term Assets | $3,000 | $3,000 | $3,000 | $3,000 | $3,000 | $3,000 | $3,000 | $3,000 | $3,000 | $3,000 | $3,000 | $3,000 | $3,000 |
| Accumulated Depreciation | $0 | $85 | $170 | $255 | $340 | $425 | $510 | $595 | $680 | $765 | $850 | $935 | $1,020 |
| Total Long-term Assets | $3,000 | $2,915 | $2,830 | $2,745 | $2,660 | $2,575 | $2,490 | $2,405 | $2,320 | $2,235 | $2,150 | $2,065 | $1,980 |
| Total Assets | $15,000 | $14,964 | $12,642 | $10,854 | $10,542 | $9,962 | $9,198 | $18,844 | $18,772 | $18,640 | $18,639 | $18,642 | $18,771 |
| Liabilities and Capital | Month 1 | Month 2 | Month 3 | Month 4 | Month 5 | Month 6 | Month 7 | Month 8 | Month 9 | Month 10 | Month 11 | Month 12 | |
| Current Liabilities | |||||||||||||
| Accounts Payable | $0 | $3,251 | $3,250 | $3,297 | $3,586 | $3,827 | $3,922 | $3,849 | $3,934 | $3,990 | $3,988 | $3,889 | $3,887 |
| Current Borrowing | $0 | $0 | $0 | $0 | $0 | $0 | $0 | $0 | $0 | $0 | $0 | $0 | $0 |
| Other Current Liabilities | $0 | $0 | $0 | $0 | $0 | $0 | $0 | $0 | $0 | $0 | $0 | $0 | $0 |
| Subtotal Current Liabilities | $0 | $3,251 | $3,250 | $3,297 | $3,586 | $3,827 | $3,922 | $3,849 | $3,934 | $3,990 | $3,988 | $3,889 | $3,887 |
| Long-term Liabilities | $15,000 | $14,871 | $14,742 | $14,612 | $14,481 | $14,349 | $14,216 | $23,953 | $23,690 | $23,424 | $23,156 | $22,886 | $22,613 |
| Total Liabilities | $15,000 | $18,122 | $17,992 | $17,909 | $18,067 | $18,176 | $18,138 | $27,802 | $27,624 | $27,414 | $27,144 | $26,775 | $26,500 |
| Paid-in Capital | $15,000 | $15,000 | $15,000 | $15,000 | $15,000 | $15,000 | $15,000 | $15,000 | $15,000 | $15,000 | $15,000 | $15,000 | $15,000 |
| Retained Earnings | ($15,000) | ($15,000) | ($15,000) | ($15,000) | ($15,000) | ($15,000) | ($15,000) | ($15,000) | ($15,000) | ($15,000) | ($15,000) | ($15,000) | ($15,000) |
| Earnings | $0 | ($3,158) | ($5,349) | ($7,055) | ($7,525) | ($8,213) | ($8,941) | ($8,957) | ($8,852) | ($8,774) | ($8,504) | ($8,133) | ($7,729) |
| Total Capital | $0 | ($3,158) | ($5,349) | ($7,055) | ($7,525) | ($8,213) | ($8,941) | ($8,957) | ($8,852) | ($8,774) | ($8,504) | ($8,133) | ($7,729) |
| Total Liabilities and Capital | $15,000 | $14,964 | $12,642 | $10,854 | $10,542 | $9,962 | $9,198 | $18,844 | $18,772 | $18,640 | $18,639 | $18,642 | $18,771 |
| Net Worth | $0 | ($3,158) | ($5,349) | ($7,055) | ($7,525) | ($8,213) | ($8,941) | ($8,957) | ($8,852) | ($8,774) | ($8,504) | ($8,133) | ($7,729) |


