
SoulSpace
Executive Summary
SoulSpace aims to be the premier spa/salon in the Raleigh, NC area. Through a unique combination of offered services and products, they will quickly gain market share. SoulSpace will provide customers with a relaxing, rejuvenating atmosphere where all of their mind and body needs can be met. The business will be set up as a partnership with Steve Long, Debby Long, and Linda Hill-Chinn owning equal portions of the operation.
Products and Services
SoulSpace offers a wide variety of mind and body healing services and products. The salon aspect of the business will provide both males and females with any type of hair styling services. The spa business is devoted to providing holistic methods of massage, body work, and energy work. This is all done in a relaxing, serene setting.
Location
SoulSpace has chosen Raleigh, NC as their city for the business venture. Raleigh has consistently over the last few years been voted the best place to work and live in the USA, frequently making the top five and ten lists of Forbes, Money, and Inc. magazines. Raleigh has one of the most educated populations that loosely correlates to earning potential, or at least indicates a higher average household income. Additionally, the downtown area has undergone a recent renovation that has attracted a lot of new businesses as well as become a hot urban area.
Competitive Edge
SoulSpace’s competitive edge is their unique combination of services, location, and customer-centric focus. Both the extraordinary services and location has been detailed previously. SoulSpace has set out since its inception to provide quality, dependable services. SoulSpace has an innovative training program that is extensive in its depth, properly training employees to provide an unprecedented level of customer service. All customers will leave SoulSpace with a feeling that their needs were met well beyond any expectations that they previously had and far better than any competitor. This customer-centric business model is not just rhetoric, there are financial incentives in place for employees to offer unprecedented levels of service. This will ensure a high rate of return customers, allowing SoulSpace to meet their ambitious goal of 90%.
Financials
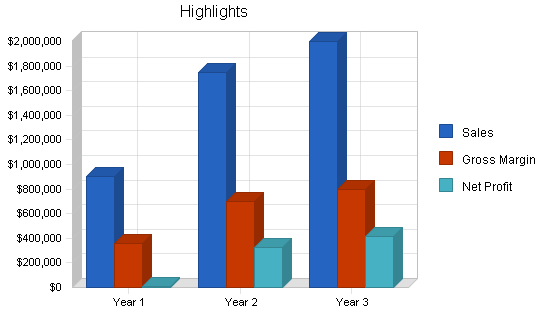
SoulSpace has forecasted substantial sales revenues by year two. Also by year two the business will reach profitability and have achieved a healthy profit before taxes. When SoulSpace begins their fundraising efforts they will consider options such as LLC status to replace the partnership business formation that they have currently adopted.
SoulSpace is an exciting business that provides a combination of sought after services that are not currently offered by a direct competitor. SoulSpace will provide a relaxing, serene setting for a variety of mind and body rejuvenation services for the booming Raleigh population.
1.1 Objectives
The objectives for SoulSpace are outlined below:
- Substantial sales revenue by end of second year.
- Profit before tax by end of second year.
- Have clientele return rate of 90% by end of first year.
- Become established community destination by end of first year.
1.2 Mission
SoulSpace will provide a comforting, yet stimulating, atmosphere in which customers will be able to relax both their body and mind, reconnecting their daily lives to their true purpose through a wide range of holistic methods including massage, body works, energy works, and hair styling. SoulSpace will establish itself as a dependable destination to which they can always come to escape the stresses of life, and rejuvenate their energies, their souls, and their lives.
1.3 Keys to Success
- Quality and skilled employees familiar with energy work and oriented to a soothing spiritual disposition.
- Establish trust within the community that each customer’s needs will be taken care of during every visit.
- Easily accessible location.
- Effective advertising.
Company Summary
SoulSpace Holistic Spa and Salon is a new destination offering customers the unique combination of hair styling, massage, body and energy work, and training, all in one beautifully serene setting. Soulspace will offer all ranges of hair styling, therapeutic massage, manicure, facial, sauna, Reiki, therapeutic touch, and specific complimentary product offerings. The goal and promise of SoulSpace can be summed up in our name and slogan: SoulSpace Holistic Spa and Salon–Rejuvenate Your Life!
2.1 Company Ownership
SoulSpace, at this time, is a privately held partnership, owned by Steve and Debby Long and Linda Hill-Chinn. In the course of fund raising, we will explore the feasibility of both a partnership, and a limited liability partnership.
2.2 Start-up Summary
In the following table, the start-up cash has been marked for the estimated amount needed to cover operational expenses for the first two months.

| Start-up Funding | |
| Start-up Expenses to Fund | $94,000 |
| Start-up Assets to Fund | $66,000 |
| Total Funding Required | $160,000 |
| Assets | |
| Non-cash Assets from Start-up | $6,000 |
| Cash Requirements from Start-up | $60,000 |
| Additional Cash Raised | $0 |
| Cash Balance on Starting Date | $60,000 |
| Total Assets | $66,000 |
| Liabilities and Capital | |
| Liabilities | |
| Current Borrowing | $0 |
| Long-term Liabilities | $0 |
| Accounts Payable (Outstanding Bills) | $0 |
| Other Current Liabilities (interest-free) | $0 |
| Total Liabilities | $0 |
| Capital | |
| Planned Investment | |
| Investor 1 | $66,000 |
| Investor 2 | $47,000 |
| Investor 3 | $47,000 |
| Additional Investment Requirement | $0 |
| Total Planned Investment | $160,000 |
| Loss at Start-up (Start-up Expenses) | ($94,000) |
| Total Capital | $66,000 |
| Total Capital and Liabilities | $66,000 |
| Total Funding | $160,000 |
| Start-up | |
| Requirements | |
| Start-up Expenses | |
| Legal | $4,000 |
| Stationery etc. | $2,000 |
| Brochures | $3,000 |
| Construction/Design | $30,000 |
| Insurance | $3,000 |
| Rent | $20,000 |
| Research and Development | $0 |
| Expensed Equipment | $15,000 |
| Other | $17,000 |
| Total Start-up Expenses | $94,000 |
| Start-up Assets | |
| Cash Required | $60,000 |
| Start-up Inventory | $6,000 |
| Other Current Assets | $0 |
| Long-term Assets | $0 |
| Total Assets | $66,000 |
| Total Requirements | $160,000 |
2.3 Company Locations and Facilities
Target sites for SoulSpace include downtown Raleigh in the Warehouse District and Art Districts, West Raleigh near Entertainment Sports Arena, and a rural area off route 40/440 between Raleigh and Cary. SoulSpace will need at least 4,000 square feet (sq. ft.) of space. Initial estimates put leasing between $12/sq. ft. to $28/sq. ft. (inclusive of tax and accommodations).
Contact has been made with Mary Hobbson of Grub & Ellis Real Estate for 4,200 sq. ft. at 510 Glenwood Avenue downtown Raleigh. This site is within the target priority area in part of the Warehouse District in what is now referred to as Glenwood South. The lease is $28/sq. ft., making estimated payments at $9,800/month, the most expensive of all target sites.
We also have met with Peter Pace of York Properties when shown the space available at 200 West Street in Raleigh’s Warehouse district. This space is in priority target range, and will be two blocks from the Raleigh Commuter Rail Hub due to open in the next five to eight years. The location is spacious at 10,000 sq. ft., with first floor (5,000 sq. ft.) leasing at $12.50/sq. ft. and the basement floor (5,000 sq. ft.) leasing at $8/sq. ft., which averages out to $10.25/sq. ft. for the entire 10,000 sq. ft. location. This makes this space cheaper than the other locations, and has twice the space.
We have also met with David Stowe of Anthony Allenton Real Estate when shown space at the Royal Bakery on Hillsborough Street across from Meredith College. This location is within priority target, and has 6,000 sq. ft. at $20.60/sq. ft. This site is extremely attractive for it offers many accommodations such as plumbing, electrical, and hvac, that will save us tremendously on construction costs, thusly counterbalancing the expense of rent, which is only $300, over our high-ended estimated budget. Also, this space is primely located on Hillsborough, 1/4 mile from the Beltine, and two miles from Highway 40. It is also the site of a future Commuter Rail Station. They have also built a large parking decking which will be free to all patrons.
Brought to you by
Create a professional business plan
Using AI and step-by-step instructions
Create Your PlanSecure funding
Validate ideas
Build a strategy
Products and Services
SoulSpace will provide customers with personal beautifying and relaxational services and complimenting products, as well as training in specific forms of energy work, accessible materials on a wide range of health-related topics, and the option to purchase artwork displayed in SoulSpace. Explanations and/or consultations will be provided on all services and products if needed.
3.1 Product and Service Description
- Men and Women Hair Styling: Men’s ($30 average) and women’s ($40 average) color ($75), perm ($80), and combos ($80-$120). Selected hair care products (shampoos, conditioners, cleansers, brushes, mirrors) will be sold as well.
- Body Works: Massage ($60), other massage/body works ($65 average), facials ($60 average), manicures ($45), pedicures ($50-$65), waxing ($20 average), aromatherapy ($40), and combos ($60-$200 depending). Specific complementing products will be sold as well.
- Energy Works: Reiki (1/2 hour $35, 1 hour $60), energy revitalization (1 hour $60), and therapeutic touch (1 hour $60). Customers will include people wishing to strengthen their physical body, mind, and spirit through the cleaning and revitalizing of their energetic system (i.e., aura, human energy field). The Reiki offered will be traditional Usui Shiki Ryoho, the predominant form of Reiki practiced worldwide, which originated in Japan from it’s rediscoverer Dr. Mikao Usui. Reiki is a hands-on “stepping” method of balancing the energy field. Energy revitalization and therapeutic touch are energy field cleansing and revitalizing techniques working with the outer levels of the energy field along with Reiki.
- Artwork: Most of the artwork in SoulSpace will be by local artists, for sale to the customers. SoulSpace will earn a 15% commission on each piece sold. This adds an extra element of community integration to SoulSpace with an added emphasis of the art being from beginning artists, and that the art be spiritual and/or modern in form.
3.2 Competitive Comparison
There are many salons in the greater Raleigh area but no direct competitors. There are many places offering massage, but there are only ten day spas, of which only four are a spa/salon. There is one place offering energy work, in Clayton (30 minutes southeast from downtown Raleigh). All energy work practitioners are private, of which there are only ten working full-time, with most of them concentrating on other alternative modalities, and an estimated ten (twenty at the very most) part-time energy practitioners. Not including Chapel Hill and Durham, the above service an estimated population of at least 800,000, with that figure growing by an estimated 6,000 persons daily.
3.3 Sales Literature
Services brochure, logo/slogan with advertising to be included, and a planned website.
3.4 Fulfillment
SoulSpace services sell themselves as a natural way to rejuvenate one’s life.
3.5 Technology
SoulSpace will sell complementing products of the highest quality that have not been created through the testing of animals, and are of the latest scientific knowing for effecting the desired results for body beautification and energetic balancing maintenance.
3.6 Future Products and Services
SoulSpace will add healing touch when Steve Long earns his certification. SoulSpace will always remain involved with the best spa relaxational techniques offered, and will implement them if deemed appropriate and feasible for SoulSpace clientele.
Market Analysis Summary
There are no exact competitors, and few related competitors in the greater Raleigh area. There are no related competitors in the downtown Raleigh area. The space at 510 Glenwood was recommended to us by the managing realtors because they had targeted that space for a spa type tenant. By nature of the service SoulSpace will provide, success will be readily achieved.
4.1 Market Segmentation
Our target market will be divided by salon customers and spa customers. Salon customers will be from every age and gender; however, since the salon and spa will be in direct association with each other, we expect that the spa market segment will greatly affect the salon market segment. Thusly, our target market segment will be male and female professionals and retirees, from the age of 25, with individual and household incomes greater than $25,000.

| Market Analysis | |||||||
| Year 1 | Year 2 | Year 3 | Year 4 | Year 5 | |||
| Potential Customers | Growth | CAGR | |||||
| +$25K 5 mi. Radius Raleigh | 2% | 50,500 | 51,510 | 52,540 | 53,591 | 54,663 | 2.00% |
| +$25K 5 mi. Radius West Raleigh | 2% | 53,000 | 54,060 | 55,141 | 56,244 | 57,369 | 2.00% |
| Total | 2.00% | 103,500 | 105,570 | 107,681 | 109,835 | 112,032 | 2.00% |
4.2 Target Market Segment Strategy
The members of these market segments have luxury money on hand, and lead professional lives filled with stress at a consistent level. All persons usually need hair styling regardless of income level, and make the effort to find the money available to style their “look.”
4.2.1 Market Needs
People love to pamper themselves, especially people who have achieved a modicum level of professional success. Raleigh has become a bastion for the successful, having consistently been named as one of the best cities in America to live and to do business in since the mid 1990’s. This has created a community of wealth, mobility, and growth. Raleigh has successfully implemented a refurbishing plan of “old” downtown, which now makes Glenwood South, the Warehouse District, and Hillsborough Street one of the most popular destinations in the whole city.
4.2.2 Market Trends
With the refurbishment of Raleigh’s Warehouse District, including Glenwood South, and it’s continual development of downtown Raleigh, this area will only become more popular.
4.2.3 Market Growth
When Forbes, Inc., and Money, Inc. listed Raleigh as the best place to live and do business, and subsequently listed Raleigh in the top five and top ten in the following years, a population boom ensued in the late 1990’s.The North Carolina census released in October 2000 reports that an average of 6,000 persons per day were relocating to the greater Raleigh area. According to this census, the Triangle has one of the highest concentrations of Ph.D.’s per square mile in the world. The average income per household is $40,000-$60,000 and climbing.
According to the Raleigh News & Observer reports of Raleigh City Counsel meetings concerning growth, the continuing refurbishment of downtown Raleigh is a top priority, along with a complete overhaul of the mass transit system. New buses and taxis are funded and are to be implemented during the next two years. A Commuter Rail System run by the Triangle Transit Authority is supposed to be finalized May 1, 2001, and completed by 2007-2008, with rail stations throughout downtown, running up Hillsborough Street going to RDU Airport then connecting to Chapel Hill and Durham; later phases include branch rails to North Raleigh. The refurbishment plan continues, and downtown is now populated with more destinations than ever, with the plan growing even more businesses. The future looks very promising for a thriving downtown with a continual presence of customers.
4.3 Service Business Analysis
We are part of the retail health and beauty industry which has four major types:
- Salons: Stores with only hair styling services and products.
- Day Spas: Stores specializing in body health maintenance through a variety of services and products.
- Day Spa & Salon: Stores combining the services of the two aforementioned.
- Health & Beauty Products: Stores selling only merchandise products covering the wide range of products available but not inclusive of those sold by salons and spas.
4.3.1 Main Competitors
The main competitors are Salon 21 with a location in downtown Raleigh, Von Kekel with locations in East Cary and North Raleigh, Soigne’ with a location in mid North Raleigh, Emerald City with a location in Northwest Raleigh, Image with a location in far North Raleigh, Millennium 2000 with a location in North Raleigh, Devine with a location in mid North Raleigh, and Warren Scott with a location in far North Raleigh. Also, by nature of their popularity we must also include these spas as main competition: Skin Sense with locations in downtown Cary and far North Raleigh, and Iatria in far North Raleigh.
Brought to you by
Create a professional business plan
Using AI and step-by-step instructions
Create Your PlanSecure funding
Validate ideas
Build a strategy
Strengths of the above are services offered: location proximity to major housing developments, and name recognition. The weaknesses of these competitors are general lack of promotion, concentration mainly in North Raleigh.
With our target location being downtown Raleigh, we will be servicing East, South, West, and Old Raleigh, as well as downtown commuters. There are no salon-spas in West Raleigh, the closest being Von Kekel in East Cary, and the spa only Skin Sense also in Cary. The only downtown competitor, Salon 21, is very small, not very well known, and concentrates most of their business on the salon end.
Our market advantage is wide open, and will give us the opportunity to service a large population base that is not currently being well served. When you include our service of energy works, we become the sole provider of all three services of hair works, body works, and energy works not only in downtown Raleigh, but for the entire greater Raleigh area.
4.3.2 Business Participants
Industry participants are those whose services include salon and spa offerings. Salon services concern hair styling, while spa services concern body relaxing and rejuvenating offerings such as massage, and nail and face works.
4.3.3 Competition and Buying Patterns
Customers choose spa and salon services based on proximity to their daily travels from home and work, reputation for quality, and good pricing. With our combined services, we expect to compete mainly against other combination spa-salons.
Strategy and Implementation Summary
- Emphasize quality, originality, and dependability of service. We will differentiate ourselves from our competitors by offering a staff of practitioners who are not only certified in their professions, but will be trained in understanding the dynamics of individual energy systems so as to maximize the connection to their client and more easily meet the needs of the client.
- We will provide a unique atmosphere. From the name to the ambience of our salon, SoulSpace will distinguish itself as a completely trustworthy and soothing setting where customers can enjoy being pampered and escape the stress of their everyday lives.
- Build a community relationship-oriented business. We will focus on strengthening the trust of our customer base, and providing not only services, but information that will aid everyone in the progression of obtaining a balanced and healthy lifestyle. We will also work with local artists to provide their work to inspire our customers.
5.1 Value Proposition
Our value proposition is that we will bring a unique mode of relaxation and fulfillment to our community. When people are relaxed, comfortable, and happy, they have the ability to work harder, concentrate better, feel physically, emotionally, and mentally balanced, and give that happiness back into their homes, workplaces, and community. Simply put, our value proposition is that we help our community become a better place to live and work.
5.2 Competitive Edge
Our competitive edge is a combination of our unique services, outstanding location, and our interaction with customers. By providing our customers a holistic and integrative spa and salon, we build relationships of trust and satisfaction. Our customers will come to depend on our unique services and fulfilling environment.
5.3 Marketing Strategy
Our marketing strategy is the key to our success:
- Emphasize our name and unique services through advertising.
- Focus on the convenience of our location.
- Build community relationships through unique and quality service, friendly and caring atmosphere, and establishing absolute dependability of our services.
5.3.1 Promotion Strategy
Our promotional strategy will be two-fold: first phase promotion will deal with advertising before, during, and six months following our opening; the second phase advertising will deal with all long-term advertising.
1. FIRST PHASE PROMOTIONS
A. Advertising
We will utilize local newspaper, local social and health magazines, local radio, local television, mail-outs to all households within the immediate five mile radius, and mail-outs to all local business within a five-mile radius.B. Internet
We will have a comprehensive website.C. Alliances
We will place our brochures within the offices of our medical referral clients.
2. SECOND PHASE PROMOTIONS
A. Advertising
We will continue to place ads in the local social and health magazines year around. Mail-outs will be done again within a five-mile radius one year later after opening, then again only every three to five years. Radio and television ads will be done only when we have sale promotions during the most stressful times of the year for the Christmas season, and graduation; television ads are not certain, we will evaluate their effectiveness before further implementation.B. Internet
We will continue to have a comprehensive website. After the first six months, and certainly after the first year, we will evaluate the viability of having target clients advertise on our site, and conversely, we will evaluate viability of advertising on our target clients websites (if applicable).C. Alliances
This type of advertising will be implemented once we have grown beyond our break-even point. We will also form advertising alliances with any business with whom we share common business goals. We will also implement mutual perks with our business and restaurant neighbors which will aid in local visibility. Advertising promotions with certain restaurants will also be considered.
5.3.2 Marketing Programs
Owner Steve Long will be responsible for marketing SoulSpace through the advertising channels. The general manager will be responsible for assisting with the implementation of alliance advertising partnerships. Our advertising budget is $10,000 for the first year. Advertising will begin one week prior to opening.
5.3.3 Positioning Statement
We will automatically position ourselves as one of the top spa-salons in the greater Raleigh area. Considering that none of the other competitors will offer the range of services we will, or that their staffs will be trained like ours, and that there are not any spa-salons of our type in our target locations, we will be able to provide services to a portion of Raleigh populace not currently being tapped.
5.3.4 Pricing Strategy
Our pricing strategy will be similar to that of our competitors. We will not charge over, nor substantially under, standard prices for our services. We will be paying our employees a higher straight percentage of their total individual customer sales than our competitors. This will allow us to hire the best employees, and have a built-in motivational factor that will keep them working hard and happily.
5.4 Sales Strategy
- Our umbrella sales strategy is to sell SoulSpace to public consumers as a uniquely desirable destination that will enhance their lives.
- We will sell SoulSpace through each employee’s skill, courtesy, and warmth, creating a trusting impression on all customers, thusly establishing loyalty and return. We will ensure each visit to SoulSpace is a relaxing and memorable experience, so that customers can always depend on our brand of service when they arrive.
5.4.1 Sales Forecast
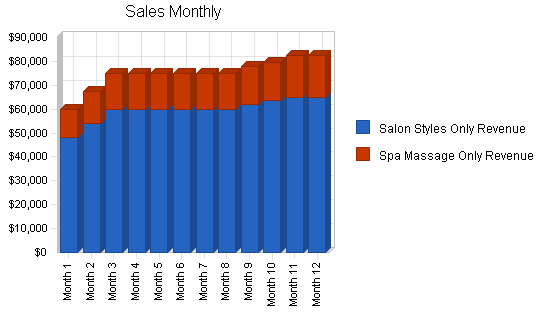
The important elements of the Sales Forecast are shown in the chart and table below. Initial sales forecasts indicate vigorous first year sales, almost doubling by the end of second year, then leveling out somewhat by the end of third year. These figures are based only on revenue from minimum average estimates from salon stylings and spa massages only, with sales cost reflective of the 60% commission earnings to each stylist/therapist.
Brought to you by
Create a professional business plan
Using AI and step-by-step instructions
Create Your PlanSecure funding
Validate ideas
Build a strategy

| Sales Forecast | |||
| Year 1 | Year 2 | Year 3 | |
| Sales | |||
| Salon Styles Only Revenue | $717,500 | $1,400,000 | $1,600,000 |
| Spa Massage Only Revenue | $182,500 | $350,000 | $400,000 |
| Total Sales | $900,000 | $1,750,000 | $2,000,000 |
| Direct Cost of Sales | Year 1 | Year 2 | Year 3 |
| Salon Styles Only Revenue | $429,300 | $840,000 | $960,000 |
| Spa Massage Only Revenue | $109,500 | $210,000 | $240,000 |
| Subtotal Direct Cost of Sales | $538,800 | $1,050,000 | $1,200,000 |
5.4.2 Sales Programs
- Our comprehensive brochure will explain the holistic nature of our services, and how this benefits the customer.
- Our website will be comprehensively informative of our services and their benefits.
5.5 Strategic Alliances
We will form alliances with our referral practitioners, local restaurants, offices, and businesses who will be strategically beneficial for generating new customers; we will also form alliances with local certified massage schools and hair styling schools.
5.6 Milestones
The following table lists important store milestones, with dates, implementation duty, and budgets for each. The milestone schedule emphasizes the timeliness for implementation per the sales and marketing targets listed in detail in the previous topics.

| Milestones | |||||
| Milestone | Start Date | End Date | Budget | Manager | Department |
| Business Plan | 1/15/2001 | 2/1/2001 | $0 | Steve | Owner |
| Financial Backing | 2/1/2001 | 2/5/2001 | $200,000 | Steve | Owner |
| Design Contractor Retainer | 2/5/2001 | 5/1/2001 | $5,000 | Steve | Owner |
| Construction Contractor Retainer | 2/5/2001 | 5/1/2001 | $20,000 | Steve | Owner |
| Lease Agreement | 1/17/2001 | 2/12/2001 | $20,000 | Steve | Owner |
| Logo Design | 2/12/2001 | 3/1/2001 | $1,000 | Steve | Owner |
| Business Cards (Initial) | 2/19/2001 | 3/1/2001 | $300 | Steve | Owner |
| Brochures | 3/1/2001 | 5/1/2001 | $3,000 | Steve | Owner |
| Grand Opening | 5/1/2001 | 6/1/2001 | $0 | Steve | Owner |
| Seven Customers Per Stylist/Therapist | 8/1/2001 | 9/1/2001 | $0 | Steve | Owner |
| Totals | $249,300 | ||||
Management Summary
The management philosophy of SoulSpace is based on respect for each of our fellow employees, respect for every customer, and individual responsibility. SoulSpace’s success is dependent on the warmth and uniqueness of its atmosphere which is generated by a fun-loving and caring employee. The management team will consist of the owner, general manager, and assistant manager (if deemed necessary). We will hire only those whom demonstrate the qualities necessary for working in a nurturing environment, and the willingness to move forward in study of energetic principals if not already so trained. We will be hiring the ultimate “people persons.”
6.1 Organizational Structure
Our initial team consists of 14 employees, inclusive of a general manager and an assistant manager, both of whom will be active stylists/therapists.
Employees will be in from the two store divisions of spa and salon. On the salon side there will be 10 stylists and one or two receptionists. There will be room for expansion to 12-15 stylists and three receptionists. The spa side will consist of three massage therapists, one energy therapist, one nail specialist, and one receptionist. There will be room for expansion to five to seven massage therapists, and two to three energy therapists.
6.2 Management Team
Steven J. Long, co-owner, president: Founded SoulSpace in 2001. He has a degree in psychology from NC State, a concentration in industrial/organizational with emphasis on communication. He has been a Reiki Master Usui Shiki Ryoho since 1996 and operates part-time healing practice from home. He has eight years management experience, six in retail, two in electronic component rep field for distribution. Mr. Long spent three years in the modeling industry, one as model and two as the manager of an agency in Raleigh in 1991.
Deborah L. Long, co-owner: Debby will not be directly involved in daily operations, but will assist Steve in general organizational planning and vision implementation. Debby currently is the number one co-location sales manager for SpectraSite, Inc. where she has worked for two years. She spent several years as an executive assistant at TDK of America’s Distribution Sales Center in Chicago, and at Cotton Incorporated. She is a level two Usui Shiki Ryoho.
Linda Hill-Chinn, co-owner, CFO: Linda is retired after having spent 15 years as senior national staffing specialist for the American Hospital Association in Chicago, as well as serving on their board of directors for several national projects. She also spent several years managing Planned Parenthood of Chicago. Linda holds a Masters of sociology from Brown University.
Jennifer McElravey, general manager: For the past nine years, Jennifer has been one of the top stylist for Mitchell’s Hair Design of Raleigh and is currently a level five stylist, Salon Designer of the Year ’94-97, and received extra training at Vidal Sassoon of London, Highest Salon Retail Sales four different years. Jennifer is also a level two Usui Shiki Ryoho.
6.3 Management Team Gaps
We believe the experience of our team covers the needs to make the business plan for SoulSpace a very successful reality. The assistant manager is not named here because that position will be named from the pool of stylists/therapists that will be hired previous to our opening.
6.4 Personnel Plan
The Personnel Plan below reflects our projected need at opening, and carries through the second year expansions.
| Personnel Plan | |||
| Year 1 | Year 2 | Year 3 | |
| Steve Long, Owner, President | $65,040 | $65,040 | $65,040 |
| General Manager | $60,000 | $60,000 | $60,000 |
| %100 Commissioned Employees | $150 | $156 | $156 |
| Receptionist | $15,360 | $15,360 | $15,360 |
| Receptionist | $15,360 | $30,620 | $30,620 |
| Total People | 17 | 18 | 18 |
| Total Payroll | $155,910 | $171,176 | $171,176 |
Financial Plan
The premier element in our financial plan is initiating, maintaining, and improving the factors that create, stabilize, and increase our cash flow:
- We must create visibility so as to create customer flow.
- We must maintain a dependable, happy employee force so as to minimize turnover.
- Create a brisk turnaround on our retail and art products, always maintaining viable stock levels.
7.1 Important Assumptions
The key underlying assumptions of our financial plan shown in the following general assumptions table are:
- We assume access to equity capital and financing to support our financial plan.
- We assume our financial progress based on realistic sales to minimum sales against highest expenses.
- We assume there will not be an economic crash that would greatly hinder our target market’s access to their personal luxury funds.
| General Assumptions | |||
| Year 1 | Year 2 | Year 3 | |
| Plan Month | 1 | 2 | 3 |
| Current Interest Rate | 10.00% | 10.00% | 10.00% |
| Long-term Interest Rate | 10.00% | 10.00% | 10.00% |
| Tax Rate | 2.50% | 0.00% | 2.50% |
| Other | 0 | 0 | 0 |
7.2 Key Financial Indicators
Our most important Key Financial Indicator is when each stylist averages seven customers per day and each therapist averages three customers per day.

7.3 Break-even Analysis
For our Break-even Analysis we assume estimated monthly operational costs which include payroll, rent, utilities, and other running costs (not including employee draw fund considerations). Payroll alone is only estimated to about 1/2 of those costs.
The analysis shows what we need to generate in revenues per month to break even. This total is 13% less than estimated monthly store gross. This estimation does not include revenue from any other store sources, and is based on a salon customer average of $36 and spa customer average of $60.
Our average per customer revenue is estimated at $39. Considering our minimal assumptions show a monthly total customer average of 1,922, we therefore believe our break-even figures can be readily maintained.

| Break-even Analysis | |
| Monthly Revenue Break-even | $73,567 |
| Assumptions: | |
| Average Percent Variable Cost | 60% |
| Estimated Monthly Fixed Cost | $29,525 |
7.4 Projected Profit and Loss
There are two important assumptions with our Projected Profit and Loss statement:
- We expect to have to pay out from the Draw Fund occasionally.
- Our revenue is based on minimum estimated averages against highest expense expectations.


| Pro Forma Profit and Loss | |||
| Year 1 | Year 2 | Year 3 | |
| Sales | $900,000 | $1,750,000 | $2,000,000 |
| Direct Cost of Sales | $538,800 | $1,050,000 | $1,200,000 |
| Other | $0 | $0 | $0 |
| Total Cost of Sales | $538,800 | $1,050,000 | $1,200,000 |
| Gross Margin | $361,200 | $700,000 | $800,000 |
| Gross Margin % | 40.13% | 40.00% | 40.00% |
| Expenses | |||
| Payroll | $155,910 | $171,176 | $171,176 |
| Sales and Marketing and Other Expenses | $34,000 | $39,000 | $41,000 |
| Depreciation | $0 | $0 | $0 |
| Rent | $120,000 | $120,000 | $120,000 |
| Leased Equipment | $0 | $0 | $0 |
| Utilities | $9,000 | $9,000 | $9,000 |
| Insurance | $12,000 | $12,000 | $12,000 |
| Payroll Taxes | $23,387 | $25,676 | $25,676 |
| Other | $0 | $0 | $0 |
| Total Operating Expenses | $354,297 | $376,852 | $378,852 |
| Profit Before Interest and Taxes | $6,904 | $323,148 | $421,148 |
| EBITDA | $6,904 | $323,148 | $421,148 |
| Interest Expense | $0 | $0 | $0 |
| Taxes Incurred | ($2,907) | $0 | $10,529 |
| Net Profit | $9,810 | $323,148 | $410,619 |
| Net Profit/Sales | 1.09% | 18.47% | 20.53% |
7.5 Projected Cash Flow
Considering our business is a luxury, retail-oriented business with customers who will pay primarily with credit cards, our cash flow is not dependant on the issuance of invoices and the vagaries of Accounts Payable. We will need a minimum of financing to cover the cash flows of the first year of operations. After that, the cash flow becomes continual.

| Pro Forma Cash Flow | |||
| Year 1 | Year 2 | Year 3 | |
| Cash Received | |||
| Cash from Operations | |||
| Cash Sales | $900,000 | $1,750,000 | $2,000,000 |
| Subtotal Cash from Operations | $900,000 | $1,750,000 | $2,000,000 |
| Additional Cash Received | |||
| Sales Tax, VAT, HST/GST Received | $0 | $0 | $0 |
| New Current Borrowing | $0 | $0 | $0 |
| New Other Liabilities (interest-free) | $0 | $0 | $0 |
| New Long-term Liabilities | $0 | $0 | $0 |
| Sales of Other Current Assets | $0 | $0 | $0 |
| Sales of Long-term Assets | $0 | $0 | $0 |
| New Investment Received | $0 | $0 | $0 |
| Subtotal Cash Received | $900,000 | $1,750,000 | $2,000,000 |
| Expenditures | Year 1 | Year 2 | Year 3 |
| Expenditures from Operations | |||
| Cash Spending | $155,910 | $171,176 | $171,176 |
| Bill Payments | $719,414 | $1,263,200 | $1,423,005 |
| Subtotal Spent on Operations | $875,324 | $1,434,376 | $1,594,181 |
| Additional Cash Spent | |||
| Sales Tax, VAT, HST/GST Paid Out | $0 | $0 | $0 |
| Principal Repayment of Current Borrowing | $0 | $0 | $0 |
| Other Liabilities Principal Repayment | $0 | $0 | $0 |
| Long-term Liabilities Principal Repayment | $0 | $0 | $0 |
| Purchase Other Current Assets | $0 | $0 | $0 |
| Purchase Long-term Assets | $0 | $0 | $0 |
| Dividends | $0 | $0 | $0 |
| Subtotal Cash Spent | $875,324 | $1,434,376 | $1,594,181 |
| Net Cash Flow | $24,676 | $315,624 | $405,819 |
| Cash Balance | $84,676 | $400,299 | $806,118 |
7.6 Projected Balance Sheet
Our Projected Balance Sheet shows we will not have any difficulty meeting our debt obligations as long as our revenue projections are met.
| Pro Forma Balance Sheet | |||
| Year 1 | Year 2 | Year 3 | |
| Assets | |||
| Current Assets | |||
| Cash | $84,676 | $400,299 | $806,118 |
| Inventory | $54,450 | $106,111 | $121,269 |
| Other Current Assets | $0 | $0 | $0 |
| Total Current Assets | $139,126 | $506,410 | $927,387 |
| Long-term Assets | |||
| Long-term Assets | $0 | $0 | $0 |
| Accumulated Depreciation | $0 | $0 | $0 |
| Total Long-term Assets | $0 | $0 | $0 |
| Total Assets | $139,126 | $506,410 | $927,387 |
| Liabilities and Capital | Year 1 | Year 2 | Year 3 |
| Current Liabilities | |||
| Accounts Payable | $63,316 | $107,452 | $117,811 |
| Current Borrowing | $0 | $0 | $0 |
| Other Current Liabilities | $0 | $0 | $0 |
| Subtotal Current Liabilities | $63,316 | $107,452 | $117,811 |
| Long-term Liabilities | $0 | $0 | $0 |
| Total Liabilities | $63,316 | $107,452 | $117,811 |
| Paid-in Capital | $160,000 | $160,000 | $160,000 |
| Retained Earnings | ($94,000) | ($84,190) | $238,958 |
| Earnings | $9,810 | $323,148 | $410,619 |
| Total Capital | $75,810 | $398,958 | $809,577 |
| Total Liabilities and Capital | $139,126 | $506,410 | $927,387 |
| Net Worth | $75,810 | $398,958 | $809,577 |
7.7 Business Ratios
The follow table contains important business ratios for the physical fitness facilities industry, as determined by the Standard Industry Classification (SIC) code, 7991.
| Ratio Analysis | ||||
| Year 1 | Year 2 | Year 3 | Industry Profile | |
| Sales Growth | 0.00% | 94.44% | 14.29% | 15.90% |
| Percent of Total Assets | ||||
| Inventory | 39.14% | 20.95% | 13.08% | 3.60% |
| Other Current Assets | 0.00% | 0.00% | 0.00% | 31.10% |
| Total Current Assets | 100.00% | 100.00% | 100.00% | 39.00% |
| Long-term Assets | 0.00% | 0.00% | 0.00% | 61.00% |
| Total Assets | 100.00% | 100.00% | 100.00% | 100.00% |
| Current Liabilities | 45.51% | 21.22% | 12.70% | 34.80% |
| Long-term Liabilities | 0.00% | 0.00% | 0.00% | 27.60% |
| Total Liabilities | 45.51% | 21.22% | 12.70% | 62.40% |
| Net Worth | 54.49% | 78.78% | 87.30% | 37.60% |
| Percent of Sales | ||||
| Sales | 100.00% | 100.00% | 100.00% | 100.00% |
| Gross Margin | 40.13% | 40.00% | 40.00% | 0.00% |
| Selling, General & Administrative Expenses | 39.37% | 21.53% | 18.94% | 73.20% |
| Advertising Expenses | 1.11% | 0.86% | 0.85% | 2.40% |
| Profit Before Interest and Taxes | 0.77% | 18.47% | 21.06% | 2.70% |
| Main Ratios | ||||
| Current | 2.20 | 4.71 | 7.87 | 1.10 |
| Quick | 1.34 | 3.73 | 6.84 | 0.73 |
| Total Debt to Total Assets | 45.51% | 21.22% | 12.70% | 62.40% |
| Pre-tax Return on Net Worth | 9.11% | 81.00% | 52.02% | 3.00% |
| Pre-tax Return on Assets | 4.96% | 63.81% | 45.41% | 7.90% |
| Additional Ratios | Year 1 | Year 2 | Year 3 | |
| Net Profit Margin | 1.09% | 18.47% | 20.53% | n.a |
| Return on Equity | 12.94% | 81.00% | 50.72% | n.a |
| Activity Ratios | ||||
| Inventory Turnover | 10.91 | 13.08 | 10.56 | n.a |
| Accounts Payable Turnover | 12.36 | 12.17 | 12.17 | n.a |
| Payment Days | 27 | 24 | 29 | n.a |
| Total Asset Turnover | 6.47 | 3.46 | 2.16 | n.a |
| Debt Ratios | ||||
| Debt to Net Worth | 0.84 | 0.27 | 0.15 | n.a |
| Current Liab. to Liab. | 1.00 | 1.00 | 1.00 | n.a |
| Liquidity Ratios | ||||
| Net Working Capital | $75,810 | $398,958 | $809,577 | n.a |
| Interest Coverage | 0.00 | 0.00 | 0.00 | n.a |
| Additional Ratios | ||||
| Assets to Sales | 0.15 | 0.29 | 0.46 | n.a |
| Current Debt/Total Assets | 46% | 21% | 13% | n.a |
| Acid Test | 1.34 | 3.73 | 6.84 | n.a |
| Sales/Net Worth | 11.87 | 4.39 | 2.47 | n.a |
| Dividend Payout | 0.00 | 0.00 | 0.00 | n.a |
Appendix
| Sales Forecast | |||||||||||||
| Month 1 | Month 2 | Month 3 | Month 4 | Month 5 | Month 6 | Month 7 | Month 8 | Month 9 | Month 10 | Month 11 | Month 12 | ||
| Sales | |||||||||||||
| Salon Styles Only Revenue | 0% | $48,000 | $54,000 | $60,000 | $60,000 | $60,000 | $60,000 | $60,000 | $60,000 | $62,000 | $63,500 | $65,000 | $65,000 |
| Spa Massage Only Revenue | 0% | $12,000 | $13,500 | $15,000 | $15,000 | $15,000 | $15,000 | $15,000 | $15,000 | $16,000 | $16,000 | $17,500 | $17,500 |
| Total Sales | $60,000 | $67,500 | $75,000 | $75,000 | $75,000 | $75,000 | $75,000 | $75,000 | $78,000 | $79,500 | $82,500 | $82,500 | |
| Direct Cost of Sales | Month 1 | Month 2 | Month 3 | Month 4 | Month 5 | Month 6 | Month 7 | Month 8 | Month 9 | Month 10 | Month 11 | Month 12 | |
| Salon Styles Only Revenue | $28,800 | $32,400 | $36,000 | $36,000 | $36,000 | $36,000 | $36,000 | $36,000 | $36,000 | $38,100 | $39,000 | $39,000 | |
| Spa Massage Only Revenue | $7,200 | $8,100 | $9,000 | $9,000 | $9,000 | $9,000 | $9,000 | $9,000 | $9,600 | $9,600 | $10,500 | $10,500 | |
| Subtotal Direct Cost of Sales | $36,000 | $40,500 | $45,000 | $45,000 | $45,000 | $45,000 | $45,000 | $45,000 | $45,600 | $47,700 | $49,500 | $49,500 | |
| Personnel Plan | |||||||||||||
| Month 1 | Month 2 | Month 3 | Month 4 | Month 5 | Month 6 | Month 7 | Month 8 | Month 9 | Month 10 | Month 11 | Month 12 | ||
| Steve Long, Owner, President | 0% | $5,420 | $5,420 | $5,420 | $5,420 | $5,420 | $5,420 | $5,420 | $5,420 | $5,420 | $5,420 | $5,420 | $5,420 |
| General Manager | 0% | $5,000 | $5,000 | $5,000 | $5,000 | $5,000 | $5,000 | $5,000 | $5,000 | $5,000 | $5,000 | $5,000 | $5,000 |
| %100 Commissioned Employees | 0% | $10 | $10 | $13 | $13 | $13 | $13 | $13 | $13 | $13 | $13 | $13 | $13 |
| Receptionist | 0% | $1,280 | $1,280 | $1,280 | $1,280 | $1,280 | $1,280 | $1,280 | $1,280 | $1,280 | $1,280 | $1,280 | $1,280 |
| Receptionist | 0% | $1,280 | $1,280 | $1,280 | $1,280 | $1,280 | $1,280 | $1,280 | $1,280 | $1,280 | $1,280 | $1,280 | $1,280 |
| Total People | 14 | 14 | 17 | 17 | 17 | 17 | 17 | 17 | 17 | 17 | 17 | 17 | |
| Total Payroll | $12,990 | $12,990 | $12,993 | $12,993 | $12,993 | $12,993 | $12,993 | $12,993 | $12,993 | $12,993 | $12,993 | $12,993 | |
| General Assumptions | |||||||||||||
| Month 1 | Month 2 | Month 3 | Month 4 | Month 5 | Month 6 | Month 7 | Month 8 | Month 9 | Month 10 | Month 11 | Month 12 | ||
| Plan Month | 1 | 2 | 3 | 4 | 5 | 6 | 7 | 8 | 9 | 10 | 11 | 12 | |
| Current Interest Rate | 10.00% | 10.00% | 10.00% | 10.00% | 10.00% | 10.00% | 10.00% | 10.00% | 10.00% | 10.00% | 10.00% | 10.00% | |
| Long-term Interest Rate | 10.00% | 10.00% | 10.00% | 10.00% | 10.00% | 10.00% | 10.00% | 10.00% | 10.00% | 10.00% | 10.00% | 10.00% | |
| Tax Rate | 30.00% | 0.00% | 0.00% | 0.00% | 0.00% | 0.00% | 0.00% | 0.00% | 0.00% | 0.00% | 0.00% | 0.00% | |
| Other | 0 | 0 | 0 | 0 | 0 | 0 | 0 | 0 | 0 | 0 | 0 | 0 | |
| Pro Forma Profit and Loss | |||||||||||||
| Month 1 | Month 2 | Month 3 | Month 4 | Month 5 | Month 6 | Month 7 | Month 8 | Month 9 | Month 10 | Month 11 | Month 12 | ||
| Sales | $60,000 | $67,500 | $75,000 | $75,000 | $75,000 | $75,000 | $75,000 | $75,000 | $78,000 | $79,500 | $82,500 | $82,500 | |
| Direct Cost of Sales | $36,000 | $40,500 | $45,000 | $45,000 | $45,000 | $45,000 | $45,000 | $45,000 | $45,600 | $47,700 | $49,500 | $49,500 | |
| Other | $0 | $0 | $0 | $0 | $0 | $0 | $0 | $0 | $0 | $0 | $0 | $0 | |
| Total Cost of Sales | $36,000 | $40,500 | $45,000 | $45,000 | $45,000 | $45,000 | $45,000 | $45,000 | $45,600 | $47,700 | $49,500 | $49,500 | |
| Gross Margin | $24,000 | $27,000 | $30,000 | $30,000 | $30,000 | $30,000 | $30,000 | $30,000 | $32,400 | $31,800 | $33,000 | $33,000 | |
| Gross Margin % | 40.00% | 40.00% | 40.00% | 40.00% | 40.00% | 40.00% | 40.00% | 40.00% | 41.54% | 40.00% | 40.00% | 40.00% | |
| Expenses | |||||||||||||
| Payroll | $12,990 | $12,990 | $12,993 | $12,993 | $12,993 | $12,993 | $12,993 | $12,993 | $12,993 | $12,993 | $12,993 | $12,993 | |
| Sales and Marketing and Other Expenses | $7,000 | $2,300 | $2,300 | $2,300 | $2,300 | $2,300 | $2,300 | $2,300 | $2,300 | $2,300 | $4,000 | $2,300 | |
| Depreciation | $0 | $0 | $0 | $0 | $0 | $0 | $0 | $0 | $0 | $0 | $0 | $0 | |
| Rent | $10,000 | $10,000 | $10,000 | $10,000 | $10,000 | $10,000 | $10,000 | $10,000 | $10,000 | $10,000 | $10,000 | $10,000 | |
| Leased Equipment | $0 | $0 | $0 | $0 | $0 | $0 | $0 | $0 | $0 | $0 | $0 | $0 | |
| Utilities | $750 | $750 | $750 | $750 | $750 | $750 | $750 | $750 | $750 | $750 | $750 | $750 | |
| Insurance | $1,000 | $1,000 | $1,000 | $1,000 | $1,000 | $1,000 | $1,000 | $1,000 | $1,000 | $1,000 | $1,000 | $1,000 | |
| Payroll Taxes | 15% | $1,949 | $1,949 | $1,949 | $1,949 | $1,949 | $1,949 | $1,949 | $1,949 | $1,949 | $1,949 | $1,949 | $1,949 |
| Other | $0 | $0 | $0 | $0 | $0 | $0 | $0 | $0 | $0 | $0 | $0 | $0 | |
| Total Operating Expenses | $33,689 | $28,989 | $28,992 | $28,992 | $28,992 | $28,992 | $28,992 | $28,992 | $28,992 | $28,992 | $30,692 | $28,992 | |
| Profit Before Interest and Taxes | ($9,689) | ($1,989) | $1,008 | $1,008 | $1,008 | $1,008 | $1,008 | $1,008 | $3,408 | $2,808 | $2,308 | $4,008 | |
| EBITDA | ($9,689) | ($1,989) | $1,008 | $1,008 | $1,008 | $1,008 | $1,008 | $1,008 | $3,408 | $2,808 | $2,308 | $4,008 | |
| Interest Expense | $0 | $0 | $0 | $0 | $0 | $0 | $0 | $0 | $0 | $0 | $0 | $0 | |
| Taxes Incurred | ($2,907) | $0 | $0 | $0 | $0 | $0 | $0 | $0 | $0 | $0 | $0 | $0 | |
| Net Profit | ($6,782) | ($1,989) | $1,008 | $1,008 | $1,008 | $1,008 | $1,008 | $1,008 | $3,408 | $2,808 | $2,308 | $4,008 | |
| Net Profit/Sales | -11.30% | -2.95% | 1.34% | 1.34% | 1.34% | 1.34% | 1.34% | 1.34% | 4.37% | 3.53% | 2.80% | 4.86% | |
| Pro Forma Cash Flow | |||||||||||||
| Month 1 | Month 2 | Month 3 | Month 4 | Month 5 | Month 6 | Month 7 | Month 8 | Month 9 | Month 10 | Month 11 | Month 12 | ||
| Cash Received | |||||||||||||
| Cash from Operations | |||||||||||||
| Cash Sales | $60,000 | $67,500 | $75,000 | $75,000 | $75,000 | $75,000 | $75,000 | $75,000 | $78,000 | $79,500 | $82,500 | $82,500 | |
| Subtotal Cash from Operations | $60,000 | $67,500 | $75,000 | $75,000 | $75,000 | $75,000 | $75,000 | $75,000 | $78,000 | $79,500 | $82,500 | $82,500 | |
| Additional Cash Received | |||||||||||||
| Sales Tax, VAT, HST/GST Received | 0.00% | $0 | $0 | $0 | $0 | $0 | $0 | $0 | $0 | $0 | $0 | $0 | $0 |
| New Current Borrowing | $0 | $0 | $0 | $0 | $0 | $0 | $0 | $0 | $0 | $0 | $0 | $0 | |
| New Other Liabilities (interest-free) | $0 | $0 | $0 | $0 | $0 | $0 | $0 | $0 | $0 | $0 | $0 | $0 | |
| New Long-term Liabilities | $0 | $0 | $0 | $0 | $0 | $0 | $0 | $0 | $0 | $0 | $0 | $0 | |
| Sales of Other Current Assets | $0 | $0 | $0 | $0 | $0 | $0 | $0 | $0 | $0 | $0 | $0 | $0 | |
| Sales of Long-term Assets | $0 | $0 | $0 | $0 | $0 | $0 | $0 | $0 | $0 | $0 | $0 | $0 | |
| New Investment Received | $0 | $0 | $0 | $0 | $0 | $0 | $0 | $0 | $0 | $0 | $0 | $0 | |
| Subtotal Cash Received | $60,000 | $67,500 | $75,000 | $75,000 | $75,000 | $75,000 | $75,000 | $75,000 | $78,000 | $79,500 | $82,500 | $82,500 | |
| Expenditures | Month 1 | Month 2 | Month 3 | Month 4 | Month 5 | Month 6 | Month 7 | Month 8 | Month 9 | Month 10 | Month 11 | Month 12 | |
| Expenditures from Operations | |||||||||||||
| Cash Spending | $12,990 | $12,990 | $12,993 | $12,993 | $12,993 | $12,993 | $12,993 | $12,993 | $12,993 | $12,993 | $12,993 | $12,993 | |
| Bill Payments | $2,913 | $86,527 | $61,599 | $65,784 | $60,999 | $60,999 | $60,999 | $60,999 | $61,041 | $62,384 | $66,115 | $69,056 | |
| Subtotal Spent on Operations | $15,903 | $99,517 | $74,592 | $78,777 | $73,992 | $73,992 | $73,992 | $73,992 | $74,034 | $75,377 | $79,108 | $82,049 | |
| Additional Cash Spent | |||||||||||||
| Sales Tax, VAT, HST/GST Paid Out | $0 | $0 | $0 | $0 | $0 | $0 | $0 | $0 | $0 | $0 | $0 | $0 | |
| Principal Repayment of Current Borrowing | $0 | $0 | $0 | $0 | $0 | $0 | $0 | $0 | $0 | $0 | $0 | $0 | |
| Other Liabilities Principal Repayment | $0 | $0 | $0 | $0 | $0 | $0 | $0 | $0 | $0 | $0 | $0 | $0 | |
| Long-term Liabilities Principal Repayment | $0 | $0 | $0 | $0 | $0 | $0 | $0 | $0 | $0 | $0 | $0 | $0 | |
| Purchase Other Current Assets | $0 | $0 | $0 | $0 | $0 | $0 | $0 | $0 | $0 | $0 | $0 | $0 | |
| Purchase Long-term Assets | $0 | $0 | $0 | $0 | $0 | $0 | $0 | $0 | $0 | $0 | $0 | $0 | |
| Dividends | $0 | $0 | $0 | $0 | $0 | $0 | $0 | $0 | $0 | $0 | $0 | $0 | |
| Subtotal Cash Spent | $15,903 | $99,517 | $74,592 | $78,777 | $73,992 | $73,992 | $73,992 | $73,992 | $74,034 | $75,377 | $79,108 | $82,049 | |
| Net Cash Flow | $44,097 | ($32,017) | $408 | ($3,777) | $1,008 | $1,008 | $1,008 | $1,008 | $3,966 | $4,123 | $3,392 | $451 | |
| Cash Balance | $104,097 | $72,080 | $72,488 | $68,711 | $69,719 | $70,727 | $71,735 | $72,744 | $76,710 | $80,833 | $84,225 | $84,676 | |
| Pro Forma Balance Sheet | |||||||||||||
| Month 1 | Month 2 | Month 3 | Month 4 | Month 5 | Month 6 | Month 7 | Month 8 | Month 9 | Month 10 | Month 11 | Month 12 | ||
| Assets | Starting Balances | ||||||||||||
| Current Assets | |||||||||||||
| Cash | $60,000 | $104,097 | $72,080 | $72,488 | $68,711 | $69,719 | $70,727 | $71,735 | $72,744 | $76,710 | $80,833 | $84,225 | $84,676 |
| Inventory | $6,000 | $39,600 | $44,550 | $49,500 | $49,500 | $49,500 | $49,500 | $49,500 | $49,500 | $50,160 | $52,470 | $54,450 | $54,450 |
| Other Current Assets | $0 | $0 | $0 | $0 | $0 | $0 | $0 | $0 | $0 | $0 | $0 | $0 | $0 |
| Total Current Assets | $66,000 | $143,697 | $116,630 | $121,988 | $118,211 | $119,219 | $120,227 | $121,235 | $122,244 | $126,870 | $133,303 | $138,675 | $139,126 |
| Long-term Assets | |||||||||||||
| Long-term Assets | $0 | $0 | $0 | $0 | $0 | $0 | $0 | $0 | $0 | $0 | $0 | $0 | $0 |
| Accumulated Depreciation | $0 | $0 | $0 | $0 | $0 | $0 | $0 | $0 | $0 | $0 | $0 | $0 | $0 |
| Total Long-term Assets | $0 | $0 | $0 | $0 | $0 | $0 | $0 | $0 | $0 | $0 | $0 | $0 | $0 |
| Total Assets | $66,000 | $143,697 | $116,630 | $121,988 | $118,211 | $119,219 | $120,227 | $121,235 | $122,244 | $126,870 | $133,303 | $138,675 | $139,126 |
| Liabilities and Capital | Month 1 | Month 2 | Month 3 | Month 4 | Month 5 | Month 6 | Month 7 | Month 8 | Month 9 | Month 10 | Month 11 | Month 12 | |
| Current Liabilities | |||||||||||||
| Accounts Payable | $0 | $84,479 | $59,400 | $63,751 | $58,966 | $58,966 | $58,966 | $58,966 | $58,966 | $60,184 | $63,809 | $66,873 | $63,316 |
| Current Borrowing | $0 | $0 | $0 | $0 | $0 | $0 | $0 | $0 | $0 | $0 | $0 | $0 | $0 |
| Other Current Liabilities | $0 | $0 | $0 | $0 | $0 | $0 | $0 | $0 | $0 | $0 | $0 | $0 | $0 |
| Subtotal Current Liabilities | $0 | $84,479 | $59,400 | $63,751 | $58,966 | $58,966 | $58,966 | $58,966 | $58,966 | $60,184 | $63,809 | $66,873 | $63,316 |
| Long-term Liabilities | $0 | $0 | $0 | $0 | $0 | $0 | $0 | $0 | $0 | $0 | $0 | $0 | $0 |
| Total Liabilities | $0 | $84,479 | $59,400 | $63,751 | $58,966 | $58,966 | $58,966 | $58,966 | $58,966 | $60,184 | $63,809 | $66,873 | $63,316 |
| Paid-in Capital | $160,000 | $160,000 | $160,000 | $160,000 | $160,000 | $160,000 | $160,000 | $160,000 | $160,000 | $160,000 | $160,000 | $160,000 | $160,000 |
| Retained Earnings | ($94,000) | ($94,000) | ($94,000) | ($94,000) | ($94,000) | ($94,000) | ($94,000) | ($94,000) | ($94,000) | ($94,000) | ($94,000) | ($94,000) | ($94,000) |
| Earnings | $0 | ($6,782) | ($8,770) | ($7,762) | ($6,754) | ($5,746) | ($4,738) | ($3,730) | ($2,722) | $686 | $3,494 | $5,802 | $9,810 |
| Total Capital | $66,000 | $59,218 | $57,230 | $58,238 | $59,246 | $60,254 | $61,262 | $62,270 | $63,278 | $66,686 | $69,494 | $71,802 | $75,810 |
| Total Liabilities and Capital | $66,000 | $143,697 | $116,630 | $121,988 | $118,211 | $119,219 | $120,227 | $121,235 | $122,244 | $126,870 | $133,303 | $138,675 | $139,126 |
| Net Worth | $66,000 | $59,218 | $57,230 | $58,238 | $59,246 | $60,254 | $61,262 | $62,270 | $63,278 | $66,686 | $69,494 | $71,802 | $75,810 |


