
Aztec Food Imports
Executive Summary
Aztec Food Imports (Aztec) will offer food product imports from Mexico to meet increased demand for these product by the city’s growing Hispanic/Latino community in the greater Richmond area. Over the last five years, this community has grown by 70%, and represents half of the Richmond Metro population (250,000). Aztec has been successful over the competition in supplying imported mexican food products to the area’s two PriceRight supermarkets. From this base, Aztec will build a successful business serving the area’s large and small markets.

1.1 Objectives
- Establish Aztec Food Imports as the number one importer of mexican food products in Richmond.
- Increase the number of mexican food products being carried in local markets by 20% over the next two years.
- Build solid working relationships with the purchasing agents of the local stores serving Richmond’s growing Hispanic/Latino population.
1.2 Mission
Aztec’s mission is to supply Mexican food imports to Richmond stores which are currently being poorly served by importers located over 150 miles away. Raymond Garcia, co-owner of Aztec, will utilize his importing background, his experience in the food retail market, as well as his contacts in Mexico to bring in products that area customers demand.
1.3 Keys to Success
The keys to success in Aztec’s business are:
- Offering items of a high quality-value relationship which are not available everywhere. This is essential for maintaining the niche market sectors mentioned in the mission statement.
- Reliable and timely deliveries. Aztec must make good on its delivery promises. Because of the nature of doing business in Mexico, this requires long-range planning in scheduling orders, taking into account Mexican business practices.
- A reliable administration that is ready to serve customers, prepare accurate billing, follow-up on orders and other documentation, and maintain a close watch on expenses and collection of accounts receivable.
Company Summary
Aztec Food Imports will import Mexican food products to the local markets of the Richmond Metro area.
2.1 Company Ownership
Aztec’s ownership is shared equally between Raymond Garcia and Jose Arroyo. Raymond has eight years of importing experience. Jose Arroya has 10 years experience in managing imports from Mexico and shipping to the U.S. market. Raymond Garcia is responsible for the daily management, sales, and store deliveries. Jose Arroya is responsible for the quality control and shipping of the goods from Mexico to the U.S.
2.2 Start-up Summary
The start-up cost of Aztec Food Imports will consist primarily of inventory. Raymond Garcia and Jose Arroya will each invest $50,000. They will also secure a $100,000 SBA loan.

| Start-up Funding | |
| Start-up Expenses to Fund | $15,300 |
| Start-up Assets to Fund | $184,700 |
| Total Funding Required | $200,000 |
| Assets | |
| Non-cash Assets from Start-up | $80,000 |
| Cash Requirements from Start-up | $104,700 |
| Additional Cash Raised | $0 |
| Cash Balance on Starting Date | $104,700 |
| Total Assets | $184,700 |
| Liabilities and Capital | |
| Liabilities | |
| Current Borrowing | $0 |
| Long-term Liabilities | $100,000 |
| Accounts Payable (Outstanding Bills) | $0 |
| Other Current Liabilities (interest-free) | $0 |
| Total Liabilities | $100,000 |
| Capital | |
| Planned Investment | |
| Raymond Garcia | $50,000 |
| IJose Arroya | $50,000 |
| Other | $0 |
| Additional Investment Requirement | $0 |
| Total Planned Investment | $100,000 |
| Loss at Start-up (Start-up Expenses) | ($15,300) |
| Total Capital | $84,700 |
| Total Capital and Liabilities | $184,700 |
| Total Funding | $200,000 |
| Start-up | |
| Requirements | |
| Start-up Expenses | |
| Legal | $5,000 |
| Stationery etc. | $800 |
| Brochures | $2,000 |
| Consultants | $0 |
| Insurance | $0 |
| Rent | $3,000 |
| Expensed Equipment | $4,000 |
| Utilities | $500 |
| Other | $0 |
| Total Start-up Expenses | $15,300 |
| Start-up Assets | |
| Cash Required | $104,700 |
| Start-up Inventory | $60,000 |
| Other Current Assets | $0 |
| Long-term Assets | $20,000 |
| Total Assets | $184,700 |
| Total Requirements | $200,000 |
2.3 Company Locations and Facilities
Aztec Food Imports will have warehouse space located in the Fillmore industrial district.
Products
Aztec’s product line is rather extensive amounting to over 200 items:
- Beverages.
- Canned foods.
- Chile peppers.
- Desserts.
- Packaged foods.
- Salsas.
- Snacks.
- Spices and herbs.
Aztec also carries the popular brands:
- Ducal.
- Herdez.
- Juanita’s.
- La Costeña.
- La Joya.
- La Lechonera.
- La Sierra.
- Pico Pica.
Market Analysis Summary
The Hispanic/Latino population in the Richmond Metro area has grown by 10% over the past five years. The current population stands at over 100,000. It is projected that the population will continue its growth pattern for the next five years and will eventually reach over 160,000. A majority of these inner-city residents live in family groups of six or more members. The average household income for the area is $32,000.
There are four major supermarkets that operate in the area and over 50 smaller food stores that serve the metro communities. Last year, the four major supermarkets grossed over $150,000,000 in sales. There are plans to build additional supermarkets in the Richmond Metro area in 2003 and 2004. Two of the current supermarkets in the Richmond Metro area are part the local PriceRight chain. PriceRight is planning a new store in the area in 2004.
Though it is difficult to know the exact sales figures for the small markets in the area, traditionally, the community residents have been supportive of the smaller store if their prices are competitive. Last year, Wilson Foods Imports grossed $1.5 million in sales with smaller markets in the Richmond Metro area.
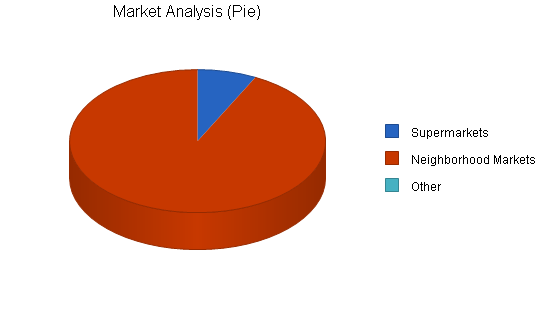
4.1 Market Segmentation
Aztec Food Imports will serve all retail food outlets in the Richmond Metro area. These include neighborhood markets and supermarkets.
| Market Analysis | |||||||
| Year 1 | Year 2 | Year 3 | Year 4 | Year 5 | |||
| Potential Customers | Growth | CAGR | |||||
| Supermarkets | 20% | 4 | 5 | 6 | 7 | 8 | 18.92% |
| Neighborhood Markets | 20% | 50 | 60 | 72 | 86 | 103 | 19.80% |
| Other | 0% | 0 | 0 | 0 | 0 | 0 | 0.00% |
| Total | 19.74% | 54 | 65 | 78 | 93 | 111 | 19.74% |
4.2 Target Market Segment Strategy
Aztec Food Imports will have two distinct marketing approaches:
- For Neighborhood Markets: Raymond will promote a small group of popular mexican food products that are likely to move fast in smaller stores. These products will be priced to be attractive to the small store owner. Once successful, Raymond will expand the product group.
- For Supermarkets: Raymond will promote the complete line of products that Aztec can provide. Aztec prices will reflect a stronger import connection in Mexico that will results in lower prices and more product.
4.3 Main Competitors
Currently, Acme Food Importers located in Wilsonville supplies the Richmond area food stores with imported mexican food products. Wilsonville is 150 miles north of Richmond. Only in the past two years has the demand for these products grown sufficiently to impact Acme’s ability to satisfy demand. Besides the distance, Acme is plagued with weak import connections in Mexico. These factors contribute to the high wholesale price of Acme’s imported products.
Strategy and Implementation Summary
Aztec Food Imports will focus on becoming the leading provider of wholesale imported mexican food product in the Richmond Metro area.
5.1 Competitive Edge
Raymond Garcia and Jose Arroyo are the competitive edge of Aztec Food Imports. Raymond has worked for both Acme Food Imports and Wilson Food Imports over the past eight years. In his last position with Wilson, Raymond imported mexican food products to numerous markets in the southwest. He generated sales in excess of $2 million annually. His strength is his customer relations and he has been successful in expanding the range of imported mexican food purchased by the markets in his sales region.
Jose has been a shipping agent for M. Zegarra Exporting located in Mexico City for the past ten years. The company exported $20 million of products to the U.S last year. Jose’s responsibility was to eliminate the shipping obstacles and oversee the timely delivery of product to the U.S.
5.2 Sales Strategy
Aztec Food Imports will have two distinct sales approaches:
- For Neighborhood Markets: Raymond will promote a small group of popular mexican food products that are likely to move fast in smaller stores. These items will be packaged as a group at an attractive price. Raymond will make frequent visits to these stores to build a strong working relationship that will lead to more purchases.
- For Supermarkets: Raymond will promote the complete line of products that Aztec can provide. Aztec prices will reflect a stronger import connection in Mexico that will results in lower prices and more product. Raymond will promote new seasonal products and provide assistance on marketing the products to the Hispanic/Latino community.
5.2.1 Sales Forecast
The following is the sales forecast for three years.

| Sales Forecast | |||
| Year 1 | Year 2 | Year 3 | |
| Sales | |||
| Supermarkets | $209,500 | $260,000 | $310,000 |
| Neighborhood Markets | $124,000 | $160,000 | $200,000 |
| Total Sales | $333,500 | $420,000 | $510,000 |
| Direct Cost of Sales | Year 1 | Year 2 | Year 3 |
| Supermarkets | $85,900 | $110,000 | $130,000 |
| Neighborhood Markets | $18,300 | $23,000 | $24,000 |
| Subtotal Direct Cost of Sales | $104,200 | $133,000 | $154,000 |
Management Summary
The two owners will co-manage the business. Raymond Garcia is responsible for the daily management, sales, and store deliveries. Jose Arroyo is responsible for the quality control and shipping of the goods from Mexico to the U.S.
6.1 Personnel Plan
Aztec Food Imports will have two additional delivery employees and an office manager supervised by Raymond.
| Personnel Plan | |||
| Year 1 | Year 2 | Year 3 | |
| Raymond Garcia | $36,000 | $45,000 | $50,000 |
| Jose Arroyo | $36,000 | $45,000 | $50,000 |
| Delivery Persons | $48,000 | $54,000 | $60,000 |
| Office Manager | $31,200 | $34,000 | $38,000 |
| Other | $0 | $0 | $0 |
| Total People | 5 | 5 | 5 |
| Total Payroll | $151,200 | $178,000 | $198,000 |
Financial Plan
The following sections outline conservative estimates of the financial performance of Aztec Food Imports.
7.1 Break-even Analysis
The monthly break-even point is $26,514.

| Break-even Analysis | |
| Monthly Revenue Break-even | $26,514 |
| Assumptions: | |
| Average Percent Variable Cost | 31% |
| Estimated Monthly Fixed Cost | $18,230 |
7.2 Projected Profit and Loss
The following table and charts will highlight the next three years.


| Pro Forma Profit and Loss | |||
| Year 1 | Year 2 | Year 3 | |
| Sales | $333,500 | $420,000 | $510,000 |
| Direct Cost of Sales | $104,200 | $133,000 | $154,000 |
| Other Production Expenses | $0 | $0 | $0 |
| Total Cost of Sales | $104,200 | $133,000 | $154,000 |
| Gross Margin | $229,300 | $287,000 | $356,000 |
| Gross Margin % | 68.76% | 68.33% | 69.80% |
| Expenses | |||
| Payroll | $151,200 | $178,000 | $198,000 |
| Sales and Marketing and Other Expenses | $0 | $0 | $0 |
| Depreciation | $2,880 | $2,880 | $2,880 |
| Leased Equipment | $0 | $0 | $0 |
| Utilities | $6,000 | $6,000 | $6,000 |
| Insurance | $0 | $0 | $0 |
| Rent | $36,000 | $36,000 | $36,000 |
| Payroll Taxes | $22,680 | $26,700 | $29,700 |
| Other | $0 | $0 | $0 |
| Total Operating Expenses | $218,760 | $249,580 | $272,580 |
| Profit Before Interest and Taxes | $10,540 | $37,420 | $83,420 |
| EBITDA | $13,420 | $40,300 | $86,300 |
| Interest Expense | $9,233 | $7,876 | $6,460 |
| Taxes Incurred | $392 | $8,863 | $23,088 |
| Net Profit | $915 | $20,681 | $53,872 |
| Net Profit/Sales | 0.27% | 4.92% | 10.56% |
7.3 Projected Cash Flow
The following table and chart highlight the projected cash flow for three years.

| Pro Forma Cash Flow | |||
| Year 1 | Year 2 | Year 3 | |
| Cash Received | |||
| Cash from Operations | |||
| Cash Sales | $83,375 | $105,000 | $127,500 |
| Cash from Receivables | $194,775 | $300,644 | $367,563 |
| Subtotal Cash from Operations | $278,150 | $405,644 | $495,063 |
| Additional Cash Received | |||
| Sales Tax, VAT, HST/GST Received | $0 | $0 | $0 |
| New Current Borrowing | $0 | $0 | $0 |
| New Other Liabilities (interest-free) | $0 | $0 | $0 |
| New Long-term Liabilities | $0 | $0 | $0 |
| Sales of Other Current Assets | $0 | $0 | $0 |
| Sales of Long-term Assets | $0 | $0 | $0 |
| New Investment Received | $0 | $0 | $0 |
| Subtotal Cash Received | $278,150 | $405,644 | $495,063 |
| Expenditures | Year 1 | Year 2 | Year 3 |
| Expenditures from Operations | |||
| Cash Spending | $151,200 | $178,000 | $198,000 |
| Bill Payments | $110,267 | $228,719 | $255,535 |
| Subtotal Spent on Operations | $261,467 | $406,719 | $453,535 |
| Additional Cash Spent | |||
| Sales Tax, VAT, HST/GST Paid Out | $0 | $0 | $0 |
| Principal Repayment of Current Borrowing | $0 | $0 | $0 |
| Other Liabilities Principal Repayment | $0 | $0 | $0 |
| Long-term Liabilities Principal Repayment | $14,160 | $14,160 | $14,160 |
| Purchase Other Current Assets | $0 | $0 | $0 |
| Purchase Long-term Assets | $0 | $0 | $0 |
| Dividends | $0 | $0 | $0 |
| Subtotal Cash Spent | $275,627 | $420,879 | $467,695 |
| Net Cash Flow | $2,523 | ($15,235) | $27,368 |
| Cash Balance | $107,223 | $91,987 | $119,355 |
7.4 Projected Balance Sheet
The following table highlights the projected balance sheet for three years.
| Pro Forma Balance Sheet | |||
| Year 1 | Year 2 | Year 3 | |
| Assets | |||
| Current Assets | |||
| Cash | $107,223 | $91,987 | $119,355 |
| Accounts Receivable | $55,350 | $69,706 | $84,643 |
| Inventory | $15,950 | $20,358 | $23,573 |
| Other Current Assets | $0 | $0 | $0 |
| Total Current Assets | $178,523 | $182,052 | $227,571 |
| Long-term Assets | |||
| Long-term Assets | $20,000 | $20,000 | $20,000 |
| Accumulated Depreciation | $2,880 | $5,760 | $8,640 |
| Total Long-term Assets | $17,120 | $14,240 | $11,360 |
| Total Assets | $195,643 | $196,292 | $238,931 |
| Liabilities and Capital | Year 1 | Year 2 | Year 3 |
| Current Liabilities | |||
| Accounts Payable | $24,188 | $18,316 | $21,243 |
| Current Borrowing | $0 | $0 | $0 |
| Other Current Liabilities | $0 | $0 | $0 |
| Subtotal Current Liabilities | $24,188 | $18,316 | $21,243 |
| Long-term Liabilities | $85,840 | $71,680 | $57,520 |
| Total Liabilities | $110,028 | $89,996 | $78,763 |
| Paid-in Capital | $100,000 | $100,000 | $100,000 |
| Retained Earnings | ($15,300) | ($14,385) | $6,296 |
| Earnings | $915 | $20,681 | $53,872 |
| Total Capital | $85,615 | $106,296 | $160,168 |
| Total Liabilities and Capital | $195,643 | $196,292 | $238,931 |
| Net Worth | $85,615 | $106,296 | $160,168 |
7.5 Business Ratios
Business ratios for the years of this plan are shown below. Industry profile ratios based on the Standard Industrial Classification (SIC) code 5149, Groceries and Related Products, are shown for comparison.
| Ratio Analysis | ||||
| Year 1 | Year 2 | Year 3 | Industry Profile | |
| Sales Growth | 0.00% | 25.94% | 21.43% | 4.60% |
| Percent of Total Assets | ||||
| Accounts Receivable | 28.29% | 35.51% | 35.43% | 33.30% |
| Inventory | 8.15% | 10.37% | 9.87% | 26.00% |
| Other Current Assets | 0.00% | 0.00% | 0.00% | 20.90% |
| Total Current Assets | 91.25% | 92.75% | 95.25% | 80.20% |
| Long-term Assets | 8.75% | 7.25% | 4.75% | 19.80% |
| Total Assets | 100.00% | 100.00% | 100.00% | 100.00% |
| Current Liabilities | 12.36% | 9.33% | 8.89% | 45.20% |
| Long-term Liabilities | 43.88% | 36.52% | 24.07% | 10.00% |
| Total Liabilities | 56.24% | 45.85% | 32.96% | 55.20% |
| Net Worth | 43.76% | 54.15% | 67.04% | 44.80% |
| Percent of Sales | ||||
| Sales | 100.00% | 100.00% | 100.00% | 100.00% |
| Gross Margin | 68.76% | 68.33% | 69.80% | 44.10% |
| Selling, General & Administrative Expenses | 68.48% | 63.41% | 59.24% | 26.70% |
| Advertising Expenses | 0.00% | 0.00% | 0.00% | 0.70% |
| Profit Before Interest and Taxes | 3.16% | 8.91% | 16.36% | 0.80% |
| Main Ratios | ||||
| Current | 7.38 | 9.94 | 10.71 | 1.69 |
| Quick | 6.72 | 8.83 | 9.60 | 1.01 |
| Total Debt to Total Assets | 56.24% | 45.85% | 32.96% | 55.20% |
| Pre-tax Return on Net Worth | 1.53% | 27.79% | 48.05% | 3.60% |
| Pre-tax Return on Assets | 0.67% | 15.05% | 32.21% | 8.00% |
| Additional Ratios | Year 1 | Year 2 | Year 3 | |
| Net Profit Margin | 0.27% | 4.92% | 10.56% | n.a |
| Return on Equity | 1.07% | 19.46% | 33.63% | n.a |
| Activity Ratios | ||||
| Accounts Receivable Turnover | 4.52 | 4.52 | 4.52 | n.a |
| Collection Days | 56 | 72 | 74 | n.a |
| Inventory Turnover | 3.83 | 7.33 | 7.01 | n.a |
| Accounts Payable Turnover | 5.56 | 12.17 | 12.17 | n.a |
| Payment Days | 27 | 35 | 28 | n.a |
| Total Asset Turnover | 1.70 | 2.14 | 2.13 | n.a |
| Debt Ratios | ||||
| Debt to Net Worth | 1.29 | 0.85 | 0.49 | n.a |
| Current Liab. to Liab. | 0.22 | 0.20 | 0.27 | n.a |
| Liquidity Ratios | ||||
| Net Working Capital | $154,335 | $163,736 | $206,328 | n.a |
| Interest Coverage | 1.14 | 4.75 | 12.91 | n.a |
| Additional Ratios | ||||
| Assets to Sales | 0.59 | 0.47 | 0.47 | n.a |
| Current Debt/Total Assets | 12% | 9% | 9% | n.a |
| Acid Test | 4.43 | 5.02 | 5.62 | n.a |
| Sales/Net Worth | 3.90 | 3.95 | 3.18 | n.a |
| Dividend Payout | 0.00 | 0.00 | 0.00 | n.a |
Appendix
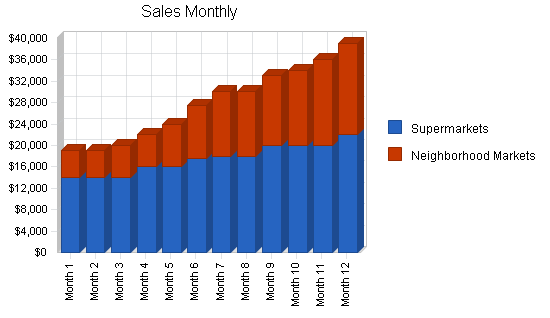
| Sales Forecast | |||||||||||||
| Month 1 | Month 2 | Month 3 | Month 4 | Month 5 | Month 6 | Month 7 | Month 8 | Month 9 | Month 10 | Month 11 | Month 12 | ||
| Sales | |||||||||||||
| Supermarkets | 0% | $14,000 | $14,000 | $14,000 | $16,000 | $16,000 | $17,500 | $18,000 | $18,000 | $20,000 | $20,000 | $20,000 | $22,000 |
| Neighborhood Markets | 0% | $5,000 | $5,000 | $6,000 | $6,000 | $8,000 | $10,000 | $12,000 | $12,000 | $13,000 | $14,000 | $16,000 | $17,000 |
| Total Sales | $19,000 | $19,000 | $20,000 | $22,000 | $24,000 | $27,500 | $30,000 | $30,000 | $33,000 | $34,000 | $36,000 | $39,000 | |
| Direct Cost of Sales | Month 1 | Month 2 | Month 3 | Month 4 | Month 5 | Month 6 | Month 7 | Month 8 | Month 9 | Month 10 | Month 11 | Month 12 | |
| Supermarkets | $4,000 | $4,000 | $4,000 | $4,400 | $6,000 | $6,300 | $8,000 | $8,200 | $9,000 | $10,000 | $10,000 | $12,000 | |
| Neighborhood Markets | $1,000 | $1,000 | $1,000 | $1,080 | $1,200 | $1,280 | $1,700 | $1,740 | $1,800 | $2,000 | $2,000 | $2,500 | |
| Subtotal Direct Cost of Sales | $5,000 | $5,000 | $5,000 | $5,480 | $7,200 | $7,580 | $9,700 | $9,940 | $10,800 | $12,000 | $12,000 | $14,500 | |
| Personnel Plan | |||||||||||||
| Month 1 | Month 2 | Month 3 | Month 4 | Month 5 | Month 6 | Month 7 | Month 8 | Month 9 | Month 10 | Month 11 | Month 12 | ||
| Raymond Garcia | 0% | $3,000 | $3,000 | $3,000 | $3,000 | $3,000 | $3,000 | $3,000 | $3,000 | $3,000 | $3,000 | $3,000 | $3,000 |
| Jose Arroyo | 0% | $3,000 | $3,000 | $3,000 | $3,000 | $3,000 | $3,000 | $3,000 | $3,000 | $3,000 | $3,000 | $3,000 | $3,000 |
| Delivery Persons | 0% | $4,000 | $4,000 | $4,000 | $4,000 | $4,000 | $4,000 | $4,000 | $4,000 | $4,000 | $4,000 | $4,000 | $4,000 |
| Office Manager | 0% | $2,600 | $2,600 | $2,600 | $2,600 | $2,600 | $2,600 | $2,600 | $2,600 | $2,600 | $2,600 | $2,600 | $2,600 |
| Other | 0% | $0 | $0 | $0 | $0 | $0 | $0 | $0 | $0 | $0 | $0 | $0 | $0 |
| Total People | 5 | 5 | 5 | 5 | 5 | 5 | 5 | 5 | 5 | 5 | 5 | 5 | |
| Total Payroll | $12,600 | $12,600 | $12,600 | $12,600 | $12,600 | $12,600 | $12,600 | $12,600 | $12,600 | $12,600 | $12,600 | $12,600 | |
| General Assumptions | |||||||||||||
| Month 1 | Month 2 | Month 3 | Month 4 | Month 5 | Month 6 | Month 7 | Month 8 | Month 9 | Month 10 | Month 11 | Month 12 | ||
| Plan Month | 1 | 2 | 3 | 4 | 5 | 6 | 7 | 8 | 9 | 10 | 11 | 12 | |
| Current Interest Rate | 10.00% | 10.00% | 10.00% | 10.00% | 10.00% | 10.00% | 10.00% | 10.00% | 10.00% | 10.00% | 10.00% | 10.00% | |
| Long-term Interest Rate | 10.00% | 10.00% | 10.00% | 10.00% | 10.00% | 10.00% | 10.00% | 10.00% | 10.00% | 10.00% | 10.00% | 10.00% | |
| Tax Rate | 30.00% | 30.00% | 30.00% | 30.00% | 30.00% | 30.00% | 30.00% | 30.00% | 30.00% | 30.00% | 30.00% | 30.00% | |
| Other | 0 | 0 | 0 | 0 | 0 | 0 | 0 | 0 | 0 | 0 | 0 | 0 | |
| Pro Forma Profit and Loss | |||||||||||||
| Month 1 | Month 2 | Month 3 | Month 4 | Month 5 | Month 6 | Month 7 | Month 8 | Month 9 | Month 10 | Month 11 | Month 12 | ||
| Sales | $19,000 | $19,000 | $20,000 | $22,000 | $24,000 | $27,500 | $30,000 | $30,000 | $33,000 | $34,000 | $36,000 | $39,000 | |
| Direct Cost of Sales | $5,000 | $5,000 | $5,000 | $5,480 | $7,200 | $7,580 | $9,700 | $9,940 | $10,800 | $12,000 | $12,000 | $14,500 | |
| Other Production Expenses | $0 | $0 | $0 | $0 | $0 | $0 | $0 | $0 | $0 | $0 | $0 | $0 | |
| Total Cost of Sales | $5,000 | $5,000 | $5,000 | $5,480 | $7,200 | $7,580 | $9,700 | $9,940 | $10,800 | $12,000 | $12,000 | $14,500 | |
| Gross Margin | $14,000 | $14,000 | $15,000 | $16,520 | $16,800 | $19,920 | $20,300 | $20,060 | $22,200 | $22,000 | $24,000 | $24,500 | |
| Gross Margin % | 73.68% | 73.68% | 75.00% | 75.09% | 70.00% | 72.44% | 67.67% | 66.87% | 67.27% | 64.71% | 66.67% | 62.82% | |
| Expenses | |||||||||||||
| Payroll | $12,600 | $12,600 | $12,600 | $12,600 | $12,600 | $12,600 | $12,600 | $12,600 | $12,600 | $12,600 | $12,600 | $12,600 | |
| Sales and Marketing and Other Expenses | $0 | $0 | $0 | $0 | $0 | $0 | $0 | $0 | $0 | $0 | $0 | $0 | |
| Depreciation | $240 | $240 | $240 | $240 | $240 | $240 | $240 | $240 | $240 | $240 | $240 | $240 | |
| Leased Equipment | $0 | $0 | $0 | $0 | $0 | $0 | $0 | $0 | $0 | $0 | $0 | $0 | |
| Utilities | $500 | $500 | $500 | $500 | $500 | $500 | $500 | $500 | $500 | $500 | $500 | $500 | |
| Insurance | $0 | $0 | $0 | $0 | $0 | $0 | $0 | $0 | $0 | $0 | $0 | $0 | |
| Rent | $3,000 | $3,000 | $3,000 | $3,000 | $3,000 | $3,000 | $3,000 | $3,000 | $3,000 | $3,000 | $3,000 | $3,000 | |
| Payroll Taxes | 15% | $1,890 | $1,890 | $1,890 | $1,890 | $1,890 | $1,890 | $1,890 | $1,890 | $1,890 | $1,890 | $1,890 | $1,890 |
| Other | $0 | $0 | $0 | $0 | $0 | $0 | $0 | $0 | $0 | $0 | $0 | $0 | |
| Total Operating Expenses | $18,230 | $18,230 | $18,230 | $18,230 | $18,230 | $18,230 | $18,230 | $18,230 | $18,230 | $18,230 | $18,230 | $18,230 | |
| Profit Before Interest and Taxes | ($4,230) | ($4,230) | ($3,230) | ($1,710) | ($1,430) | $1,690 | $2,070 | $1,830 | $3,970 | $3,770 | $5,770 | $6,270 | |
| EBITDA | ($3,990) | ($3,990) | ($2,990) | ($1,470) | ($1,190) | $1,930 | $2,310 | $2,070 | $4,210 | $4,010 | $6,010 | $6,510 | |
| Interest Expense | $824 | $814 | $804 | $794 | $784 | $774 | $765 | $755 | $745 | $735 | $725 | $715 | |
| Taxes Incurred | ($1,516) | ($1,513) | ($1,210) | ($751) | ($664) | $275 | $392 | $323 | $968 | $911 | $1,513 | $1,666 | |
| Net Profit | ($3,537) | ($3,531) | ($2,824) | ($1,753) | ($1,550) | $641 | $914 | $753 | $2,258 | $2,125 | $3,531 | $3,888 | |
| Net Profit/Sales | -18.62% | -18.58% | -14.12% | -7.97% | -6.46% | 2.33% | 3.05% | 2.51% | 6.84% | 6.25% | 9.81% | 9.97% | |
| Pro Forma Cash Flow | |||||||||||||
| Month 1 | Month 2 | Month 3 | Month 4 | Month 5 | Month 6 | Month 7 | Month 8 | Month 9 | Month 10 | Month 11 | Month 12 | ||
| Cash Received | |||||||||||||
| Cash from Operations | |||||||||||||
| Cash Sales | $4,750 | $4,750 | $5,000 | $5,500 | $6,000 | $6,875 | $7,500 | $7,500 | $8,250 | $8,500 | $9,000 | $9,750 | |
| Cash from Receivables | $0 | $475 | $14,250 | $14,275 | $15,050 | $16,550 | $18,088 | $20,688 | $22,500 | $22,575 | $24,775 | $25,550 | |
| Subtotal Cash from Operations | $4,750 | $5,225 | $19,250 | $19,775 | $21,050 | $23,425 | $25,588 | $28,188 | $30,750 | $31,075 | $33,775 | $35,300 | |
| Additional Cash Received | |||||||||||||
| Sales Tax, VAT, HST/GST Received | 0.00% | $0 | $0 | $0 | $0 | $0 | $0 | $0 | $0 | $0 | $0 | $0 | $0 |
| New Current Borrowing | $0 | $0 | $0 | $0 | $0 | $0 | $0 | $0 | $0 | $0 | $0 | $0 | |
| New Other Liabilities (interest-free) | $0 | $0 | $0 | $0 | $0 | $0 | $0 | $0 | $0 | $0 | $0 | $0 | |
| New Long-term Liabilities | $0 | $0 | $0 | $0 | $0 | $0 | $0 | $0 | $0 | $0 | $0 | $0 | |
| Sales of Other Current Assets | $0 | $0 | $0 | $0 | $0 | $0 | $0 | $0 | $0 | $0 | $0 | $0 | |
| Sales of Long-term Assets | $0 | $0 | $0 | $0 | $0 | $0 | $0 | $0 | $0 | $0 | $0 | $0 | |
| New Investment Received | $0 | $0 | $0 | $0 | $0 | $0 | $0 | $0 | $0 | $0 | $0 | $0 | |
| Subtotal Cash Received | $4,750 | $5,225 | $19,250 | $19,775 | $21,050 | $23,425 | $25,588 | $28,188 | $30,750 | $31,075 | $33,775 | $35,300 | |
| Expenditures | Month 1 | Month 2 | Month 3 | Month 4 | Month 5 | Month 6 | Month 7 | Month 8 | Month 9 | Month 10 | Month 11 | Month 12 | |
| Expenditures from Operations | |||||||||||||
| Cash Spending | $12,600 | $12,600 | $12,600 | $12,600 | $12,600 | $12,600 | $12,600 | $12,600 | $12,600 | $12,600 | $12,600 | $12,600 | |
| Bill Payments | $157 | $4,697 | $4,700 | $4,999 | $5,435 | $5,541 | $6,443 | $6,738 | $12,520 | $18,899 | $20,331 | $19,808 | |
| Subtotal Spent on Operations | $12,757 | $17,297 | $17,300 | $17,599 | $18,035 | $18,141 | $19,043 | $19,338 | $25,120 | $31,499 | $32,931 | $32,408 | |
| Additional Cash Spent | |||||||||||||
| Sales Tax, VAT, HST/GST Paid Out | $0 | $0 | $0 | $0 | $0 | $0 | $0 | $0 | $0 | $0 | $0 | $0 | |
| Principal Repayment of Current Borrowing | $0 | $0 | $0 | $0 | $0 | $0 | $0 | $0 | $0 | $0 | $0 | $0 | |
| Other Liabilities Principal Repayment | $0 | $0 | $0 | $0 | $0 | $0 | $0 | $0 | $0 | $0 | $0 | $0 | |
| Long-term Liabilities Principal Repayment | $1,180 | $1,180 | $1,180 | $1,180 | $1,180 | $1,180 | $1,180 | $1,180 | $1,180 | $1,180 | $1,180 | $1,180 | |
| Purchase Other Current Assets | $0 | $0 | $0 | $0 | $0 | $0 | $0 | $0 | $0 | $0 | $0 | $0 | |
| Purchase Long-term Assets | $0 | $0 | $0 | $0 | $0 | $0 | $0 | $0 | $0 | $0 | $0 | $0 | |
| Dividends | $0 | $0 | $0 | $0 | $0 | $0 | $0 | $0 | $0 | $0 | $0 | $0 | |
| Subtotal Cash Spent | $13,937 | $18,477 | $18,480 | $18,779 | $19,215 | $19,321 | $20,223 | $20,518 | $26,300 | $32,679 | $34,111 | $33,588 | |
| Net Cash Flow | ($9,187) | ($13,252) | $770 | $996 | $1,835 | $4,104 | $5,365 | $7,670 | $4,450 | ($1,604) | ($336) | $1,712 | |
| Cash Balance | $95,513 | $82,261 | $83,031 | $84,027 | $85,862 | $89,966 | $95,331 | $103,000 | $107,451 | $105,847 | $105,511 | $107,223 | |
| Pro Forma Balance Sheet | |||||||||||||
| Month 1 | Month 2 | Month 3 | Month 4 | Month 5 | Month 6 | Month 7 | Month 8 | Month 9 | Month 10 | Month 11 | Month 12 | ||
| Assets | Starting Balances | ||||||||||||
| Current Assets | |||||||||||||
| Cash | $104,700 | $95,513 | $82,261 | $83,031 | $84,027 | $85,862 | $89,966 | $95,331 | $103,000 | $107,451 | $105,847 | $105,511 | $107,223 |
| Accounts Receivable | $0 | $14,250 | $28,025 | $28,775 | $31,000 | $33,950 | $38,025 | $42,438 | $44,250 | $46,500 | $49,425 | $51,650 | $55,350 |
| Inventory | $60,000 | $55,000 | $50,000 | $45,000 | $39,520 | $32,320 | $24,740 | $15,040 | $10,934 | $11,880 | $13,200 | $13,200 | $15,950 |
| Other Current Assets | $0 | $0 | $0 | $0 | $0 | $0 | $0 | $0 | $0 | $0 | $0 | $0 | $0 |
| Total Current Assets | $164,700 | $164,763 | $160,286 | $156,806 | $154,547 | $152,132 | $152,731 | $152,808 | $158,184 | $165,831 | $168,472 | $170,361 | $178,523 |
| Long-term Assets | |||||||||||||
| Long-term Assets | $20,000 | $20,000 | $20,000 | $20,000 | $20,000 | $20,000 | $20,000 | $20,000 | $20,000 | $20,000 | $20,000 | $20,000 | $20,000 |
| Accumulated Depreciation | $0 | $240 | $480 | $720 | $960 | $1,200 | $1,440 | $1,680 | $1,920 | $2,160 | $2,400 | $2,640 | $2,880 |
| Total Long-term Assets | $20,000 | $19,760 | $19,520 | $19,280 | $19,040 | $18,800 | $18,560 | $18,320 | $18,080 | $17,840 | $17,600 | $17,360 | $17,120 |
| Total Assets | $184,700 | $184,523 | $179,806 | $176,086 | $173,587 | $170,932 | $171,291 | $171,128 | $176,264 | $183,671 | $186,072 | $187,721 | $195,643 |
| Liabilities and Capital | Month 1 | Month 2 | Month 3 | Month 4 | Month 5 | Month 6 | Month 7 | Month 8 | Month 9 | Month 10 | Month 11 | Month 12 | |
| Current Liabilities | |||||||||||||
| Accounts Payable | $0 | $4,541 | $4,534 | $4,818 | $5,252 | $5,326 | $6,224 | $6,328 | $11,891 | $18,220 | $19,677 | $18,974 | $24,188 |
| Current Borrowing | $0 | $0 | $0 | $0 | $0 | $0 | $0 | $0 | $0 | $0 | $0 | $0 | $0 |
| Other Current Liabilities | $0 | $0 | $0 | $0 | $0 | $0 | $0 | $0 | $0 | $0 | $0 | $0 | $0 |
| Subtotal Current Liabilities | $0 | $4,541 | $4,534 | $4,818 | $5,252 | $5,326 | $6,224 | $6,328 | $11,891 | $18,220 | $19,677 | $18,974 | $24,188 |
| Long-term Liabilities | $100,000 | $98,820 | $97,640 | $96,460 | $95,280 | $94,100 | $92,920 | $91,740 | $90,560 | $89,380 | $88,200 | $87,020 | $85,840 |
| Total Liabilities | $100,000 | $103,361 | $102,174 | $101,278 | $100,532 | $99,426 | $99,144 | $98,068 | $102,451 | $107,600 | $107,877 | $105,994 | $110,028 |
| Paid-in Capital | $100,000 | $100,000 | $100,000 | $100,000 | $100,000 | $100,000 | $100,000 | $100,000 | $100,000 | $100,000 | $100,000 | $100,000 | $100,000 |
| Retained Earnings | ($15,300) | ($15,300) | ($15,300) | ($15,300) | ($15,300) | ($15,300) | ($15,300) | ($15,300) | ($15,300) | ($15,300) | ($15,300) | ($15,300) | ($15,300) |
| Earnings | $0 | ($3,537) | ($7,068) | ($9,892) | ($11,645) | ($13,194) | ($12,553) | ($11,640) | ($10,887) | ($8,629) | ($6,505) | ($2,973) | $915 |
| Total Capital | $84,700 | $81,163 | $77,632 | $74,808 | $73,056 | $71,506 | $72,147 | $73,060 | $73,813 | $76,071 | $78,195 | $81,727 | $85,615 |
| Total Liabilities and Capital | $184,700 | $184,523 | $179,806 | $176,086 | $173,587 | $170,932 | $171,291 | $171,128 | $176,264 | $183,671 | $186,072 | $187,721 | $195,643 |
| Net Worth | $84,700 | $81,163 | $77,632 | $74,808 | $73,056 | $71,506 | $72,147 | $73,060 | $73,813 | $76,071 | $78,195 | $81,727 | $85,615 |


