
Mirabile Dictu Advertising
Executive Summary
Mirabile Dictu Advertising, LLC (MDA) principal operators are former marketers, producers and sellers of hardware goods and have combined over 55 years experience in the hardware Industry. Experience ranging from marketing services, to national brand advertising to retailer operations. The firm is being formally founded to provide an advertising program sought after by national brands and desired by industry retailers.
Competitive edge is demonstrated in the firm’s expertise in positioning value to retailers to gain endorsement and positioning of enhanced support to national brands to gain participation. The firm will be an advertising based company meeting the awareness needs of both retailers and national brands. The firm will be focused on a core competency of providing advertising promotions.
Advertising will be placed in selected stores for national brand items. These “advertising” tools will be put into the stores, where 70% of purchase decisions are made. Brands will pay all fees and costs of these promotional programs. Hardware retailers will be under contract to allow the firm to exclusively execute these promotions.
MDA has a business relationship with the industry leader in producing hand tools for retailers. The firm also has a business relationship with producers of widgets for retailers. The second item to be exploited will be power tools. A relationship is being fostered with Cott Equipment the industry’s leading provider of screwdrivers.
All of these partner companies have excellent relationships with retailers. Their products are excellent promotional items due to household usage benefits and their promotional demand. Exploiting the relationship with these manufacturers and their retailers will catapult Retailer contracts faster and more effectively.
Our key to success will be to utilize key relationships to penetrate national brand key decision makers. The firm will price services at the middle tier of what the market will bear, providing enhanced advertising compared to other marketers. The pricing fits with the general positioning of the firm as providing a high-value advertising with in-house expertise and costs.
Sales estimates project revenues of tripling between the first year and the year three. The firm does not anticipate any cash flow issues.
Mirabile Dictu is offering up to 40% ownership of the company to one well-heeled outside investor/owner with a dressed-to-the-nines offer of investment capital. This owner/investor will share in the annual dividends. Mirabile Dictu Advertising, LLC will be created as a Nebraska LLC based in Creighton County, owned by its principal operators and sole principal investor.

1.1 Objectives
- To saturate advertising opportunities with hardware retailers in the retail goods industry. Within the next twelve months it is the objective of the company to market our services to the top five targeted hardware retailers and to establish a business relationship with at least three of them. This will grow to five retailers in the second year and seven in the third year.
- Sales for the first full calendar year will be {$whopper}.
- A second target group of retailers will be contacted in the third quarter of year one with plans to established business with two additional retailers for 2006.
- Sales for the second full year will be {$ginormouz}.
- A third group of retailers will be targeted in the third quarter of year two with a business relationship to be formed with two additional retailers for year three.
- Sales for the third full year will be {$humuongorificatious}.
1.2 Mission
Mirabile Dictu Advertising, LLC is an advertising company dedicated exclusively to advertising programs for national brands. These promotions are for key products found in the hardware store. The sole business purpose is to provide a new avenue of promotional effectiveness for brands so they can secure incremental merchandising with key hardware retailers. This is accomplished by bundling brands together with synergistic products with tie-in advertising.
1.3 Keys to Success
The founders have over 55 years of experience with hardware companies in the hardware industry, including sales and marketing companies, national manufacturers and hardware retailers.
Industry Expertise:
McKenzie Bossard– over 25 years in the hardware industry. Past three years as VP Sales and Marketing with USA Hardware, has successfully provided services for brands and has generated over $2.2 million in revenue. Prior experience as VP of Advertising, with Advertising Specialists Corp, managed $960 million in advertising sales at USA Advertising with a team of 110 seasoned professionals. USAA was the largest advertiser to USA Hardware representing an estimated 7% of sales. Prior to this, Region Manager for SEUS Hardware and managed all advertising sales for the southeast US.
Fernando Hearndon – over 31 years in the hardware industry. 25 years with SEUS, experience in managing sales and profit with $1.0 billion in sales with a profit margin of 30% and sales growth of 5.6%. Also was responsible for development and management of private label products with sales increase of around 22% with 40% increase in profit, again while other categories were declining.
Excellence in fulfilling the promise to grow sales with key clients with completely confidential, reliable, trustworthy expertise and solid execution.
- Key relationships to generate new business leads with prospects.
- Leverage from pool of expertise branding, advertising and retailing, into proven revenue generating opportunities.
Company Summary
Mirabile Dictu Advertising, LLC is a start-up owned and operated by two seasoned hardware industry professionals. Both have extensive experience in the hardware industry and have maintained excellent reputations in the industry for over 55 combined years. In addition, these professionals are highly motivated and fully capable of handling the sales/management and finance/administration areas, respectively.
2.1 Company Ownership
Mirabile Dictu Advertising, LLC will be created as a Nebraska based LLC in Creighton County, owned by its two principal owner/operators and one owner/investor. As of this writing, it has not been chartered.
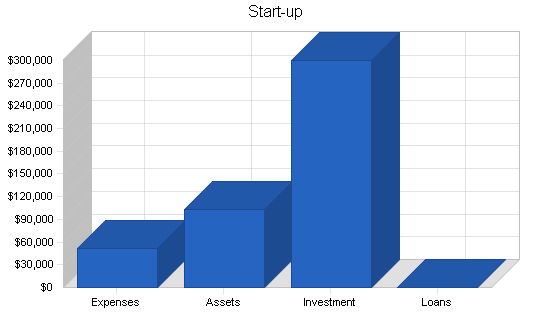
2.2 Start-up Summary
The firm’s founders, McKenzie Bossard and Fernando Hearndon, will handle day-to-day operations of the business and will focus on generating advertising sales and sales leads with prospects. McKenzie and Fernando will be focused on sales execution and will work collaboratively to ensure that this business venture is a success.
It is estimated that the start-up costs before the company opens for business will include legal costs, stationery, insurance, home office, computers, and related expenses. These start-up costs are to be covered from the capital provided by the founders and an investor. The table below identifies the total start-up expenses anticipated during the first six months of operations and includes the initial start-up costs as noted above.
| Start-up | |
| Requirements | |
| Start-up Expenses | |
| Legal Start-up & LLC Formation | $5,000 |
| Administrative/Financial | $10,500 |
| Stationery etc. | $2,500 |
| Liability Insurance | $6,500 |
| Office Equipment/Supplies/Services | $3,000 |
| Computer Equipment | $8,000 |
| Travel to Prospective Clients | $15,000 |
| Industry Associations/Publications etc. | $1,500 |
| Total Start-up Expenses | $52,000 |
| Start-up Assets | |
| Cash Required | $103,000 |
| Other Current Assets | $0 |
| Long-term Assets | $0 |
| Total Assets | $103,000 |
| Total Requirements | $155,000 |
Brought to you by
Create a professional business plan
Using AI and step-by-step instructions
Create Your PlanSecure funding
Validate ideas
Build a strategy
Services
Mirabile Dictu Advertising, LLC will provide expertise and execution of advertising that support brands. Our sole purpose is to generate advertising sales by growing client sales. By advertising these products together, we will increase consumer awareness and increase sales.
Market Analysis Summary
The methodology for MDA is focused on the top two things that influence a consumer’s purchase decision. Brands have spent over $330 million last year on advertising and 84% of this was ineffective.
Advertising in-store where 70% of purchase decisions are made is key. Independent research by the Kiplinger Study found that “advertising can increase sales on a brand by 85%, and can also increase consumer shopping basket rings by 84%“.
4.1 Market Segmentation
The experience of the firm is that the hardware trade is the most fertile; therefore, the most sales and profit can be gleaned in hardware. There are currently 15 retailers in this channel that are potential partner retailers. The firm has targeted to add four each year. Beyond the hardware class are several other trade classes that show promising possibility.
Hardware – more retailers are in the traditional hardware class of trade and this is where most of the current targeted advertising takes place. It is estimated that 75% of advertising in the industry travels through “hardware” stores.
Small – this class of trade is growing by leaps and bounds mostly driven by growth of Wal-Mart. Some erosion has taken place due to reorganization of Kmart.
Medium – growth of specialty stores such as PetSmart and PETCO will be fertile ground for promotions in pet care supplies and toys.
Large – growth of Staples, Office Depot and Office Max lend well to promotions due to growth of small businesses and their office supply needs.
Chain – continued growth in Home Depot and Lowe’s sales due to their expansion will fuel opportunity in home supplies, paint and tool needs.
Franchise – consolidation in the auto industry will drive shoppers to fewer outlets such as Auto Zone, Discount/Advance Auto and Pep Boys.
Home Health Care – consolidation in the drug stores with the departure of Eckerd will drive opportunities in drug class.
Kiosk – with the growth of new electronic devices, there is great potential for success in retailers such as Best Buy and Circuit City.

| Market Analysis | |||||||
| Year 1 | Year 2 | Year 3 | Year 4 | Year 5 | |||
| Potential Customers | Growth | CAGR | |||||
| Small stores | 5% | 15 | 15 | 15 | 15 | 15 | 0.00% |
| Medium stores | 15% | 2 | 2 | 2 | 2 | 2 | 0.00% |
| Large stores | 7% | 2 | 2 | 2 | 2 | 2 | 0.00% |
| Chain stores | 6% | 3 | 3 | 3 | 3 | 3 | 0.00% |
| Franchise stores | 8% | 3 | 3 | 3 | 3 | 3 | 0.00% |
| Home Health Care stores | 5% | 2 | 2 | 2 | 2 | 2 | 0.00% |
| Kiosk stores | 4% | 3 | 3 | 3 | 3 | 3 | 0.00% |
| Department stores | 4% | 3 | 3 | 3 | 3 | 3 | 0.00% |
| Total | 0.00% | 33 | 33 | 33 | 33 | 33 | 0.00% |
4.2 Target Market Segment Strategy
The core expertise and “low hanging fruit” is with the hardware class of trade. The financial rewards are greatest in this class due to the size and advertising monies spent for promotions. A full and complete understanding of industry branded goals, objectives and spending processes as well as how to apply these principles with key hardware retailers makes this segment the most valuable. As the firm expands across the hardware trade and brings this class to maturity, it will expand ventures into the other classes starting with those with financial rewards and funding practices most simular to that of the hardware Industry.
4.3 Service Business Analysis
The advertising industry is full of companies that provide “consumer advertising” opportunities that do not meet the specific need of retailers or brands at the same time. With current programs it is usually not a win/win situation for retailers and brands together, as most times one will gain benefit at the expense of the other.
Mirabile Dictu Advertising will provide a very specific service that fits a wide variety of brand and retailer objectives. This program is truly is a win/win situation for both national brands and retailers.
4.3.1 Competition and Buying Patterns
In the co-marketing industry, brands decide the best spend for the return on the investment. With the firm providing advertising programs, brands are guaranteed to deliver their message to their targeted consumer in the desired retailer on the desired aisle at the desired time. With better targeting, brands have less fall-out and therefore a better return on their promotional investment.
Since the retailer is also benefiting on their sales, they traditionally support the brand more by providing additional purchases of inventory for display…a true win/win!
Strategy and Implementation Summary
Emphasize performance
Mirabile Dictu will differentiate ourselves with performance! We will establish our business offering as a clear and viable alternative for the target market, from the scores of “average” advertising programs.
Build a relationship-oriented business
Build long-term relationships with customers, not single-visit deals. Become the company of choice. Make them understand the value of the relationship.
Focus on target markets
The firm will focus on specific retailers as the key market segment we should own.
5.1 Competitive Edge
Mirabile Dictu Advertising’s competitive edge is demonstrated in the firm’s expertise in positioning value to retailers to gain endorsement and positioning enhanced support to brands to gain participation.
The firm is thoroughly experienced in brand funding, retailer advertising and sales. The extensive senior contacts within the branded community as well as with management at hardware retailers will deliver.
The competitive edge of the the firm takes advantage of the knowledge that sales growth is the #1 business objective for most retailers in the hardware industry. Extensive knowledge in sales, profit and execution advertising guidelines gives the firm unmatched expertise in selling and managing key advertising programs.
Clearly, the competitive edge is the customer service experience and approach that the management team will bring to the table. The knowledgeable, smiling, unassuming and good natured approach to all customers is paramount, and highly valuable. Action plans are detailed, specific and to the point with an open-minded approach.
5.2 Milestones
The Milestones set forth below are the main milestones in the schedule of proposed development. We have carefully reviewed the timelines for start-up and firmly believe that once we are completely funded we can be “open for business”.
- Secure working agreement to execute program
- Secure contract to launch program
- Secure agreement for extended terms and loner equipment as needed
- Secure contract for Dominick and Randall.
- Install loaner equipment to execute – Stop & Shop initiative.

| Milestones | |||||
| Milestone | Start Date | End Date | Budget | Manager | Department |
| hand tool agreement | 12/30/2004 | 1/30/2005 | $600 | McKenzie | Department |
| power tool agreement | 12/30/2004 | 3/30/2005 | $1,200 | McKenzie/ Fernando | Department |
| pool supplies | 12/30/2004 | 1/30/2007 | $500 | McKenzie | Department |
| plumbing supplies | 12/30/2004 | 6/30/2006 | $1,250 | McKenzie/ Fernando | Department |
| heavy equipment | 12/30/2004 | 1/30/2006 | $600 | McKenzie | Department |
| fasteners | 12/30/2004 | 9/30/2005 | $1,200 | McKenzie | Department |
| Other | 12/30/2004 | 1/30/2005 | $0 | Fernando | Department |
| Totals | $5,350 | ||||
5.3 Sales Strategy
Sales strategy begins with contact at a targeted retailer to secure a five year contract to provide for execution of the advertising promotions. Once under contract, “prospects” are identified and brands targeted. The firm starts “selling” at the senior level with national brands by exploiting our relationships with key players.
Brought to you by
Create a professional business plan
Using AI and step-by-step instructions
Create Your PlanSecure funding
Validate ideas
Build a strategy
In respect to the prospect list of clients, it is essential that an “advertising” approach be adopted to insure an organized, orderly approach to each prospect. Notes need to be kept on each client. Follow-up and persistence will pay off. With our experience in the industry, we have a key knowledge of how to close sales with the shortest lead-time.
Sales people will be compensated with a commission paid on each sale to stimulate reward and recognition.
All fees are paid by brands and retailers for participation.
5.3.1 Sales Forecast
Sales forecasts for the first three years are as follows. MDA plans to deliver sales of approximately {$whopper} in the first year. Sales of {$ginormouz} in the second year by retaining the current clients and by adding four additional clients. Sales of {$humuongorificatious} in the third year by retaining current clients and by adding four additional clients. These projections are conservative and do NOT factor in sales derived from the additional relationships that would add some related advertising to the mix. The firm plans on adding advertising to the mix at new retailers as each mature in execution.


| Sales Forecast | |||
| Year 1 | Year 2 | Year 3 | |
| Sales | |||
| Hand Tools | $400,000 | $400,000 | $400,000 |
| Power Tools | $400,000 | $400,000 | $400,000 |
| Mechanic Sets | $500,000 | $500,000 | $500,000 |
| Tool Boxes/Carriers | $0 | $200,000 | $200,000 |
| Heavy Lawn Equipment | $0 | $300,000 | $300,000 |
| Plumbing | $0 | $250,000 | $250,000 |
| Auto Hardware | $0 | $500,000 | $500,000 |
| Painting Supplies | $0 | $0 | $400,000 |
| Fasteners | $0 | $0 | $400,000 |
| Patio Door Repair | $0 | $0 | $25,000 |
| Pool Supplies | $0 | $0 | $25,000 |
| Total Sales | $1,300,000 | $2,550,000 | $3,400,000 |
| Direct Cost of Sales | Year 1 | Year 2 | Year 3 |
| Sign Prtg/Dist (Est 50% of Revenue) | $650,000 | $1,275,000 | $1,700,000 |
| Other | $0 | $0 | $0 |
| Subtotal Direct Cost of Sales | $650,000 | $1,275,000 | $1,700,000 |
5.4 Marketing Strategy
The key Marketing Strategy is first to let the retailer do the selling to the brands. Keying in on the value positioning with retailers gets the message to the most brands in the quickest time-line.
Other industry strategies for marketing the opportunities can be done in a number of ways:
- Internet Website – Much research is done via the Web and the firm will post a very effective website that will demonstrate value, effectiveness and advertising benefits to retailers and national brand prospects.
- Trade Advertising – Most brand managers read industry trade publications for new and innovative programs. Placing ads in these publications will cover category across many brands.
- HRMA – Joining the Hardware Retailers and Manufacturers Assoc. and attending the annual conventions to meet with senior managers of retailers and national brand companies.
- Private Associations – Another image-building marketing ploy is participating in showcases. These showcases are usually for the benefit of brand suppliers.
Marketing these prime prospects must be carried out in a thoughtful organized way. Color literature including the newly designed logo should be completed as a first step. When marketing these prospects it will be important to present a portfolio of program samples and historical results. A relaxed face-to-face meeting, resulting in good communication should be all that’s needed to generate first contracts.
Management Summary
The Management Summary of the firm identifies two main principals, McKenzie Bossard and Fernando Hearndon. These owner/operators have impeccable credentials in this industry. This will benefit the firm in two predominate ways:
- Clients will be brought from relations in past history, and
- The experience each has will attract new clients.
McKenzie Bossard has extensive experience in sales, marketing, and management within the hardware industry. Fernando Hearndon has extensive experience in the area of promotional advertising as well as finance and administration. Both have extensive relationships in the industry that will be very valuable.
6.1 Personnel Plan
As the Personnel Plan shows, the company expects to make gradual investments in sales related personnel over the next three years, always keeping in mind that the number of sales people is directly related to the number of retailers advertising, brands available and the available “inventory” to sell to brands.
Mirabile Dictu Advertising will start out with two sales people exclusive of the owner/operators and will add one additional person in year two and one additional person in year three. These sales people are paid a commission of 10% of their sales. The firm also has contacts necessary to “farm out” ad hoc needs to local contractors, in lieu of full time people, as demand warrants.
| Personnel Plan | |||
| Year 1 | Year 2 | Year 3 | |
| Bossard | $101,000 | $75,000 | $75,000 |
| Hearndon | $101,000 | $60,000 | $60,000 |
| Sales People | $130,000 | $255,000 | $340,000 |
| Total People | 4 | 5 | 6 |
| Total Payroll | $332,000 | $390,000 | $475,000 |
Financial Plan
The plan of Mirabile Dictu is based on conservative estimates and assumptions. While the firm shows strong financials, the capital investment is needed to make the financials work.
7.1 Start-up Funding
Mirabile Dictu Advertising, LLC start-up costs are detailed above, in the Start-up Table. The following table shows how these start-up costs will be funded by owner and investor capital.
| Start-up Funding | |
| Start-up Expenses to Fund | $52,000 |
| Start-up Assets to Fund | $103,000 |
| Total Funding Required | $155,000 |
| Assets | |
| Non-cash Assets from Start-up | $0 |
| Cash Requirements from Start-up | $103,000 |
| Additional Cash Raised | $145,000 |
| Cash Balance on Starting Date | $248,000 |
| Total Assets | $248,000 |
| Liabilities and Capital | |
| Liabilities | |
| Current Borrowing | $0 |
| Long-term Liabilities | $0 |
| Accounts Payable (Outstanding Bills) | $0 |
| Other Current Liabilities (interest-free) | $0 |
| Total Liabilities | $0 |
| Capital | |
| Planned Investment | |
| Bossard | $50,000 |
| Hearndon | $50,000 |
| Investor | $200,000 |
| Additional Investment Requirement | $0 |
| Total Planned Investment | $300,000 |
| Loss at Start-up (Start-up Expenses) | ($52,000) |
| Total Capital | $248,000 |
| Total Capital and Liabilities | $248,000 |
| Total Funding | $300,000 |
7.2 The Investment Offering
Mirabile Dictu is offering up to 40% ownership of the company to one outside investor/owner with an investment of a minimum $200,000 in investment capital. This owner/investor will share in the annual dividends. Mirabile Dictu Advertising, LLC will be created as a Nebraska LLC based in Creighton County, owned by its principal operators and sole principal investor.
| Investment Offering | |||||
| Proposed Year: | 2005 | 2006 | 2007 | 2010 | |
| Valuation, Investment, Shares | |||||
| Investment Amount | $200,000 | $0 | $0 | ||
| Equity Share Offering Percentage | 40.00% | 0.00% | 0.00% | ||
| Valuation | $500,000 | $0 | $0 | $3,500,000 | |
| Investor Exit Payout | $1,400,000 | $0 | $0 | ||
| Investor Years Until Exit | 5 | 4 | 3 | ||
| Investor IRR | 47.58% | 0.00% | 0.00% | ||
| Share Ownership | Year 2005 | Year 2006 | Year 2007 | Year 2010 | |
| Founders’ Shares | 200,000 | 200,000 | 200,000 | 200,000 | |
| Stock Split Multiple | 0 | 0 | 0 | ||
| Stock Options Issued | 0 | 0 | 0 | 0 | |
| Investor Shares Issued | 133,333 | 0 | 0 | ||
| Price per share | $1.50 | $0.00 | $0.00 | $10.50 | |
| Options Holders’ Shares | 0 | 0 | 0 | 0 | |
| Year 2005 Investors’ Shares | 133,333 | 133,333 | 133,333 | 133,333 | |
| Year 2006 Investors’ Shares | 0 | 0 | 0 | ||
| Year 2007 Investors’ Shares | 0 | 0 | |||
| Total Shares Outstanding | 333,333 | 333,333 | 333,333 | 333,333 | |
| Equity Ownership Percentage | Year 2005 | Year 2006 | Year 2007 | Year 2010 | |
| Founders’ Equity | 60.00% | 60.00% | 60.00% | 60.00% | |
| Option Holders’ Equity | 0.00% | 0.00% | 0.00% | 0.00% | |
| Year 2005 Investors’ Equity | 40.00% | 40.00% | 40.00% | 40.00% | |
| Year 2006 Investors’ Equity | 0.00% | 0.00% | 0.00% | ||
| Year 2007 Investors’ Equity | 0.00% | 0.00% | |||
| Total Equity | 100.00% | 100.00% | 100.00% | 100.00% | |
| Investors’ Equity | 40.00% | 40.00% | 40.00% | 40.00% | |
| Founders’ & Employees’ Equity | 60.00% | 60.00% | 60.00% | 60.00% | |
7.3 Important Assumptions
- We are assuming steady growth from good management, barring any unforseen local, or national disasters such as the economic slowdown seen by most of the country following the September 11th, 2001 tragedies.
- We are assuming adequate infusion of owner/investor funding to sustain the firm during start-up.
- The owner/investor will be making a capital investment for a percentage of the firm and will receive annual dividend payments.
7.4 Break-even Analysis
The Break-even Analysis is based on the average of the first-year figures for total sales by promotion, and by operating expenses. These are presented as verage percent variable cost, estimated monthly fixed costs, and monthly revenue break-even. These conservative assumptions make for a more accurate estimate of real risk.

| Break-even Analysis | |
| Monthly Revenue Break-even | $83,600 |
| Assumptions: | |
| Average Percent Variable Cost | 50% |
| Estimated Monthly Fixed Cost | $41,800 |
7.5 Projected Profit and Loss
Projected annual estimates of cumulative Profit and Loss of the firm are included here. The detailed monthly pro-forma income statement for the first year is included in the appendix.
The total “Direct Cost of Sales” as Advertising Printing and Distribution costs is estimated at 50% of revenue. There is no risk in assuming these costs without having sufficient revenue on-hand to cover expenses.
Brought to you by
Create a professional business plan
Using AI and step-by-step instructions
Create Your PlanSecure funding
Validate ideas
Build a strategy
Marketing Expenses are estimated at 10% of sales revenue or less.


| Pro Forma Profit and Loss | |||
| Year 1 | Year 2 | Year 3 | |
| Sales | $1,300,000 | $2,550,000 | $3,400,000 |
| Direct Cost of Sales | $650,000 | $1,275,000 | $1,700,000 |
| Other Costs of Sales | $0 | $0 | $0 |
| Total Cost of Sales | $650,000 | $1,275,000 | $1,700,000 |
| Gross Margin | $650,000 | $1,275,000 | $1,700,000 |
| Gross Margin % | 50.00% | 50.00% | 50.00% |
| Expenses | |||
| Payroll | $332,000 | $390,000 | $475,000 |
| Marketing/Promotion | $130,000 | $255,000 | $340,000 |
| Depreciation | $0 | $0 | $0 |
| Rent | $9,000 | $66,000 | $66,000 |
| Utilities | $3,600 | $4,000 | $4,000 |
| Insurance | $3,000 | $4,500 | $6,000 |
| Payroll Taxes | $0 | $0 | $0 |
| Travel | $24,000 | $35,000 | $45,000 |
| Total Operating Expenses | $501,600 | $754,500 | $936,000 |
| Profit Before Interest and Taxes | $148,400 | $520,500 | $764,000 |
| EBITDA | $148,400 | $520,500 | $764,000 |
| Interest Expense | $0 | $0 | $0 |
| Taxes Incurred | $0 | $0 | $0 |
| Net Profit | $148,400 | $520,500 | $764,000 |
| Net Profit/Sales | 11.42% | 20.41% | 22.47% |
7.6 Projected Cash Flow
The cash flow projection shows that provisions for ongoing expenses are adequate to meet the needs of the firm as the business generates sufficient cash flow to support operations. Clients pay within 60 day after their promotion.

| Pro Forma Cash Flow | |||
| Year 1 | Year 2 | Year 3 | |
| Cash Received | |||
| Cash from Operations | |||
| Cash Sales | $0 | $0 | $0 |
| Cash from Receivables | $1,040,000 | $2,300,000 | $3,230,000 |
| Subtotal Cash from Operations | $1,040,000 | $2,300,000 | $3,230,000 |
| Additional Cash Received | |||
| Sales Tax, VAT, HST/GST Received | $0 | $0 | $0 |
| New Current Borrowing | $0 | $0 | $0 |
| New Other Liabilities (interest-free) | $0 | $0 | $0 |
| New Long-term Liabilities | $0 | $0 | $0 |
| Sales of Other Current Assets | $0 | $0 | $0 |
| Sales of Long-term Assets | $0 | $0 | $0 |
| New Investment Received | $0 | $0 | $0 |
| Subtotal Cash Received | $1,040,000 | $2,300,000 | $3,230,000 |
| Expenditures | Year 1 | Year 2 | Year 3 |
| Expenditures from Operations | |||
| Cash Spending | $332,000 | $390,000 | $475,000 |
| Bill Payments | $657,110 | $1,532,483 | $2,075,274 |
| Subtotal Spent on Operations | $989,110 | $1,922,483 | $2,550,274 |
| Additional Cash Spent | |||
| Sales Tax, VAT, HST/GST Paid Out | $0 | $0 | $0 |
| Principal Repayment of Current Borrowing | $0 | $0 | $0 |
| Other Liabilities Principal Repayment | $0 | $0 | $0 |
| Long-term Liabilities Principal Repayment | $0 | $0 | $0 |
| Purchase Other Current Assets | $0 | $0 | $0 |
| Purchase Long-term Assets | $0 | $0 | $0 |
| Dividends | $30,000 | $100,000 | $200,000 |
| Subtotal Cash Spent | $1,019,110 | $2,022,483 | $2,750,274 |
| Net Cash Flow | $20,890 | $277,517 | $479,726 |
| Cash Balance | $268,890 | $546,407 | $1,026,133 |
7.7 Projected Balance Sheet
The balance sheet shows healthy growth of net worth, and strong financial position. The monthly estimates are included in the appendix.
| Pro Forma Balance Sheet | |||
| Year 1 | Year 2 | Year 3 | |
| Assets | |||
| Current Assets | |||
| Cash | $268,890 | $546,407 | $1,026,133 |
| Accounts Receivable | $260,000 | $510,000 | $680,000 |
| Other Current Assets | $0 | $0 | $0 |
| Total Current Assets | $528,890 | $1,056,407 | $1,706,133 |
| Long-term Assets | |||
| Long-term Assets | $0 | $0 | $0 |
| Accumulated Depreciation | $0 | $0 | $0 |
| Total Long-term Assets | $0 | $0 | $0 |
| Total Assets | $528,890 | $1,056,407 | $1,706,133 |
| Liabilities and Capital | Year 1 | Year 2 | Year 3 |
| Current Liabilities | |||
| Accounts Payable | $162,490 | $269,507 | $355,233 |
| Current Borrowing | $0 | $0 | $0 |
| Other Current Liabilities | $0 | $0 | $0 |
| Subtotal Current Liabilities | $162,490 | $269,507 | $355,233 |
| Long-term Liabilities | $0 | $0 | $0 |
| Total Liabilities | $162,490 | $269,507 | $355,233 |
| Paid-in Capital | $300,000 | $300,000 | $300,000 |
| Retained Earnings | ($82,000) | ($33,600) | $286,900 |
| Earnings | $148,400 | $520,500 | $764,000 |
| Total Capital | $366,400 | $786,900 | $1,350,900 |
| Total Liabilities and Capital | $528,890 | $1,056,407 | $1,706,133 |
| Net Worth | $366,400 | $786,900 | $1,350,900 |
7.8 Business Ratios
The company’s projected business ratios are provided in the table below. The final column, Industry Profile, shows significant ratios for the Sales and Promotions Industry, as determined by the Standard Industry Classification (SIC) code 8743.9904.
| Ratio Analysis | ||||
| Year 1 | Year 2 | Year 3 | Industry Profile | |
| Sales Growth | 0.00% | 96.15% | 33.33% | 6.42% |
| Percent of Total Assets | ||||
| Accounts Receivable | 49.16% | 48.28% | 39.86% | 22.51% |
| Other Current Assets | 0.00% | 0.00% | 0.00% | 48.43% |
| Total Current Assets | 100.00% | 100.00% | 100.00% | 73.42% |
| Long-term Assets | 0.00% | 0.00% | 0.00% | 26.58% |
| Total Assets | 100.00% | 100.00% | 100.00% | 100.00% |
| Current Liabilities | 30.72% | 25.51% | 20.82% | 26.78% |
| Long-term Liabilities | 0.00% | 0.00% | 0.00% | 13.27% |
| Total Liabilities | 30.72% | 25.51% | 20.82% | 40.05% |
| Net Worth | 69.28% | 74.49% | 79.18% | 59.95% |
| Percent of Sales | ||||
| Sales | 100.00% | 100.00% | 100.00% | 100.00% |
| Gross Margin | 50.00% | 50.00% | 50.00% | 100.00% |
| Selling, General & Administrative Expenses | 38.58% | 29.59% | 27.53% | 80.13% |
| Advertising Expenses | 0.00% | 0.00% | 0.00% | 1.19% |
| Profit Before Interest and Taxes | 11.42% | 20.41% | 22.47% | 2.46% |
| Main Ratios | ||||
| Current | 3.25 | 3.92 | 4.80 | 2.06 |
| Quick | 3.25 | 3.92 | 4.80 | 1.71 |
| Total Debt to Total Assets | 30.72% | 25.51% | 20.82% | 52.88% |
| Pre-tax Return on Net Worth | 40.50% | 66.15% | 56.55% | 5.19% |
| Pre-tax Return on Assets | 28.06% | 49.27% | 44.78% | 11.01% |
| Additional Ratios | Year 1 | Year 2 | Year 3 | |
| Net Profit Margin | 11.42% | 20.41% | 22.47% | n.a |
| Return on Equity | 40.50% | 66.15% | 56.55% | n.a |
| Activity Ratios | ||||
| Accounts Receivable Turnover | 5.00 | 5.00 | 5.00 | n.a |
| Collection Days | 54 | 55 | 64 | n.a |
| Accounts Payable Turnover | 5.04 | 6.08 | 6.08 | n.a |
| Payment Days | 50 | 48 | 53 | n.a |
| Total Asset Turnover | 2.46 | 2.41 | 1.99 | n.a |
| Debt Ratios | ||||
| Debt to Net Worth | 0.44 | 0.34 | 0.26 | n.a |
| Current Liab. to Liab. | 1.00 | 1.00 | 1.00 | n.a |
| Liquidity Ratios | ||||
| Net Working Capital | $366,400 | $786,900 | $1,350,900 | n.a |
| Interest Coverage | 0.00 | 0.00 | 0.00 | n.a |
| Additional Ratios | ||||
| Assets to Sales | 0.41 | 0.41 | 0.50 | n.a |
| Current Debt/Total Assets | 31% | 26% | 21% | n.a |
| Acid Test | 1.65 | 2.03 | 2.89 | n.a |
| Sales/Net Worth | 3.55 | 3.24 | 2.52 | n.a |
| Dividend Payout | 0.20 | 0.19 | 0.26 | n.a |
7.9 Use of Funds
The table below briefly outlines the intended uses for the funds acquired through investment. The Start-up expenses are listed in more detail in the Start-up table. The largest portion is earmarked to cover operations expenses for the first few months as the company gains market share and contracts, and builds accounts receivable. The delay between invoicing of AR and the receipt of the Accounts Payables creates a cash flow lag which this investment cash reserve will cover.
| Use of Funds | |
| Use | Amount |
| Start-up Expenses | $52,000 |
| Working Capital Reserves | $103,000 |
| Establish Office Space (Month 6+) | $15,000 |
| Computer and Data/Communications Additions | $30,000 |
| Total | $200,000 |
7.10 Payback
As the table below shows, the initial owner/investor will find that the payback period on that investment will be three years. Our desire is to find an investor who recognizes the potential for long-term gain, again, as shown in the table, and is willing to keep their investment in Mirabile Dictu for at least three additional years.
| Payback | ||||||
| Projected Payback Calculation | ||||||
| Investment | Year 1 | Year 2 | Year 3 | Year 4 | Year 5 | |
| Investment | $500,000 | |||||
| Cash Returns by Year | $100,000 | $100,000 | $100,000 | $100,000 | $100,000 | |
| Combination as Income Stream | ($500,000) | $100,000 | $100,000 | $100,000 | $100,000 | $100,000 |
| Cumulative Net Cash Flow to Investors | ($500,000) | ($400,000) | ($300,000) | ($200,000) | ($100,000) | $0 |
| Payback Period | 5 years | |||||
7.11 Exit Strategy
The principal owners of Mirabile Dictu Advertising, founders McKenzie Bossard and Fernando Hearndon, believe in their business model, and in their experience-based view of the future. They foresee the business growing steadily for many years, and plan to be active participants in the business. By the end of year six the original principal investor will have been repaid several times over.
At that time, they envision several of their employees becoming full partners with concomitant investment. If our original investor wishes to exit the company, this will be the time.
Appendix
| Sales Forecast | |||||||||||||
| Month 1 | Month 2 | Month 3 | Month 4 | Month 5 | Month 6 | Month 7 | Month 8 | Month 9 | Month 10 | Month 11 | Month 12 | ||
| Sales | |||||||||||||
| Hand Tools | 0% | $0 | $80,000 | $0 | $80,000 | $0 | $0 | $80,000 | $0 | $0 | $80,000 | $0 | $80,000 |
| Power Tools | 0% | $0 | $80,000 | $0 | $80,000 | $0 | $0 | $80,000 | $0 | $0 | $80,000 | $0 | $80,000 |
| Mechanic Sets | 0% | $0 | $100,000 | $0 | $100,000 | $0 | $0 | $100,000 | $0 | $0 | $100,000 | $0 | $100,000 |
| Tool Boxes/Carriers | 0% | $0 | $0 | $0 | $0 | $0 | $0 | $0 | $0 | $0 | $0 | $0 | $0 |
| Heavy Lawn Equipment | 0% | $0 | $0 | $0 | $0 | $0 | $0 | $0 | $0 | $0 | $0 | $0 | $0 |
| Plumbing | 0% | $0 | $0 | $0 | $0 | $0 | $0 | $0 | $0 | $0 | $0 | $0 | $0 |
| Auto Hardware | 0% | $0 | $0 | $0 | $0 | $0 | $0 | $0 | $0 | $0 | $0 | $0 | $0 |
| Painting Supplies | 0% | $0 | $0 | $0 | $0 | $0 | $0 | $0 | $0 | $0 | $0 | $0 | $0 |
| Fasteners | 0% | $0 | $0 | $0 | $0 | $0 | $0 | $0 | $0 | $0 | $0 | $0 | $0 |
| Patio Door Repair | 0% | $0 | $0 | $0 | $0 | $0 | $0 | $0 | $0 | $0 | $0 | $0 | $0 |
| Pool Supplies | 0% | $0 | $0 | $0 | $0 | $0 | $0 | $0 | $0 | $0 | $0 | $0 | $0 |
| Total Sales | $0 | $260,000 | $0 | $260,000 | $0 | $0 | $260,000 | $0 | $0 | $260,000 | $0 | $260,000 | |
| Direct Cost of Sales | Month 1 | Month 2 | Month 3 | Month 4 | Month 5 | Month 6 | Month 7 | Month 8 | Month 9 | Month 10 | Month 11 | Month 12 | |
| Sign Prtg/Dist (Est 50% of Revenue) | 50% | $0 | $130,000 | $0 | $130,000 | $0 | $0 | $130,000 | $0 | $0 | $130,000 | $0 | $130,000 |
| Other | $0 | $0 | $0 | $0 | $0 | $0 | $0 | $0 | $0 | $0 | $0 | $0 | |
| Subtotal Direct Cost of Sales | $0 | $130,000 | $0 | $130,000 | $0 | $0 | $130,000 | $0 | $0 | $130,000 | $0 | $130,000 | |
| Personnel Plan | |||||||||||||
| Month 1 | Month 2 | Month 3 | Month 4 | Month 5 | Month 6 | Month 7 | Month 8 | Month 9 | Month 10 | Month 11 | Month 12 | ||
| Bossard | 5% | $3,000 | $16,000 | $3,000 | $16,000 | $3,000 | $3,000 | $16,000 | $3,000 | $3,000 | $16,000 | $3,000 | $16,000 |
| Hearndon | 5% | $3,000 | $16,000 | $3,000 | $16,000 | $3,000 | $3,000 | $16,000 | $3,000 | $3,000 | $16,000 | $3,000 | $16,000 |
| Sales People | 10% | $0 | $26,000 | $0 | $26,000 | $0 | $0 | $26,000 | $0 | $0 | $26,000 | $0 | $26,000 |
| Total People | 4 | 4 | 4 | 4 | 4 | 4 | 4 | 4 | 4 | 4 | 4 | 4 | |
| Total Payroll | $6,000 | $58,000 | $6,000 | $58,000 | $6,000 | $6,000 | $58,000 | $6,000 | $6,000 | $58,000 | $6,000 | $58,000 | |
| Pro Forma Profit and Loss | |||||||||||||
| Month 1 | Month 2 | Month 3 | Month 4 | Month 5 | Month 6 | Month 7 | Month 8 | Month 9 | Month 10 | Month 11 | Month 12 | ||
| Sales | $0 | $260,000 | $0 | $260,000 | $0 | $0 | $260,000 | $0 | $0 | $260,000 | $0 | $260,000 | |
| Direct Cost of Sales | $0 | $130,000 | $0 | $130,000 | $0 | $0 | $130,000 | $0 | $0 | $130,000 | $0 | $130,000 | |
| Other Costs of Sales | $0 | $0 | $0 | $0 | $0 | $0 | $0 | $0 | $0 | $0 | $0 | $0 | |
| Total Cost of Sales | $0 | $130,000 | $0 | $130,000 | $0 | $0 | $130,000 | $0 | $0 | $130,000 | $0 | $130,000 | |
| Gross Margin | $0 | $130,000 | $0 | $130,000 | $0 | $0 | $130,000 | $0 | $0 | $130,000 | $0 | $130,000 | |
| Gross Margin % | 0.00% | 50.00% | 0.00% | 50.00% | 0.00% | 0.00% | 50.00% | 0.00% | 0.00% | 50.00% | 0.00% | 50.00% | |
| Expenses | |||||||||||||
| Payroll | $6,000 | $58,000 | $6,000 | $58,000 | $6,000 | $6,000 | $58,000 | $6,000 | $6,000 | $58,000 | $6,000 | $58,000 | |
| Marketing/Promotion | $0 | $26,000 | $0 | $26,000 | $0 | $0 | $26,000 | $0 | $0 | $26,000 | $0 | $26,000 | |
| Depreciation | $0 | $0 | $0 | $0 | $0 | $0 | $0 | $0 | $0 | $0 | $0 | $0 | |
| Rent | $750 | $750 | $750 | $750 | $750 | $750 | $750 | $750 | $750 | $750 | $750 | $750 | |
| Utilities | $300 | $300 | $300 | $300 | $300 | $300 | $300 | $300 | $300 | $300 | $300 | $300 | |
| Insurance | $250 | $250 | $250 | $250 | $250 | $250 | $250 | $250 | $250 | $250 | $250 | $250 | |
| Payroll Taxes | 15% | $0 | $0 | $0 | $0 | $0 | $0 | $0 | $0 | $0 | $0 | $0 | $0 |
| Travel | $2,000 | $2,000 | $2,000 | $2,000 | $2,000 | $2,000 | $2,000 | $2,000 | $2,000 | $2,000 | $2,000 | $2,000 | |
| Total Operating Expenses | $9,300 | $87,300 | $9,300 | $87,300 | $9,300 | $9,300 | $87,300 | $9,300 | $9,300 | $87,300 | $9,300 | $87,300 | |
| Profit Before Interest and Taxes | ($9,300) | $42,700 | ($9,300) | $42,700 | ($9,300) | ($9,300) | $42,700 | ($9,300) | ($9,300) | $42,700 | ($9,300) | $42,700 | |
| EBITDA | ($9,300) | $42,700 | ($9,300) | $42,700 | ($9,300) | ($9,300) | $42,700 | ($9,300) | ($9,300) | $42,700 | ($9,300) | $42,700 | |
| Interest Expense | $0 | $0 | $0 | $0 | $0 | $0 | $0 | $0 | $0 | $0 | $0 | $0 | |
| Taxes Incurred | $0 | $0 | $0 | $0 | $0 | $0 | $0 | $0 | $0 | $0 | $0 | $0 | |
| Net Profit | ($9,300) | $42,700 | ($9,300) | $42,700 | ($9,300) | ($9,300) | $42,700 | ($9,300) | ($9,300) | $42,700 | ($9,300) | $42,700 | |
| Net Profit/Sales | 0.00% | 16.42% | 0.00% | 16.42% | 0.00% | 0.00% | 16.42% | 0.00% | 0.00% | 16.42% | 0.00% | 16.42% | |
| Pro Forma Cash Flow | |||||||||||||
| Month 1 | Month 2 | Month 3 | Month 4 | Month 5 | Month 6 | Month 7 | Month 8 | Month 9 | Month 10 | Month 11 | Month 12 | ||
| Cash Received | |||||||||||||
| Cash from Operations | |||||||||||||
| Cash Sales | $0 | $0 | $0 | $0 | $0 | $0 | $0 | $0 | $0 | $0 | $0 | $0 | |
| Cash from Receivables | $0 | $0 | $8,667 | $251,333 | $8,667 | $251,333 | $0 | $8,667 | $251,333 | $0 | $8,667 | $251,333 | |
| Subtotal Cash from Operations | $0 | $0 | $8,667 | $251,333 | $8,667 | $251,333 | $0 | $8,667 | $251,333 | $0 | $8,667 | $251,333 | |
| Additional Cash Received | |||||||||||||
| Sales Tax, VAT, HST/GST Received | 0.00% | $0 | $0 | $0 | $0 | $0 | $0 | $0 | $0 | $0 | $0 | $0 | $0 |
| New Current Borrowing | $0 | $0 | $0 | $0 | $0 | $0 | $0 | $0 | $0 | $0 | $0 | $0 | |
| New Other Liabilities (interest-free) | $0 | $0 | $0 | $0 | $0 | $0 | $0 | $0 | $0 | $0 | $0 | $0 | |
| New Long-term Liabilities | $0 | $0 | $0 | $0 | $0 | $0 | $0 | $0 | $0 | $0 | $0 | $0 | |
| Sales of Other Current Assets | $0 | $0 | $0 | $0 | $0 | $0 | $0 | $0 | $0 | $0 | $0 | $0 | |
| Sales of Long-term Assets | $0 | $0 | $0 | $0 | $0 | $0 | $0 | $0 | $0 | $0 | $0 | $0 | |
| New Investment Received | $0 | $0 | $0 | $0 | $0 | $0 | $0 | $0 | $0 | $0 | $0 | $0 | |
| Subtotal Cash Received | $0 | $0 | $8,667 | $251,333 | $8,667 | $251,333 | $0 | $8,667 | $251,333 | $0 | $8,667 | $251,333 | |
| Expenditures | Month 1 | Month 2 | Month 3 | Month 4 | Month 5 | Month 6 | Month 7 | Month 8 | Month 9 | Month 10 | Month 11 | Month 12 | |
| Expenditures from Operations | |||||||||||||
| Cash Spending | $6,000 | $58,000 | $6,000 | $58,000 | $6,000 | $6,000 | $58,000 | $6,000 | $6,000 | $58,000 | $6,000 | $58,000 | |
| Bill Payments | $0 | $110 | $8,500 | $154,100 | $8,500 | $154,100 | $3,300 | $8,500 | $154,100 | $3,300 | $8,500 | $154,100 | |
| Subtotal Spent on Operations | $6,000 | $58,110 | $14,500 | $212,100 | $14,500 | $160,100 | $61,300 | $14,500 | $160,100 | $61,300 | $14,500 | $212,100 | |
| Additional Cash Spent | |||||||||||||
| Sales Tax, VAT, HST/GST Paid Out | $0 | $0 | $0 | $0 | $0 | $0 | $0 | $0 | $0 | $0 | $0 | $0 | |
| Principal Repayment of Current Borrowing | $0 | $0 | $0 | $0 | $0 | $0 | $0 | $0 | $0 | $0 | $0 | $0 | |
| Other Liabilities Principal Repayment | $0 | $0 | $0 | $0 | $0 | $0 | $0 | $0 | $0 | $0 | $0 | $0 | |
| Long-term Liabilities Principal Repayment | $0 | $0 | $0 | $0 | $0 | $0 | $0 | $0 | $0 | $0 | $0 | $0 | |
| Purchase Other Current Assets | $0 | $0 | $0 | $0 | $0 | $0 | $0 | $0 | $0 | $0 | $0 | $0 | |
| Purchase Long-term Assets | $0 | $0 | $0 | $0 | $0 | $0 | $0 | $0 | $0 | $0 | $0 | $0 | |
| Dividends | $0 | $0 | $0 | $0 | $0 | $0 | $0 | $0 | $0 | $0 | $0 | $30,000 | |
| Subtotal Cash Spent | $6,000 | $58,110 | $14,500 | $212,100 | $14,500 | $160,100 | $61,300 | $14,500 | $160,100 | $61,300 | $14,500 | $242,100 | |
| Net Cash Flow | ($6,000) | ($58,110) | ($5,833) | $39,233 | ($5,833) | $91,233 | ($61,300) | ($5,833) | $91,233 | ($61,300) | ($5,833) | $9,233 | |
| Cash Balance | $242,000 | $183,890 | $178,057 | $217,290 | $211,457 | $302,690 | $241,390 | $235,557 | $326,790 | $265,490 | $259,657 | $268,890 | |
| Pro Forma Balance Sheet | |||||||||||||
| Month 1 | Month 2 | Month 3 | Month 4 | Month 5 | Month 6 | Month 7 | Month 8 | Month 9 | Month 10 | Month 11 | Month 12 | ||
| Assets | Starting Balances | ||||||||||||
| Current Assets | |||||||||||||
| Cash | $248,000 | $242,000 | $183,890 | $178,057 | $217,290 | $211,457 | $302,690 | $241,390 | $235,557 | $326,790 | $265,490 | $259,657 | $268,890 |
| Accounts Receivable | $0 | $0 | $260,000 | $251,333 | $260,000 | $251,333 | $0 | $260,000 | $251,333 | $0 | $260,000 | $251,333 | $260,000 |
| Other Current Assets | $0 | $0 | $0 | $0 | $0 | $0 | $0 | $0 | $0 | $0 | $0 | $0 | $0 |
| Total Current Assets | $248,000 | $242,000 | $443,890 | $429,390 | $477,290 | $462,790 | $302,690 | $501,390 | $486,890 | $326,790 | $525,490 | $510,990 | $528,890 |
| Long-term Assets | |||||||||||||
| Long-term Assets | $0 | $0 | $0 | $0 | $0 | $0 | $0 | $0 | $0 | $0 | $0 | $0 | $0 |
| Accumulated Depreciation | $0 | $0 | $0 | $0 | $0 | $0 | $0 | $0 | $0 | $0 | $0 | $0 | $0 |
| Total Long-term Assets | $0 | $0 | $0 | $0 | $0 | $0 | $0 | $0 | $0 | $0 | $0 | $0 | $0 |
| Total Assets | $248,000 | $242,000 | $443,890 | $429,390 | $477,290 | $462,790 | $302,690 | $501,390 | $486,890 | $326,790 | $525,490 | $510,990 | $528,890 |
| Liabilities and Capital | Month 1 | Month 2 | Month 3 | Month 4 | Month 5 | Month 6 | Month 7 | Month 8 | Month 9 | Month 10 | Month 11 | Month 12 | |
| Current Liabilities | |||||||||||||
| Accounts Payable | $0 | $3,300 | $162,490 | $157,290 | $162,490 | $157,290 | $6,490 | $162,490 | $157,290 | $6,490 | $162,490 | $157,290 | $162,490 |
| Current Borrowing | $0 | $0 | $0 | $0 | $0 | $0 | $0 | $0 | $0 | $0 | $0 | $0 | $0 |
| Other Current Liabilities | $0 | $0 | $0 | $0 | $0 | $0 | $0 | $0 | $0 | $0 | $0 | $0 | $0 |
| Subtotal Current Liabilities | $0 | $3,300 | $162,490 | $157,290 | $162,490 | $157,290 | $6,490 | $162,490 | $157,290 | $6,490 | $162,490 | $157,290 | $162,490 |
| Long-term Liabilities | $0 | $0 | $0 | $0 | $0 | $0 | $0 | $0 | $0 | $0 | $0 | $0 | $0 |
| Total Liabilities | $0 | $3,300 | $162,490 | $157,290 | $162,490 | $157,290 | $6,490 | $162,490 | $157,290 | $6,490 | $162,490 | $157,290 | $162,490 |
| Paid-in Capital | $300,000 | $300,000 | $300,000 | $300,000 | $300,000 | $300,000 | $300,000 | $300,000 | $300,000 | $300,000 | $300,000 | $300,000 | $300,000 |
| Retained Earnings | ($52,000) | ($52,000) | ($52,000) | ($52,000) | ($52,000) | ($52,000) | ($52,000) | ($52,000) | ($52,000) | ($52,000) | ($52,000) | ($52,000) | ($82,000) |
| Earnings | $0 | ($9,300) | $33,400 | $24,100 | $66,800 | $57,500 | $48,200 | $90,900 | $81,600 | $72,300 | $115,000 | $105,700 | $148,400 |
| Total Capital | $248,000 | $238,700 | $281,400 | $272,100 | $314,800 | $305,500 | $296,200 | $338,900 | $329,600 | $320,300 | $363,000 | $353,700 | $366,400 |
| Total Liabilities and Capital | $248,000 | $242,000 | $443,890 | $429,390 | $477,290 | $462,790 | $302,690 | $501,390 | $486,890 | $326,790 | $525,490 | $510,990 | $528,890 |
| Net Worth | $248,000 | $238,700 | $281,400 | $272,100 | $314,800 | $305,500 | $296,200 | $338,900 | $329,600 | $320,300 | $363,000 | $353,700 | $366,400 |
| Payback | |||||||||||
| Projected Payback Calculation | |||||||||||
| Investment | Year 1 | Year 2 | Year 3 | Year 4 | Year 5 | Year 6 | Year 7 | Year 8 | Year 9 | Year 10 | |
| Investment | $500,000 | ||||||||||
| Cash Returns by Year | $100,000 | $100,000 | $100,000 | $100,000 | $100,000 | $100,000 | $100,000 | $100,000 | $100,000 | $100,000 | |
| Combination as Income Stream | ($500,000) | $100,000 | $100,000 | $100,000 | $100,000 | $100,000 | $100,000 | $100,000 | $100,000 | $100,000 | $100,000 |
| Cumulative Net Cash Flow to Investors | ($500,000) | ($400,000) | ($300,000) | ($200,000) | ($100,000) | $0 | $100,000 | $200,000 | $300,000 | $400,000 | $500,000 |
| Payback Period | 5 years | ||||||||||


