
The Coffee Warehouse
Executive Summary
The Coffee Warehouse is a new business providing high-quality, full service distribution of coffee, specialty beverages and beverage-related supplies to coffee houses and espresso stands throughout the Spokane and Northern Idaho market.
The principal owners are Steve and Jennifer Smith, whose combined experience brings office management, high levels of customer service, and over 20 years in distribution and sales management. At this time we are seeking additional equity capital to compliment our own investment and are seeking to arrange a bank line for inventory and receivables financing. We have firm commitments to distribute several high-quality new age beverage products, and have verbal commitments from independent retailers throughout the Spokane and Northern Idaho market to carry our product. We plan to distribute our first products within 30-60 days of finalizing financial arrangements.
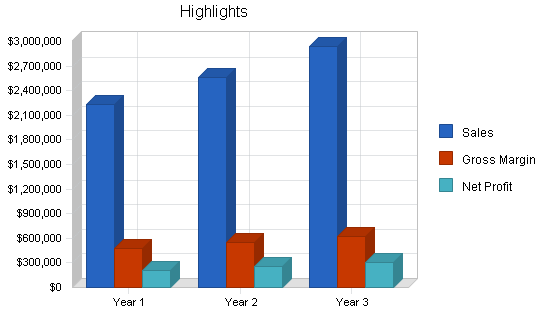
Sales projections for The Coffee Warehouse are estimated to begin at approximately $2,229,000 the first year, increasing to approximately $2,558,000 in Year 2 and approximately $2,936,000 in Year 3. Our net profit is projected at approximately $283,000 the first year, increasing to $406,000 by the end of the third year of operation.
Distinguishing characteristics of our business will be the combination of management experience, sales and distribution experience, high-quality, innovative products and exceptional customer service. In particular, what really sets up apart is that we are the ONLY full service distribution company servicing the coffee and specialty beverage industry in the Spokane/Northern Idaho market. In addition, The Coffee Warehouse has an exclusive contract to distribute a new, groundbreaking product that would enable us to gain immediate access to a majority of the potential customer base.
1.1 Objectives
- To open and operate a successful coffee and new age beverage distributorship in the Spokane/Northern Idaho market, employing three to five employees the first year.
- To obtain a minimum of 100 regular customers in the Spokane/North Idaho market the first year of operation.
- Achieve first year sales of $2,000,000.
- Maintain an average gross margin of 25 percent.
- To produce a net profit of at least $400,000 by the end of the third year of operation.
1.2 Mission
The Coffee Warehouse intends to become a recognized distributor of specialty beverages and beverage-related supplies and services to coffee houses and espresso stands throughout Spokane and Northern Idaho.
The Coffee Warehouse plans to develop strong relationships with key customers so we will be viewed as indispensable partners, rather than just another supplier. We will work closely with each customer to recommend product assortment unique for their retail base, appropriate stocking levels, pricing and display assortments, as well as promotional ideas and material to increase sales. The Coffee Warehouse will seek out and work with the manufacturers we represent to deliver the most innovative and exciting products possible to the customers we serve. We are not only selling product, we are selling service.
1.3 Keys to Success
- Innovative quality products.
- Individualized customer service – providing our customers with what they want, when and how they want it.
- Only full service distribution company in the Spokane/Northern Idaho market.
- Fully integrated programs to help customers increase sales through menu development, creative promotions, advertising, and custom marketing material.
- Exclusive distribution rights to ground-breaking products not currently available in our market.
- The combined experience of the principal owners bring upper office management skills, high levels of customer service, and over 20 years in distribution and sales management.
Company Summary
The Coffee Warehouse, Inc. is a new S-corporation business located in Spokane, Washington, and will be established based on the details of the following plan.
2.1 Company Location & Facilities
The Coffee Warehouse will be located in the Spokane Valley within the Spokane Industrial Business Park. This is a prime location to service both the Spokane and Northern Idaho market. The facilities will include approximately 5,000 square feet of warehouse space, with an additional 1,400 square feet built out for office/retail space. We are currently negotiating lease terms on the several available properties, and plan to have a lease signed by July 31.
2.2 Company Ownership
The Coffee Warehouse is a privately held S-Corporation owned in total by its co-founders, Steve and Jennifer Smith.
UBI Number: XXX-XXX-XXX (removed to protect confidentiality)
2.3 Start-up Summary
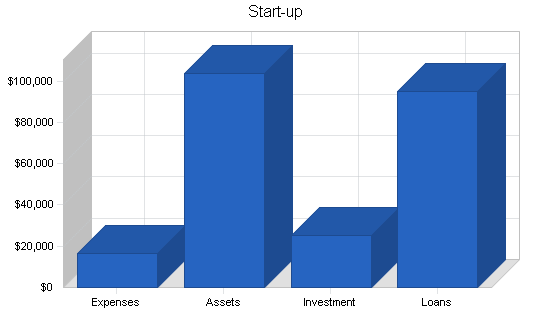
Start-up expenses for the Coffee Warehouse total $16,450, and include expenses such as legal, marketing, lease deposit, computer systems, etc. Start-up assets include $9,800 in initial cash requirements, $18,750 in short term assets (office furniture, refrigeration equipment), and $75,000 in starting inventory. These start-up costs will be financed through investments and small-business loans. The details of the start-up summary are included in the following table.
| Start-up | |
| Requirements | |
| Start-up Expenses | |
| Legal Business Formation | $220 |
| Business Plan | $90 |
| Warehouse Lease Deposit | $2,800 |
| Insurance (first month) | $500 |
| Utilities (first month) | $350 |
| Research & Development | $1,200 |
| Marketing | $1,200 |
| Advertising | $250 |
| Personnel | $2,060 |
| Business/Office Supplies | $1,550 |
| Computer Systems | $3,080 |
| Phone System | $650 |
| Communication Lines | $300 |
| Trade Show/Grand Opening | $2,200 |
| Total Start-up Expenses | $16,450 |
| Start-up Assets | |
| Cash Required | $9,800 |
| Start-up Inventory | $75,000 |
| Other Current Assets | $18,750 |
| Long-term Assets | $0 |
| Total Assets | $103,550 |
| Total Requirements | $120,000 |
| Start-up Funding | |
| Start-up Expenses to Fund | $16,450 |
| Start-up Assets to Fund | $103,550 |
| Total Funding Required | $120,000 |
| Assets | |
| Non-cash Assets from Start-up | $93,750 |
| Cash Requirements from Start-up | $9,800 |
| Additional Cash Raised | $0 |
| Cash Balance on Starting Date | $9,800 |
| Total Assets | $103,550 |
| Liabilities and Capital | |
| Liabilities | |
| Current Borrowing | $95,000 |
| Long-term Liabilities | $0 |
| Accounts Payable (Outstanding Bills) | $0 |
| Other Current Liabilities (interest-free) | $0 |
| Total Liabilities | $95,000 |
| Capital | |
| Planned Investment | |
| Investor 1 | $25,000 |
| Other | $0 |
| Additional Investment Requirement | $0 |
| Total Planned Investment | $25,000 |
| Loss at Start-up (Start-up Expenses) | ($16,450) |
| Total Capital | $8,550 |
| Total Capital and Liabilities | $103,550 |
| Total Funding | $120,000 |
Products
The Coffee Warehouse will provide a first-class delivery service of quality hot and cold beverage related supplies, including whole bean or ground coffee, flavor syrups, jet teas, fruit smoothies, bubble teas, concentrated milk, fresh baked goods and assorted paper supplies. Our services will include invaluable trade resources, effective promotional programs, custom-designed marketing material, informative monthly newsletters, training and product demonstrations, as well as information on the latest market trends in the coffee/specialty beverage industry.
3.1 Product & Service Description
PRODUCT DESCRIPTION
The Coffee Warehouse will carry a variety of quality products that will enable us to provide full service delivery to espresso stands and coffee houses. Our underlying philosophy in selecting products is to choose lines that will bring consistent quality, competitive prices, and product satisfaction to our customers. We have personally researched and sampled each of the following products that we offer to ensure the quality we guarantee.
- Lowery’s Gourmet Whole Bean and Wired Willey’s White Coffee
- Assorted Gourmet Syrups & Coffee Toppings
- Chocolate, White Chocolate and Caramel Syrups/Sauces
- Oregon Chai Concentrate
- Jet Cafe and Jet Tea Fruit n’ Tea Freeze
- Cappuccina line of product
- Big Train line of product
- Red Bull Energy Drinks
- Good Cow Concentrated Milk with Custom Dispensing Equipment
- Fresh Baked Goods
- Assortment of White, Pre-printed Paper, and Clear Beverage Cups Systems – as well as an assortment of other paper supplies
At this time, the majority of these products are only available to customers through wholesale vendors such as Cash and Carry retail outlets – therefore it is the customer’s responsibility to acquire these products by their own means. The Coffee Warehouse will make these same products available through our high quality, full service delivery – bringing these products directly to their doorstep at a competitive price.
SERVICE DESCRIPTION
An important component of our business is not just our products, but our service. In addition to our full service delivery, the following are other important service elements that we will offer to our customers:
Brought to you by
Create a professional business plan
Using AI and step-by-step instructions
Create Your PlanSecure funding
Validate ideas
Build a strategy
- Ideas to help our customers increase sales through menu development, creative promotions, co-op advertising, and much more.
- Custom designed marketing material such as printed banners, promotional posters, punch cards, pre-purchased beverage cards, reader boards, etc.
- Distribute a monthly newsletter featuring the latest coffee trends, new industry equipment, breaking trade news, promotional ideas, new creative recipes, and upcoming events.
- Samples of the latest product releases – with eye-catching point-of-sale to advertise new items to the end consumer.
- Routine equipment maintenance and training.
3.2 Competitive Edge
KEY COMPETITIVE STRENGTHS
No other wholesaler in the market offers full service delivery with the variety of product we feature. We are better positioned than our main competitors to take advantage of the increasing demands of coffee and specialty beverage supplies because we focus exclusively on high-quality distribution and customer service. In addition to the variety of products we feature, The Coffee Warehouse has exclusive distribution rights to Good Cow’s concentrated milk/dispensing system. This product is not currently available in our market by any other suppliers.
KEY COMPETITIVE WEAKNESSES
Our primary weakness is that we are a new business competing largely against established suppliers. To significantly build sales, we must not just find new customers – we must take customers away from existing suppliers. However by offering a superior selection of supplies, new groundbreaking products to the market, and focusing on high-quality service and full service delivery, we feel will can quickly establish accounts and build strong relationships. Co-founder Jennifer Smith has had many discussions with owners of coffee and espresso businesses that confirm this opinion.
3.3 Sales Literature
Sales literature to be distributed to both current and potential customers will include brochures, fliers, newsletters, as well as other print media such as print advertisements. Jennifer Smith is highly skilled in graphic design and desktop publishing, and has quality design and printing equipment to publish professional pieces at a low cost.
3.4 Sourcing
The Coffee Warehouse will purchase product directly from manufacturers, as well as master distributors. Because this eliminates the broker or “middle man,” this allows us to operate on a 25-30% profit margin, while providing our customers with competitive prices.
To further reduce costs, The Coffee Warehouse plans to share product shipments out of California with distributors operating in Portland, Oregon and Tri-Cities, Washington. Other product not being shipped directly to Spokane will be purchased and picked up in Seattle, Washington. The Coffee Warehouse plans to send a truck to Seattle on a bi-weekly basis to pick up product, thus cutting costs by an average of 5%.
3.5 Technology
To streamline the efficiency of our distribution methods, The Coffee Warehouse plans to use the latest in cutting edge technology – not only in the warehouse – but also in the trade.
All of our drivers/sales representatives will be equiped with Thinque MSP handhelds and software. Thinque MSP applications will reduce field expenses, decrease day’s sales outstanding, and increase worker efficiency. Features can be used in or out of the warehouse and include managing returns and collections; adjusting item price, profit or margin; applying promotional items to an account; streamlining orders; tracking inventory; reducing out-of-stocks; and providing sales history reports. All information recorded in the handheld is available in real time to be viewed by management in the office.
3.6 Future Products and Services
Within the first year of business, The Coffee Warehouse intends to open a retail/wholesale store and high-quality showroom. Products will be available for purchase by both our wholesale customers who may need product between delivery days, as well as retail consumers interested in purchasing product for their home use. We will also offer a showroom that will feature equipment, supplies, trade resources, and information on marketing services with examples of marketing and promotional material available to customers.
With the addition of the product showroom, The Coffee Warehouse will offer customers quarterly product and training demonstrations that will be presented by trained beverage experts from the industry.
The Coffee Warehouse also plans to hold semi-annual trade shows for current or potential customers. These trade shows will allow customers the opportunity to sample products, talk to manufacturers, learn about new industry trends, review marketing material, and network with other business owners in their market.
Market Analysis Summary
Coffee is the second largest commodity market next to oil, and growth is expected to continue at a strong pace for the foreseeable future. The specialty beverage industry is growing at an equally strong pace, with sales growth in some categories projected to grow at rates of 40% per year.
This growth offers excellent opportunities for new companies to enter this market, and we are excited about the possibilities of what The Coffee Warehouse can accomplish in the Spokane and Northern Idaho market.
4.1 Market Segmentation
The gourmet coffee and specialty beverage industry is divided into several segments. Consumers who enjoy these products purchase drinks at restaurants, coffee houses, sports venues, drive-thru espresso stands, and even inside other retail establishments that might feature an independent beverage stand.
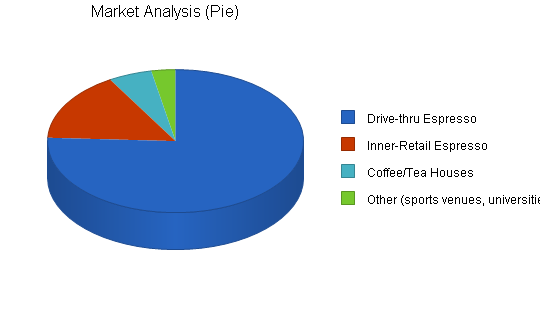
As illustrated in the chart below, within the market surrounding Spokane, Rathdrum, Post Falls and Coeur d’Alene, there are currently 250 drive-thru espresso stands, 18 coffee/tea houses, 52 independent inner-retail espresso stands, and approximately 10 stands in locations such as sports venues, university campuses, and etc. These figures are not including the number of restaurants, bars and cafes that also feature these beverages.
| Market Analysis | |||||||
| Year 1 | Year 2 | Year 3 | Year 4 | Year 5 | |||
| Potential Customers | Growth | CAGR | |||||
| Drive-thru Espresso | 4% | 250 | 259 | 268 | 277 | 287 | 3.51% |
| Inner-Retail Espresso | 4% | 52 | 54 | 56 | 58 | 60 | 3.64% |
| Coffee/Tea Houses | 5% | 18 | 19 | 20 | 21 | 22 | 5.14% |
| Other (sports venues, universities, etc) | 5% | 10 | 11 | 12 | 13 | 14 | 8.78% |
| Total | 3.79% | 330 | 343 | 356 | 369 | 383 | 3.79% |
4.2 Target Market Segment Strategy
While the market is already sizeable, this industry continues to grow. New espresso stands open their doors to the public on a monthly basis in our market, and it isn’t uncommon to see numerous espresso stands within a one or two mile radius. The article below, published by a national coffee retail magazine, discusses our market’s unique drive-thru espresso industry. The sales potential in this market is unlimited.
The Coffee Warehouse initially plans to target these drive-thru espresso stands, as well as all inner-retail espresso stands within our designated market. It is this segment that is most in need of the services we are planning to offer. Essential needs include: quality products at competitive prices, first class service, and strong sales support. It is most often these small owner-operated businesses that are neglected by larger suppliers and are forced to service themselves. It is also these smaller businesses who could most greatly benefit from marketing services, sales support, and full service product delivery. Providing the same high-quality service, within the first six months of operation, The Coffee Warehouse plans to expand our target into formal coffee houses and cafes, and as business grows and stabilizes, eventually evaluate the needs of potential customers in the restaurants and bar industry.

4.3 Market Growth
Coffee has been a growing industry for the past several years. In the gourmet/specialty coffee industry alone, the figures show an impressive rate of growth in the United States.
The new age beverage industry is growing at an equally strong pace. Sales growth in the chai tea category alone is estimated to be 50% historically, with projected growth rates of 40% per year. Energy drinks, including brands such as Red Bull – and trends such as Jet Tea – are driving the new age beverage growth, and have increased 50-fold in the past three years.
Brought to you by
Create a professional business plan
Using AI and step-by-step instructions
Create Your PlanSecure funding
Validate ideas
Build a strategy
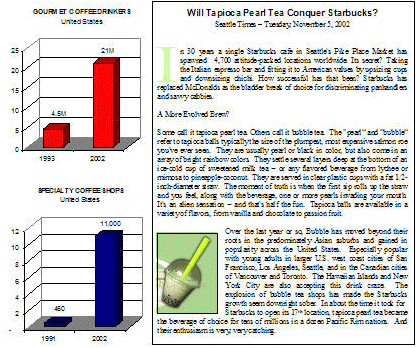
Bubble Tea has been a rapidly growing market in Asia, though it is relatively new to the United States. Introduced to trend setting marketings such as San Francisco and Seattle, sales have been exploding – and the craze of the “Tapioca Pearl” is expected to spread throughout America.
4.4 Industry Analysis
The coffee and specialty beverage industry is pulverized, with hundreds of manufacturers, brokers, suppliers and retailers. Unlike the beer/soda industry, with large companies such as Anheuser Busch, Pepsi and Coca Cola controlling most of the market, the coffee and specialty beverage industry does not have large national chains with market control.
In an open industry growing at such a strong rate, The Coffee Warehouse is in position to capitalize on the customer’s need for quality product, exceptional service, and an effective partner to success.
4.5 Industry Participants
With the rate of growth in the gourmet coffee market, in addition to the recent trends in Jet Teas and other specialty beverages, the industry is comprised of many small participants, each focusing on only a few specific items or brands at a time. As the markets evolve, we expect the industry to consolidate with larger distributors representing more of a vast selection of products in each market.
Currently in our segment of the industry, there are no large national chains with market control. There are also few products that are offered with exclusive rights to one market. While this is the case with many products, The Coffee Warehouse is working with manufacturers to change that practice, and not only represent a larger variety of product than others in our industry, but also acquire exclusive rights to many of the products in our portfolio.
4.6 Distribution Patterns
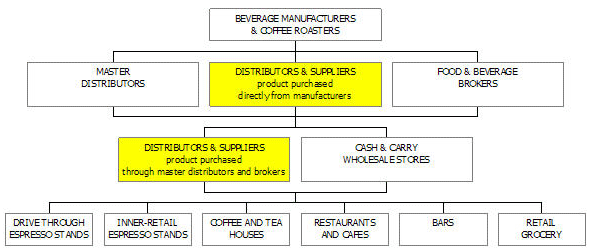
The following flow chart illustrates the overall industry surrounding the distribution patterns of coffee and specialty beverages. (The Coffee Warehouse falls into the level highlighted in yellow).
Several manufacturers are represented by master distributors and/or brokers who in turn provide the product to direct distributors and other wholesale suppliers. Other manufacturers allow distributors and suppliers to purchase product direct – depending on the quantity of product being purchased. Product is then distributed or sold through cash and carry wholesale stores to retail businesses as illustrated below.
4.7 Competition & Buying Patterns
While there are a handful of coffee and specialty beverage suppliers providing product in our market, there is still a great deal of room for new business. Most importantly, there is room for new business that understands the need for high-quality service and sales support – in addition to product at competitive prices.
In this industry, customers choose their suppliers based on available product, price, and service – though most often, it is the service that suffers most. While one supplier may offer the product at the right price, they do not provide the level of service that the customer demands. The next supplier may offer the right level of service, though their prices are too high. This results with the customer purchasing most of their supplies through a cash and carry style wholesale store – leaving the customer with no service or support.
By positioning ourselves in the market with in-demand, quality product at competitive prices, with a consistent high level of customer service – we are confident that we will see customers and their business continue to increase.
Sales and Marketing
The unique aspects of our business include individual product selection, quality assurance, and high-quality full service distribution. Our strategy is to focus 100% of our efforts on the market for espresso supplies in the Spokane and Northern Idaho area. By focusing all of our effort and energy on this particular area, we expect to quickly develop and maintain a leadership position. The Coffee Warehouse’s key personnel will stay in contact with our customers, and will be able to respond to changes in this market much faster than our competitors.
The Coffee Warehouse will offer the best, most highly personalized service in the marketplace. Being a small, owner-operated company, we intend to use this to our advantage to be absolutely certain that every one of our customers receive excellent service. We will go out of our way to make sure that our customers know that they truly matter to us. Sales reps and in-house personnel who deal with customers will be carefully trained and given wide latitude for insuring that customers are always satisfied.
5.1 Marketing Strategy
Our basic marketing strategy is to work with customers on a one-to-one basis to ensure their supply needs are being met and help develop unique marketing programs for each of them. We intend to prioritize customer service and make it a key component of our marketing programs. We believe that providing our customers with what they want, when and how they want it, is the key to repeat business and positive word-of-mouth advertising. Because we want to develop close working relationships with our customers, we want to establish accounts in as personable a way as possible. It is for this reason that we will overwhelmingly emphasize in-person sales calls to build accounts.
We will closely integrate all of our marketing and sales efforts to project a consistent image of our company and a consistent positioning of our products and services. We will build this image around our name “The Coffee Warehouse, Inc.” and emphasize to customers the high-quality service that is behind this name.
To support our marketing initiatives and product knowledge, we will attend as many area conventions and trade shows as possible to ensure we are offering the most up-to-date market trend information.
5.2 Promotion Strategy
Relationships are the key to success in the distribution business. Personal selling will remain our most important means of promotion. Both Steve and Jennifer Smith will lead this effort – Steve, with his skill and experience in sales and distribution, and Jennifer in customer service and relations. In addition to personal selling, The Coffee Warehouse has identified several other means of advertising and publicity.
The Coffee Warehouse will send news releases to local media and press, as well as trade magazines to try to get product and company feature coverage in front of the eyes of our customers – as well as the end consumer. We will also produce a few generic press releases about the products we are distributing for our customers to use toward publicity coverage for their businesses in local publications such as the Spokesman, The Inlander and Local Planet.
Third, we shall have a monthly newsletter for current of potential customers. This newsletter will highlight new and current trends in the industry, upcoming conventions and trade shows, offer promotions and special deals, as well as provide new recipes, fun tips and other information that can be used in their business. We will also highlight not just our products, but also display ideas and success stories of other business in the industry. As a more straight forward advertising effort, The Coffee Warehouse will feature an advertisement in the Yellow Pages, frequent ads in the Spokesman Review, the Inlander, and the Local Planet, as well as participation in networking, local trade shows, and personal word-of-mouth advertising.
5.3 Distribution Strategy
To begin, The Coffee Warehouse will operate two delivery trucks with a third vehicle for special deliveries between scheduled delivery days. Deliveries will be made Monday through Friday, and will be strategically routed to minimize travel time and fuel costs – while maximizing production. On average, we will service 20-30 accounts per day, with deliveries to each account twice a week. As the number of accounts increase, the need for additional delivery trucks will continue to be evaluated. With each additional delivery truck, routes will be restructured to maintain maximum efficiency.
Brought to you by
Create a professional business plan
Using AI and step-by-step instructions
Create Your PlanSecure funding
Validate ideas
Build a strategy
5.4 Sales Strategy
Distribution sales are dependent on repeat business, therefore the sales strategy for The Coffee Warehouse is based on personal, consistent sales contact, with a high emphasis on customer service and relations. Because we are a new distributor, we understand that we will have to prove our worth to our customers in order to earn their respect and business. Both of the owners, Steve and Jennifer, will make personal calls on potential customers to review our product line and services, give general information on our company, and discuss how we feel we can help them succeed in their business.
The Coffee Warehouse will begin operations with two full-time delivery/sales representatives, who will be responsible for providing full service and delivery to current customers, but also make sales calls for potential new business. This delivery/sales representatives will receive a base salary, with commission on qualified sales, as well as bonuses for new acquired business. Customers will be scheduled for a pre-arranged delivery day once or twice a week, depending on the quantity and timeline of product needed. Product orders can be placed in a number of ways to help facilitate the process:
- Phoned Orders: Customers can easily phone orders into our office, up until 2:30 p.m. of the afternoon prior to their scheduled delivery day.
- Faxed Orders: Customers can fax in a completed product order sheet, with the same deadline as phoned orders.
- Tel-Sell: Customers may choose to have a representative from the office call them the day prior to their scheduled delivery to check product quantities and assist them in placing their order.
We understand the hectic schedule of a small business, so if a customer fails to call or fax their weekly order, they will receive a courtesy call from our office to verify that an order is not needed.
5.5 Sales Forecast
As indicated in the table, our sales are forecasted to increase rapidly, with an annual growth rate of approximately 30%.

| Sales Forecast | |||
| Year 1 | Year 2 | Year 3 | |
| Sales | |||
| Espresso Syrups | $415,362 | $477,666 | $549,316 |
| Chocolate & Caramel Sauces | $275,852 | $311,713 | $352,235 |
| Specialty Beverage Mixes | $176,660 | $203,158 | $233,632 |
| Energy Drinks | $44,372 | $51,028 | $58,683 |
| Concentrated Milk | $113,816 | $130,889 | $150,523 |
| Paper Supplies | $1,185,285 | $1,363,078 | $1,567,540 |
| Marketing | $18,305 | $21,051 | $24,208 |
| Total Sales | $2,229,652 | $2,558,584 | $2,936,137 |
| Direct Cost of Sales | Year 1 | Year 2 | Year 3 |
| Espresso Syrups | $345,347 | $397,149 | $456,722 |
| Chocolate & Caramel Sauces | $244,798 | $276,622 | $312,583 |
| Specialty Beverage Mixes | $134,440 | $154,606 | $177,797 |
| Energy Drinks | $36,542 | $42,023 | $48,327 |
| Concentrated Milk | $97,919 | $112,607 | $129,498 |
| Paper Supplies | $888,964 | $1,022,308 | $1,175,655 |
| Marketing | $6,540 | $7,521 | $8,649 |
| Subtotal Direct Cost of Sales | $1,754,550 | $2,012,837 | $2,309,230 |
5.6 Milestones
The following table and chart are the important milestones for The Coffee Warehouse.

| Milestones | |||||
| Milestone | Start Date | End Date | Budget | Manager | Department |
| Market/Trade Research | 3/15/2003 | 5/15/2003 | $150 | SDS / JLS | Marketing |
| Logo Design/Marketing | 4/15/2003 | 5/15/2003 | $1,300 | JLS | Marketing |
| Complete Business Plan | 4/15/2003 | 5/30/2003 | $90 | JLS | Marketing |
| Product/Pricing Comparison | 4/15/2003 | 5/15/2003 | $150 | SDS / JLS | Marketing |
| Finalize Potential Client List | 5/1/2003 | 5/15/2003 | $0 | JLS | Marketing |
| Licensing/Incorporation | 5/15/2003 | 6/15/2003 | $200 | JLS | Marketing |
| Secure Product Line | 5/15/2003 | 6/15/2003 | $0 | JLS | Marketing |
| Research/Secure Financing | 5/15/2003 | 7/15/2003 | $0 | SDS / JLS | Marketing |
| Warehouse Selection/Buildout | 5/15/2003 | 6/15/2003 | $0 | SDS / JLS | Marketing |
| Leasehold Improvements | 7/1/2003 | 8/1/2003 | $5,000 | SDS / JLS | Web |
| Delivery Vehicle Selection | 6/1/2003 | 6/15/2003 | $0 | SDS | Web |
| Develop Routing | 6/15/2003 | 7/15/2003 | $100 | SDS | Department |
| Hire Delivery/Sales Personnel | 7/1/2003 | 7/15/2003 | $100 | SDS | Department |
| Office Equipment/Computer/Supplies | 7/1/2003 | 8/1/2003 | $5,000 | JLS | Department |
| Order Beginning Inventory | 7/10/2003 | 7/20/2003 | $20,000 | SDS / JLS | Department |
| Press Releases/Advertising | 7/1/2003 | 8/1/2003 | $250 | JLS | Department |
| Organize Grand Opening Trade Show | 8/1/2003 | 8/10/2003 | $3,000 | JLS | Department |
| Totals | $35,340 | ||||
Management Summary
The Coffee Warehouse will be owned and operated by its founders, initially working with a small employee base that will cover sales and delivery. Management and personnel plans are covered in more detail in the topics to follow.
6.1 Organizational Structure
The Coffee Warehouse will be managed by the two founding partners, whose individual areas of expertise cover many of the functional aspects of the business.
The organizational structure is very simple. Steve Smith will be responsible for the routing, distribution management and delivery systems. Jennifer Smith will be responsible for customer service, accounting, shipping and the general administration of the business. Together they will be responsible for product selection and sales and marketing.
The support staff at the office and warehouse, as well as the delivery personnel will report to Jennifer. Because Steve will be spending a majority of his time in the trade, Jennifer will be able to support any day-to-day needs that the personnel may have. However even when Steve is out of the office, he will be in constant contact via computer or phone.
The goal of The Coffee Warehouse is to have a team of committed associates who empower each other so that the customer’s expectations can be exceeded. Our goal is to offer career opportunities, advancement opportunities and a level of income and benefits that is competitive within the region and job classification. It is our long-term goal to be the preferred employer within our niche of the beverage distribution industry.
6.2 Management Team
Steven D. Smith
Steve has a long history of experience in sales and distribution management, specifically in the beverage industry. As the sales and distribution manager for the largest beverage distributorship in the state, he currently manages ten sales representatives and twenty four merchandisers. During this time as sales manager, he has helped increase market share from 25 to 40%.
Over the last twenty years, Steve has successfully built and maintained rapport with buyers in the city’s largest key accounts, and has strategically routed sales, merchandising and truck routes throughout the city.
Steve has many industry contacts and an in-depth knowledge of the market.
Jennifer L. Smith
Jennifer recently operated as general manager for a local business and directed a staff of thirteen, overseeing the accounting practices, human resource issues, and day-to-day operations of the company. Prior to this position, Jennifer has held a variety of other inside business management and operations positions.
Jennifer’s strengths and skills include strong management, excellent public relations, high levels of organization, extensive computer knowledge – including desktop publishing and graphic layout – and extensive presentation and reporting skills.
6.3 Personnel Plan
PERSONNEL – GENERAL
Initially we expect to be able to handle business needs with Steve and Jennifer, one administrative assistant, and two product delivery/sales personnel. As business continues to grow, we intend to hire additional employees one at a time and pay premium, over market labor rates to attract and retain quality help.
Not only will we train our employees to deliver excellent service, we will give them the flexibility to respond creatively to client requests. In addition, we will continually monitor our clients’ level of satisfaction with our service through surveys and other convenient feedback opportunities.
To ensure our personnel are meeting our expectations, we will hold a minimum of quarterly meetings with all employees so that results can be reviewed and future plans can be discussed. At least twice a year, a refresher course will be required on product knowledge and how to exceed our customer’s expectations.
SALES AND DELIVERY
In order to deliver high quality, personalized service we will carefully select all employees – with extra attention given to sales reps and delivery personnel who will deal directly with customers. We will carefully review references not just from past employers or manufacturers, but also from retailers whom these sales reps have served. We will also make sure that each employee understands our way of delivering quality service to each customer. We will have immediate back-up support available by phone from our office for more difficult service issues. We will also give employees enough latitude so that they can respond immediately to almost any customer request or complaint – which in this industry usually means granting immediate credit for damaged merchandise, and adding additional merchandise to an order.
| Personnel Plan | |||
| Year 1 | Year 2 | Year 3 | |
| Jennifer Smith | $30,000 | $35,000 | $40,000 |
| Sales/Delivery (Salary) | $20,400 | $21,500 | $22,500 |
| Sales/Delivery (Commission) | $4,237 | $4,500 | $4,500 |
| Delivery/Warehouse Personnel | $20,400 | $21,500 | $22,500 |
| Administration | $18,720 | $19,500 | $21,000 |
| Total People | 4 | 4 | 4 |
| Total Payroll | $93,757 | $102,000 | $110,500 |
Financial Plan
The Coffee Warehouse projects the gross margin to be at approximately 20-25 percent. Sales projections for FY2004 are at $2,229,652 increasing to $2,558,584 in FY2005 and $2,936,137 in FY2006. Cash-flow analysis, balance sheet, business ratio, break-even analysis, and other financial details are shown in the appendix.
7.1 Important Assumptions
General assumptions for this plan are on the following table.
| General Assumptions | |||
| Year 1 | Year 2 | Year 3 | |
| Plan Month | 1 | 2 | 3 |
| Current Interest Rate | 8.00% | 8.00% | 8.00% |
| Long-term Interest Rate | 8.00% | 8.00% | 8.00% |
| Tax Rate | 25.42% | 25.00% | 25.42% |
| Other | 0 | 0 | 0 |
7.2 Break-even Analysis
The following table and chart illustrate our break-even analysis. With our fixed costs estimate of approximately $15,000 per month, operating on average at a 25% profit margin, we will need to sell 67,666 units to break-even in a month. Fixed costs include our warehouse lease, vehicle leases, utilities, insurance, payroll, and an estimation of other running costs.

| Break-even Analysis | |
| Monthly Revenue Break-even | $75,055 |
| Assumptions: | |
| Average Percent Variable Cost | 79% |
| Estimated Monthly Fixed Cost | $15,993 |
7.3 Projected Profit and Loss
The following table and charts show the projected profit and loss. Monthly projections are included in the appendix.


| Pro Forma Profit and Loss | |||
| Year 1 | Year 2 | Year 3 | |
| Sales | $2,229,652 | $2,558,584 | $2,936,137 |
| Direct Cost of Sales | $1,754,550 | $2,012,837 | $2,309,230 |
| Hidden Row | $0 | $0 | $0 |
| Total Cost of Sales | $1,754,550 | $2,012,837 | $2,309,230 |
| Gross Margin | $475,102 | $545,747 | $626,907 |
| Gross Margin % | 21.31% | 21.33% | 21.35% |
| Expenses | |||
| Payroll | $93,757 | $102,000 | $110,500 |
| Other | $0 | $0 | $0 |
| Depreciation | $0 | $0 | $0 |
| Rent | $33,096 | $34,260 | $35,460 |
| Utilities and Phone | $7,200 | $7,500 | $7,800 |
| Insurance | $6,000 | $6,300 | $6,500 |
| Payroll Burden | $14,064 | $15,300 | $16,575 |
| Leased Equipment (Delivery Vehicles) | $12,000 | $12,600 | $13,200 |
| Leased Equipment (Warehouse) | $3,000 | $3,000 | $3,000 |
| Leased Equipment (Other) | $2,400 | $2,400 | $2,400 |
| Fuel (delivery) | $12,000 | $12,500 | $13,000 |
| Advertising / Promotion | $3,600 | $3,600 | $3,600 |
| Professional Services | $2,400 | $2,200 | $2,600 |
| Miscellaneous (office supplies, etc) | $2,400 | $2,700 | $3,000 |
| Total Operating Expenses | $191,917 | $204,360 | $217,635 |
| Profit Before Interest and Taxes | $283,186 | $341,387 | $409,272 |
| EBITDA | $283,186 | $341,387 | $409,272 |
| Interest Expense | $6,560 | $4,720 | $2,800 |
| Taxes Incurred | $69,354 | $84,167 | $103,312 |
| Other Income | |||
| Interest Income | $0 | $0 | $0 |
| Other Income Account Name | $0 | $0 | $0 |
| Total Other Income | $0 | $0 | $0 |
| Other Expense | |||
| Account Name | $0 | $0 | $0 |
| Other Expense Account Name | $0 | $0 | $0 |
| Total Other Expense | $0 | $0 | $0 |
| Net Other Income | $0 | $0 | $0 |
| Net Profit | $207,271 | $252,500 | $303,160 |
| Net Profit/Sales | 9.30% | 9.87% | 10.33% |
7.4 Projected Cash Flow
The following table shows cash flow for the three years, and the chart illustrates monthly cash flow in the first year. Monthly cash flow projections are included in the appendix.

| Pro Forma Cash Flow | |||
| Year 1 | Year 2 | Year 3 | |
| Cash Received | |||
| Cash from Operations | |||
| Cash Sales | $2,229,652 | $2,558,584 | $2,936,137 |
| Subtotal Cash from Operations | $2,229,652 | $2,558,584 | $2,936,137 |
| Additional Cash Received | |||
| Non Operating (Other) Income | $0 | $0 | $0 |
| Sales Tax, VAT, HST/GST Received | $0 | $0 | $0 |
| New Current Borrowing | $0 | $0 | $0 |
| New Other Liabilities (interest-free) | $0 | $0 | $0 |
| New Long-term Liabilities | $0 | $0 | $0 |
| Sales of Other Current Assets | $0 | $0 | $0 |
| Sales of Long-term Assets | $0 | $0 | $0 |
| New Investment Received | $0 | $0 | $0 |
| Subtotal Cash Received | $2,229,652 | $2,558,584 | $2,936,137 |
| Expenditures | Year 1 | Year 2 | Year 3 |
| Expenditures from Operations | |||
| Cash Spending | $93,757 | $102,000 | $110,500 |
| Bill Payments | $1,826,094 | $2,457,050 | $2,556,178 |
| Subtotal Spent on Operations | $1,919,851 | $2,559,050 | $2,666,678 |
| Additional Cash Spent | |||
| Non Operating (Other) Expense | $0 | $0 | $0 |
| Sales Tax, VAT, HST/GST Paid Out | $0 | $0 | $0 |
| Principal Repayment of Current Borrowing | $24,000 | $24,000 | $24,000 |
| Other Liabilities Principal Repayment | $0 | $0 | $0 |
| Long-term Liabilities Principal Repayment | $0 | $0 | $0 |
| Purchase Other Current Assets | $0 | $0 | $0 |
| Purchase Long-term Assets | $0 | $0 | $0 |
| Dividends | $0 | $0 | $0 |
| Subtotal Cash Spent | $1,943,851 | $2,583,050 | $2,690,678 |
| Net Cash Flow | $285,801 | ($24,466) | $245,459 |
| Cash Balance | $295,601 | $271,134 | $516,594 |
7.5 Projected Balance Sheet
The projected balance sheet is shown in the following table, with monthly projections in the appendix.
| Pro Forma Balance Sheet | |||
| Year 1 | Year 2 | Year 3 | |
| Assets | |||
| Current Assets | |||
| Cash | $295,601 | $271,134 | $516,594 |
| Inventory | $358,198 | $410,929 | $471,438 |
| Other Current Assets | $18,750 | $18,750 | $18,750 |
| Total Current Assets | $672,549 | $700,813 | $1,006,782 |
| Long-term Assets | |||
| Long-term Assets | $0 | $0 | $0 |
| Accumulated Depreciation | $0 | $0 | $0 |
| Total Long-term Assets | $0 | $0 | $0 |
| Total Assets | $672,549 | $700,813 | $1,006,782 |
| Liabilities and Capital | Year 1 | Year 2 | Year 3 |
| Current Liabilities | |||
| Accounts Payable | $385,728 | $185,492 | $212,300 |
| Current Borrowing | $71,000 | $47,000 | $23,000 |
| Other Current Liabilities | $0 | $0 | $0 |
| Subtotal Current Liabilities | $456,728 | $232,492 | $235,300 |
| Long-term Liabilities | $0 | $0 | $0 |
| Total Liabilities | $456,728 | $232,492 | $235,300 |
| Paid-in Capital | $25,000 | $25,000 | $25,000 |
| Retained Earnings | ($16,450) | $190,821 | $443,321 |
| Earnings | $207,271 | $252,500 | $303,160 |
| Total Capital | $215,821 | $468,321 | $771,482 |
| Total Liabilities and Capital | $672,549 | $700,813 | $1,006,782 |
| Net Worth | $215,821 | $468,321 | $771,482 |
7.6 Business Ratios
The table shows projected business ratios.
| Ratio Analysis | ||||
| Year 1 | Year 2 | Year 3 | Industry Profile | |
| Sales Growth | 0.00% | 14.75% | 14.76% | 0.00% |
| Percent of Total Assets | ||||
| Inventory | 53.26% | 58.64% | 46.83% | 0.00% |
| Other Current Assets | 2.79% | 2.68% | 1.86% | 100.00% |
| Total Current Assets | 100.00% | 100.00% | 100.00% | 100.00% |
| Long-term Assets | 0.00% | 0.00% | 0.00% | 0.00% |
| Total Assets | 100.00% | 100.00% | 100.00% | 100.00% |
| Current Liabilities | 67.91% | 33.17% | 23.37% | 0.00% |
| Long-term Liabilities | 0.00% | 0.00% | 0.00% | 0.00% |
| Total Liabilities | 67.91% | 33.17% | 23.37% | 0.00% |
| Net Worth | 32.09% | 66.83% | 76.63% | 100.00% |
| Percent of Sales | ||||
| Sales | 100.00% | 100.00% | 100.00% | 100.00% |
| Gross Margin | 21.31% | 21.33% | 21.35% | 0.00% |
| Selling, General & Administrative Expenses | 8.61% | 8.17% | 7.51% | 0.00% |
| Advertising Expenses | 0.00% | 0.00% | 0.00% | 0.00% |
| Profit Before Interest and Taxes | 12.70% | 13.34% | 13.94% | 0.00% |
| Main Ratios | ||||
| Current | 1.47 | 3.01 | 4.28 | 0.00 |
| Quick | 0.69 | 1.25 | 2.28 | 0.00 |
| Total Debt to Total Assets | 67.91% | 33.17% | 23.37% | 0.00% |
| Pre-tax Return on Net Worth | 128.17% | 71.89% | 52.69% | 0.00% |
| Pre-tax Return on Assets | 41.13% | 48.04% | 40.37% | 0.00% |
| Additional Ratios | Year 1 | Year 2 | Year 3 | |
| Net Profit Margin | 9.30% | 9.87% | 10.33% | n.a |
| Return on Equity | 96.04% | 53.92% | 39.30% | n.a |
| Activity Ratios | ||||
| Inventory Turnover | 10.91 | 5.23 | 5.23 | n.a |
| Accounts Payable Turnover | 5.73 | 12.17 | 12.17 | n.a |
| Payment Days | 27 | 46 | 28 | n.a |
| Total Asset Turnover | 3.32 | 3.65 | 2.92 | n.a |
| Debt Ratios | ||||
| Debt to Net Worth | 2.12 | 0.50 | 0.30 | n.a |
| Current Liab. to Liab. | 1.00 | 1.00 | 1.00 | n.a |
| Liquidity Ratios | ||||
| Net Working Capital | $215,821 | $468,321 | $771,482 | n.a |
| Interest Coverage | 43.17 | 72.33 | 146.17 | n.a |
| Additional Ratios | ||||
| Assets to Sales | 0.30 | 0.27 | 0.34 | n.a |
| Current Debt/Total Assets | 68% | 33% | 23% | n.a |
| Acid Test | 0.69 | 1.25 | 2.28 | n.a |
| Sales/Net Worth | 10.33 | 5.46 | 3.81 | n.a |
| Dividend Payout | 0.00 | 0.00 | 0.00 | n.a |
Appendix
| Sales Forecast | |||||||||||||
| Month 1 | Month 2 | Month 3 | Month 4 | Month 5 | Month 6 | Month 7 | Month 8 | Month 9 | Month 10 | Month 11 | Month 12 | ||
| Sales | |||||||||||||
| Espresso Syrups | 0% | $14,322 | $16,470 | $18,941 | $21,782 | $25,049 | $28,807 | $33,128 | $38,097 | $43,811 | $50,383 | $57,940 | $66,632 |
| Chocolate & Caramel Sauces | 0% | $10,465 | $12,034 | $13,839 | $15,915 | $18,303 | $21,048 | $21,048 | $24,205 | $27,836 | $32,011 | $36,813 | $42,335 |
| Specialty Beverage Mixes | 0% | $8,626 | $6,363 | $3,759 | $4,006 | $4,242 | $4,732 | $7,887 | $10,498 | $21,167 | $30,347 | $34,899 | $40,134 |
| Energy Drinks | 0% | $1,530 | $1,760 | $2,023 | $2,327 | $2,676 | $3,077 | $3,539 | $4,070 | $4,680 | $5,382 | $6,190 | $7,118 |
| Concentrated Milk | 0% | $1,530 | $2,924 | $3,520 | $4,245 | $5,128 | $6,360 | $7,914 | $9,882 | $12,379 | $15,556 | $19,604 | $24,774 |
| Paper Supplies | 0% | $51,400 | $47,414 | $43,114 | $45,849 | $51,378 | $58,075 | $68,506 | $85,766 | $123,777 | $177,815 | $202,120 | $230,071 |
| Marketing | 0% | $700 | $805 | $910 | $1,015 | $1,155 | $1,295 | $1,470 | $1,680 | $1,890 | $2,170 | $2,450 | $2,765 |
| Total Sales | $88,573 | $87,770 | $86,106 | $95,139 | $107,931 | $123,394 | $143,492 | $174,198 | $235,540 | $313,664 | $360,016 | $413,829 | |
| Direct Cost of Sales | Month 1 | Month 2 | Month 3 | Month 4 | Month 5 | Month 6 | Month 7 | Month 8 | Month 9 | Month 10 | Month 11 | Month 12 | |
| Espresso Syrups | $11,908 | $13,694 | $15,748 | $18,110 | $20,827 | $23,951 | $27,544 | $31,675 | $36,426 | $41,890 | $48,174 | $55,400 | |
| Chocolate & Caramel Sauces | $8,441 | $9,707 | $11,163 | $12,837 | $14,763 | $16,977 | $19,524 | $22,453 | $25,821 | $29,694 | $34,148 | $39,270 | |
| Specialty Beverage Mixes | $6,496 | $4,866 | $2,981 | $3,192 | $3,401 | $3,802 | $6,168 | $8,145 | $16,035 | $22,852 | $26,280 | $30,222 | |
| Energy Drinks | $1,260 | $1,449 | $1,666 | $1,916 | $2,204 | $2,534 | $2,914 | $3,352 | $3,854 | $4,433 | $5,097 | $5,862 | |
| Concentrated Milk | $1,308 | $2,509 | $3,022 | $3,646 | $4,405 | $5,465 | $6,804 | $8,499 | $10,651 | $13,389 | $16,880 | $21,339 | |
| Paper Supplies | $38,550 | $35,560 | $32,335 | $34,387 | $38,534 | $43,556 | $51,379 | $64,325 | $92,833 | $133,361 | $151,590 | $172,554 | |
| Marketing | $250 | $288 | $325 | $363 | $413 | $463 | $525 | $600 | $675 | $775 | $875 | $988 | |
| Subtotal Direct Cost of Sales | $68,213 | $68,073 | $67,240 | $74,451 | $84,546 | $96,749 | $114,858 | $139,049 | $186,297 | $246,395 | $283,045 | $325,635 | |
| Personnel Plan | |||||||||||||
| Month 1 | Month 2 | Month 3 | Month 4 | Month 5 | Month 6 | Month 7 | Month 8 | Month 9 | Month 10 | Month 11 | Month 12 | ||
| Jennifer Smith | 0% | $2,500 | $2,500 | $2,500 | $2,500 | $2,500 | $2,500 | $2,500 | $2,500 | $2,500 | $2,500 | $2,500 | $2,500 |
| Sales/Delivery (Salary) | 0% | $1,700 | $1,700 | $1,700 | $1,700 | $1,700 | $1,700 | $1,700 | $1,700 | $1,700 | $1,700 | $1,700 | $1,700 |
| Sales/Delivery (Commission) | 0% | $170 | $192 | $216 | $240 | $268 | $300 | $336 | $379 | $429 | $493 | $565 | $649 |
| Delivery/Warehouse Personnel | 0% | $1,700 | $1,700 | $1,700 | $1,700 | $1,700 | $1,700 | $1,700 | $1,700 | $1,700 | $1,700 | $1,700 | $1,700 |
| Administration | 0% | $1,560 | $1,560 | $1,560 | $1,560 | $1,560 | $1,560 | $1,560 | $1,560 | $1,560 | $1,560 | $1,560 | $1,560 |
| Total People | 4 | 4 | 4 | 4 | 4 | 4 | 4 | 4 | 4 | 4 | 4 | 4 | |
| Total Payroll | $7,630 | $7,652 | $7,676 | $7,700 | $7,728 | $7,760 | $7,796 | $7,839 | $7,889 | $7,953 | $8,025 | $8,109 | |
| General Assumptions | |||||||||||||
| Month 1 | Month 2 | Month 3 | Month 4 | Month 5 | Month 6 | Month 7 | Month 8 | Month 9 | Month 10 | Month 11 | Month 12 | ||
| Plan Month | 1 | 2 | 3 | 4 | 5 | 6 | 7 | 8 | 9 | 10 | 11 | 12 | |
| Current Interest Rate | 8.00% | 8.00% | 8.00% | 8.00% | 8.00% | 8.00% | 8.00% | 8.00% | 8.00% | 8.00% | 8.00% | 8.00% | |
| Long-term Interest Rate | 8.00% | 8.00% | 8.00% | 8.00% | 8.00% | 8.00% | 8.00% | 8.00% | 8.00% | 8.00% | 8.00% | 8.00% | |
| Tax Rate | 30.00% | 25.00% | 25.00% | 25.00% | 25.00% | 25.00% | 25.00% | 25.00% | 25.00% | 25.00% | 25.00% | 25.00% | |
| Other | 0 | 0 | 0 | 0 | 0 | 0 | 0 | 0 | 0 | 0 | 0 | 0 | |
| Pro Forma Profit and Loss | |||||||||||||
| Month 1 | Month 2 | Month 3 | Month 4 | Month 5 | Month 6 | Month 7 | Month 8 | Month 9 | Month 10 | Month 11 | Month 12 | ||
| Sales | $88,573 | $87,770 | $86,106 | $95,139 | $107,931 | $123,394 | $143,492 | $174,198 | $235,540 | $313,664 | $360,016 | $413,829 | |
| Direct Cost of Sales | $68,213 | $68,073 | $67,240 | $74,451 | $84,546 | $96,749 | $114,858 | $139,049 | $186,297 | $246,395 | $283,045 | $325,635 | |
| Hidden Row | $0 | $0 | $0 | $0 | $0 | $0 | $0 | $0 | $0 | $0 | $0 | $0 | |
| Total Cost of Sales | $68,213 | $68,073 | $67,240 | $74,451 | $84,546 | $96,749 | $114,858 | $139,049 | $186,297 | $246,395 | $283,045 | $325,635 | |
| Gross Margin | $20,360 | $19,697 | $18,866 | $20,688 | $23,385 | $26,645 | $28,634 | $35,149 | $49,243 | $67,269 | $76,971 | $88,194 | |
| Gross Margin % | 22.99% | 22.44% | 21.91% | 21.74% | 21.67% | 21.59% | 19.96% | 20.18% | 20.91% | 21.45% | 21.38% | 21.31% | |
| Expenses | |||||||||||||
| Payroll | $7,630 | $7,652 | $7,676 | $7,700 | $7,728 | $7,760 | $7,796 | $7,839 | $7,889 | $7,953 | $8,025 | $8,109 | |
| Other | $0 | $0 | $0 | $0 | $0 | $0 | $0 | $0 | $0 | $0 | $0 | $0 | |
| Depreciation | $0 | $0 | $0 | $0 | $0 | $0 | $0 | $0 | $0 | $0 | $0 | $0 | |
| Rent | $2,758 | $2,758 | $2,758 | $2,758 | $2,758 | $2,758 | $2,758 | $2,758 | $2,758 | $2,758 | $2,758 | $2,758 | |
| Utilities and Phone | $600 | $600 | $600 | $600 | $600 | $600 | $600 | $600 | $600 | $600 | $600 | $600 | |
| Insurance | $500 | $500 | $500 | $500 | $500 | $500 | $500 | $500 | $500 | $500 | $500 | $500 | |
| Payroll Burden | 15% | $1,145 | $1,148 | $1,151 | $1,155 | $1,159 | $1,164 | $1,169 | $1,176 | $1,183 | $1,193 | $1,204 | $1,216 |
| Leased Equipment (Delivery Vehicles) | $1,000 | $1,000 | $1,000 | $1,000 | $1,000 | $1,000 | $1,000 | $1,000 | $1,000 | $1,000 | $1,000 | $1,000 | |
| Leased Equipment (Warehouse) | $250 | $250 | $250 | $250 | $250 | $250 | $250 | $250 | $250 | $250 | $250 | $250 | |
| Leased Equipment (Other) | $200 | $200 | $200 | $200 | $200 | $200 | $200 | $200 | $200 | $200 | $200 | $200 | |
| Fuel (delivery) | $1,000 | $1,000 | $1,000 | $1,000 | $1,000 | $1,000 | $1,000 | $1,000 | $1,000 | $1,000 | $1,000 | $1,000 | |
| Advertising / Promotion | $300 | $300 | $300 | $300 | $300 | $300 | $300 | $300 | $300 | $300 | $300 | $300 | |
| Professional Services | 15% | $200 | $200 | $200 | $200 | $200 | $200 | $200 | $200 | $200 | $200 | $200 | $200 |
| Miscellaneous (office supplies, etc) | $200 | $200 | $200 | $200 | $200 | $200 | $200 | $200 | $200 | $200 | $200 | $200 | |
| Total Operating Expenses | $15,783 | $15,808 | $15,835 | $15,863 | $15,895 | $15,932 | $15,973 | $16,023 | $16,080 | $16,154 | $16,237 | $16,333 | |
| Profit Before Interest and Taxes | $4,578 | $3,889 | $3,030 | $4,825 | $7,490 | $10,713 | $12,661 | $19,126 | $33,163 | $51,116 | $60,735 | $71,861 | |
| EBITDA | $4,578 | $3,889 | $3,030 | $4,825 | $7,490 | $10,713 | $12,661 | $19,126 | $33,163 | $51,116 | $60,735 | $71,861 | |
| Interest Expense | $620 | $607 | $593 | $580 | $567 | $553 | $540 | $527 | $513 | $500 | $487 | $473 | |
| Taxes Incurred | $1,187 | $821 | $609 | $1,061 | $1,731 | $2,540 | $3,030 | $4,650 | $8,162 | $12,654 | $15,062 | $17,847 | |
| Other Income | |||||||||||||
| Interest Income | $0 | $0 | $0 | $0 | $0 | $0 | $0 | $0 | $0 | $0 | $0 | $0 | |
| Other Income Account Name | $0 | $0 | $0 | $0 | $0 | $0 | $0 | $0 | $0 | $0 | $0 | $0 | |
| Total Other Income | $0 | $0 | $0 | $0 | $0 | $0 | $0 | $0 | $0 | $0 | $0 | $0 | |
| Other Expense | |||||||||||||
| Account Name | $0 | $0 | $0 | $0 | $0 | $0 | $0 | $0 | $0 | $0 | $0 | $0 | |
| Other Expense Account Name | $0 | $0 | $0 | $0 | $0 | $0 | $0 | $0 | $0 | $0 | $0 | $0 | |
| Total Other Expense | $0 | $0 | $0 | $0 | $0 | $0 | $0 | $0 | $0 | $0 | $0 | $0 | |
| Net Other Income | $0 | $0 | $0 | $0 | $0 | $0 | $0 | $0 | $0 | $0 | $0 | $0 | |
| Net Profit | $2,770 | $2,462 | $1,828 | $3,184 | $5,192 | $7,620 | $9,090 | $13,950 | $24,487 | $37,962 | $45,186 | $53,541 | |
| Net Profit/Sales | 3.13% | 2.80% | 2.12% | 3.35% | 4.81% | 6.18% | 6.34% | 8.01% | 10.40% | 12.10% | 12.55% | 12.94% | |
| Pro Forma Cash Flow | |||||||||||||
| Month 1 | Month 2 | Month 3 | Month 4 | Month 5 | Month 6 | Month 7 | Month 8 | Month 9 | Month 10 | Month 11 | Month 12 | ||
| Cash Received | |||||||||||||
| Cash from Operations | |||||||||||||
| Cash Sales | $88,573 | $87,770 | $86,106 | $95,139 | $107,931 | $123,394 | $143,492 | $174,198 | $235,540 | $313,664 | $360,016 | $413,829 | |
| Subtotal Cash from Operations | $88,573 | $87,770 | $86,106 | $95,139 | $107,931 | $123,394 | $143,492 | $174,198 | $235,540 | $313,664 | $360,016 | $413,829 | |
| Additional Cash Received | |||||||||||||
| Non Operating (Other) Income | $0 | $0 | $0 | $0 | $0 | $0 | $0 | $0 | $0 | $0 | $0 | $0 | |
| Sales Tax, VAT, HST/GST Received | 0.00% | $0 | $0 | $0 | $0 | $0 | $0 | $0 | $0 | $0 | $0 | $0 | $0 |
| New Current Borrowing | $0 | $0 | $0 | $0 | $0 | $0 | $0 | $0 | $0 | $0 | $0 | $0 | |
| New Other Liabilities (interest-free) | $0 | $0 | $0 | $0 | $0 | $0 | $0 | $0 | $0 | $0 | $0 | $0 | |
| New Long-term Liabilities | $0 | $0 | $0 | $0 | $0 | $0 | $0 | $0 | $0 | $0 | $0 | $0 | |
| Sales of Other Current Assets | $0 | $0 | $0 | $0 | $0 | $0 | $0 | $0 | $0 | $0 | $0 | $0 | |
| Sales of Long-term Assets | $0 | $0 | $0 | $0 | $0 | $0 | $0 | $0 | $0 | $0 | $0 | $0 | |
| New Investment Received | $0 | $0 | $0 | $0 | $0 | $0 | $0 | $0 | $0 | $0 | $0 | $0 | |
| Subtotal Cash Received | $88,573 | $87,770 | $86,106 | $95,139 | $107,931 | $123,394 | $143,492 | $174,198 | $235,540 | $313,664 | $360,016 | $413,829 | |
| Expenditures | Month 1 | Month 2 | Month 3 | Month 4 | Month 5 | Month 6 | Month 7 | Month 8 | Month 9 | Month 10 | Month 11 | Month 12 | |
| Expenditures from Operations | |||||||||||||
| Cash Spending | $7,630 | $7,652 | $7,676 | $7,700 | $7,728 | $7,760 | $7,796 | $7,839 | $7,889 | $7,953 | $8,025 | $8,109 | |
| Bill Payments | $2,607 | $78,184 | $77,442 | $76,236 | $92,651 | $106,626 | $122,274 | $147,608 | $181,556 | $257,760 | $334,299 | $348,850 | |
| Subtotal Spent on Operations | $10,237 | $85,836 | $85,118 | $83,936 | $100,379 | $114,386 | $130,070 | $155,447 | $189,445 | $265,713 | $342,324 | $356,959 | |
| Additional Cash Spent | |||||||||||||
| Non Operating (Other) Expense | $0 | $0 | $0 | $0 | $0 | $0 | $0 | $0 | $0 | $0 | $0 | $0 | |
| Sales Tax, VAT, HST/GST Paid Out | $0 | $0 | $0 | $0 | $0 | $0 | $0 | $0 | $0 | $0 | $0 | $0 | |
| Principal Repayment of Current Borrowing | $2,000 | $2,000 | $2,000 | $2,000 | $2,000 | $2,000 | $2,000 | $2,000 | $2,000 | $2,000 | $2,000 | $2,000 | |
| Other Liabilities Principal Repayment | $0 | $0 | $0 | $0 | $0 | $0 | $0 | $0 | $0 | $0 | $0 | $0 | |
| Long-term Liabilities Principal Repayment | $0 | $0 | $0 | $0 | $0 | $0 | $0 | $0 | $0 | $0 | $0 | $0 | |
| Purchase Other Current Assets | $0 | $0 | $0 | $0 | $0 | $0 | $0 | $0 | $0 | $0 | $0 | $0 | |
| Purchase Long-term Assets | $0 | $0 | $0 | $0 | $0 | $0 | $0 | $0 | $0 | $0 | $0 | $0 | |
| Dividends | $0 | $0 | $0 | $0 | $0 | $0 | $0 | $0 | $0 | $0 | $0 | $0 | |
| Subtotal Cash Spent | $12,237 | $87,836 | $87,118 | $85,936 | $102,379 | $116,386 | $132,070 | $157,447 | $191,445 | $267,713 | $344,324 | $358,959 | |
| Net Cash Flow | $76,336 | ($66) | ($1,012) | $9,203 | $5,552 | $7,008 | $11,422 | $16,751 | $44,095 | $45,951 | $15,692 | $54,870 | |
| Cash Balance | $86,136 | $86,071 | $85,059 | $94,262 | $99,813 | $106,821 | $118,243 | $134,994 | $179,089 | $225,039 | $240,731 | $295,601 | |
| Pro Forma Balance Sheet | |||||||||||||
| Month 1 | Month 2 | Month 3 | Month 4 | Month 5 | Month 6 | Month 7 | Month 8 | Month 9 | Month 10 | Month 11 | Month 12 | ||
| Assets | Starting Balances | ||||||||||||
| Current Assets | |||||||||||||
| Cash | $9,800 | $86,136 | $86,071 | $85,059 | $94,262 | $99,813 | $106,821 | $118,243 | $134,994 | $179,089 | $225,039 | $240,731 | $295,601 |
| Inventory | $75,000 | $75,034 | $74,880 | $73,964 | $81,896 | $93,001 | $106,424 | $126,344 | $152,954 | $204,926 | $271,034 | $311,349 | $358,198 |
| Other Current Assets | $18,750 | $18,750 | $18,750 | $18,750 | $18,750 | $18,750 | $18,750 | $18,750 | $18,750 | $18,750 | $18,750 | $18,750 | $18,750 |
| Total Current Assets | $103,550 | $179,920 | $179,701 | $177,773 | $194,908 | $211,564 | $231,995 | $263,337 | $306,698 | $402,765 | $514,823 | $570,830 | $672,549 |
| Long-term Assets | |||||||||||||
| Long-term Assets | $0 | $0 | $0 | $0 | $0 | $0 | $0 | $0 | $0 | $0 | $0 | $0 | $0 |
| Accumulated Depreciation | $0 | $0 | $0 | $0 | $0 | $0 | $0 | $0 | $0 | $0 | $0 | $0 | $0 |
| Total Long-term Assets | $0 | $0 | $0 | $0 | $0 | $0 | $0 | $0 | $0 | $0 | $0 | $0 | $0 |
| Total Assets | $103,550 | $179,920 | $179,701 | $177,773 | $194,908 | $211,564 | $231,995 | $263,337 | $306,698 | $402,765 | $514,823 | $570,830 | $672,549 |
| Liabilities and Capital | Month 1 | Month 2 | Month 3 | Month 4 | Month 5 | Month 6 | Month 7 | Month 8 | Month 9 | Month 10 | Month 11 | Month 12 | |
| Current Liabilities | |||||||||||||
| Accounts Payable | $0 | $75,600 | $74,919 | $73,163 | $89,114 | $102,578 | $117,390 | $141,641 | $173,052 | $246,632 | $322,728 | $335,549 | $385,728 |
| Current Borrowing | $95,000 | $93,000 | $91,000 | $89,000 | $87,000 | $85,000 | $83,000 | $81,000 | $79,000 | $77,000 | $75,000 | $73,000 | $71,000 |
| Other Current Liabilities | $0 | $0 | $0 | $0 | $0 | $0 | $0 | $0 | $0 | $0 | $0 | $0 | $0 |
| Subtotal Current Liabilities | $95,000 | $168,600 | $165,919 | $162,163 | $176,114 | $187,578 | $200,390 | $222,641 | $252,052 | $323,632 | $397,728 | $408,549 | $456,728 |
| Long-term Liabilities | $0 | $0 | $0 | $0 | $0 | $0 | $0 | $0 | $0 | $0 | $0 | $0 | $0 |
| Total Liabilities | $95,000 | $168,600 | $165,919 | $162,163 | $176,114 | $187,578 | $200,390 | $222,641 | $252,052 | $323,632 | $397,728 | $408,549 | $456,728 |
| Paid-in Capital | $25,000 | $25,000 | $25,000 | $25,000 | $25,000 | $25,000 | $25,000 | $25,000 | $25,000 | $25,000 | $25,000 | $25,000 | $25,000 |
| Retained Earnings | ($16,450) | ($16,450) | ($16,450) | ($16,450) | ($16,450) | ($16,450) | ($16,450) | ($16,450) | ($16,450) | ($16,450) | ($16,450) | ($16,450) | ($16,450) |
| Earnings | $0 | $2,770 | $5,232 | $7,060 | $10,244 | $15,436 | $23,056 | $32,146 | $46,096 | $70,583 | $108,545 | $153,731 | $207,271 |
| Total Capital | $8,550 | $11,320 | $13,782 | $15,610 | $18,794 | $23,986 | $31,606 | $40,696 | $54,646 | $79,133 | $117,095 | $162,281 | $215,821 |
| Total Liabilities and Capital | $103,550 | $179,920 | $179,701 | $177,773 | $194,908 | $211,564 | $231,995 | $263,337 | $306,698 | $402,765 | $514,823 | $570,830 | $672,549 |
| Net Worth | $8,550 | $11,320 | $13,782 | $15,610 | $18,794 | $23,986 | $31,606 | $40,696 | $54,646 | $79,133 | $117,095 | $162,281 | $215,821 |


