
Kid's Community College
Executive Summary
Kid’s Community College® aims to prepare its students to excel as young leaders of tomorrow by combining an exclusive collegiate-based curriculum tailored specifically for children with enhanced, first class child care services. Unlike our competitors, we offer advanced technology programs, after-school tutoring, and activities such as arts and crafts, dance, theatre and gymnastics, all in one location.
Kid’s Community College is a privately held corporation run by its owner, Timothy Bernard Kilpatrick, Sr. Mr. Kilpatrick has 17 years of Executive Management (VP) and Budgeting experience, and extensive experience with budgeting methodologies and strategic planning, including the Balanced Scorecard approach. His advanced degree (and interest) in computer science is the driving force behind our technology component. He will be supported in daily operations by an industry consultant, a campus director, and a VP of educational operations, all with extensive experience in child care fields.
With inflation continuing to rise each year, the typical American family now requires dual or supplemental incomes. This trend has created a need for quality child care services. The population growth rate in the Riverview area of Hillsborough County is now over 14.6%, leading us to anticipate expanding market potential for this industry in our local area. Price, service, certification and reputation are critical success factors in the child care services industry. Kid’s Community College® will compete well in our market by offering competitive prices, high-quality child care services, and leading-edge educational programs with certified, college-educated instructors, and by maintaining an excellent reputation with parents and the community we serve.
This is a daycare business plan for Kid’s Community College®, which will focus on two subdivisions: ‘Lake St. Charles’ and ‘The Villages of Lake St. Charles,’ which are new upscale community developments within a 2 square mile radius, boasting over 900 new homes. Our target customers are dual-income, middle-class families who value the quality of education and child care we provide for their children, ages 4 months to 12 years.
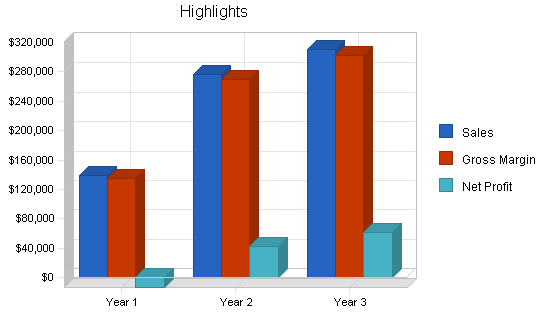
We will open for business starting with an initial enrollment of 13 students. We project healthy revenues by the end of the first year, and expect to nearly triple that by the end of Year 3. Our biggest operating expenses will be compensation at industry standard rates for our highly-qualified personnel, and rent on our facilities, improved for our purposes during the start-up period. We would like to grow into four campuses, eventually, but growth is planned conservatively, to be financed from existing cash flow as we go. We anticipate a net profit beginning in our second year.
To these ends, we are putting significant investment in the business, and are seeking a matching amount in the form of an SBA loan.
Mission
“Some of the best years in life are the time spent as a child and later our collegiate years…” As working adults in a fast paced society, we sometimes forget just how precious and fleeting those years are.
With that in mind, imagine an alternative to traditional infant, day and after school care that not only met your child care needs, but also provided an activity based learning environment that mirrors those used at colleges, universities and vocational centers around the nation. A college community of professional care givers with the credentials to not only enhance your child’s early social and motor skills, but to also teach them advanced studies in the arts and sciences found at institutions of higher learning. A collegiate-based curriculum tailored specifically for children, taught in a fun, nurturing care giving environment.
Now imagine this at a cost less than that of the combination of conventional day care and specific interest based children programs.
Kid’s Community College® is a start-up comprehensive community college exclusively for kids ages 4 months to 5 years and 1st through 5th grades. The College dedicates its efforts and resources toward ensuring top-rated care giving services coupled with a high-quality activity based learning environment tailored for children in these age groups. The College will respond to the needs of its parents and students with excellent care-giving and instruction, an advanced curriculum, flexible programs, local community involvement and business partnerships.
The College has a strong commitment to accessibility and diversity. Its open door policy embraces all who desire to provide a better quality of care, preparedness and education for their children. The College works to provide affordable, first-class care giving and education by providing a broad range of integrated programs and services and innovative learning approaches.
The College is committed to taking a leadership role in child care services, higher learning, community services and promoting cultural diversity. Kid’s Community College® directs its activities towards student success.
Objectives
- Sales increasing to almost double first year sales by the end of Year 2.
- Maintain a high raw gross margin by the end of Year 1.
- Open second campus by the end of Year 1.
- Begin franchise effort by end of Year 3.
Keys to Success
The keys to success for KCC are:
- Marketing: differentiating KCC’s care giving and educational services from traditional daycare offerings and interest activity programs.
- Service quality: care giving and educational programs provided by degreed and certified educators, child care workers, tutors and subject matter industry professionals in a technologically advanced first-class collegiate environment.
- Reputation: maintaining a highly regarded reputation for excellence in care giving, education and community involvement and being the employer of choice in our market for child care and educational talent.
- Profitability: controlling costs and managing budgets in accordance with company goals, adhering to strategic business plans for growth and expansion and reinvesting in the business and its employees.
Company Summary
Kid’s Community College® – Lake St. Charles Campus will be located in Riverview, FL. The College will employ six fundamentals that will serve as the driving force for the services offered:
- Premier Care Giving Services
- An Activity Based, Children Structured Collegiate Curriculum
- Advanced Technology and Developmental Programs
- Trademarked General and “Continuing” Education Mentoring and Tutoring
- Learning Services
- Community Advancement and Involvement
The Lake St. Charles campus is a newly constructed, 3,600 square foot facility in the Lake St. Charles Medical Plaza and will be developed meeting strict KCC design standards, under close supervision of Hillsborough County child care Licensing.
Start-up Summary
The college founder and president, Mr. Kilpatrick, will oversee fiscal responsibility, employing an independent CPA for financial oversight. A Campus Director will be hired to handle day-to-day operations of the facility and will work collaboratively with the silent partners and other campus personnel to ensure a successful business venture.
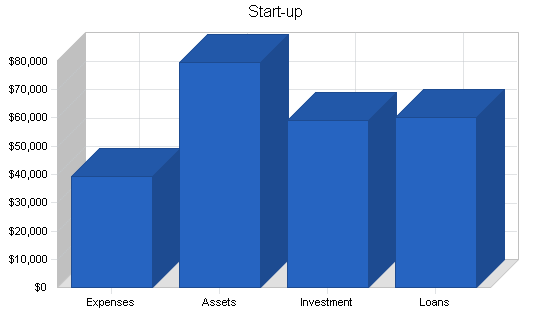
As reflected in the table below, the estimated start-up costs for KCC will be $39,450. These costs will be financed solely by the owners’ personal cash funds and optional credit lines. An anticipated $60,000 SBA guaranteed 5-year loan will be used as working capital. Future expansion, growth and franchising strategy will be self-financed.
| Start-up | |
| Requirements | |
| Start-up Expenses | |
| Legal | $1,000 |
| Stationery | $250 |
| Brochures | $500 |
| Insurance | $1,500 |
| Rent | $8,250 |
| R&D | $500 |
| Consultants | $1,000 |
| Playground Equipment | $3,500 |
| Playground Prep | $700 |
| Playground Fence | $3,000 |
| Furnishings | $7,500 |
| Toys | $3,000 |
| Buildout | $8,750 |
| Total Start-up Expenses | $39,450 |
| Start-up Assets | |
| Cash Required | $65,550 |
| Other Current Assets | $14,130 |
| Long-term Assets | $0 |
| Total Assets | $79,680 |
| Total Requirements | $119,130 |
| Start-up Funding | |
| Start-up Expenses to Fund | $39,450 |
| Start-up Assets to Fund | $79,680 |
| Total Funding Required | $119,130 |
| Assets | |
| Non-cash Assets from Start-up | $14,130 |
| Cash Requirements from Start-up | $65,550 |
| Additional Cash Raised | $0 |
| Cash Balance on Starting Date | $65,550 |
| Total Assets | $79,680 |
| Liabilities and Capital | |
| Liabilities | |
| Current Borrowing | $0 |
| Long-term Liabilities | $60,000 |
| Accounts Payable (Outstanding Bills) | $0 |
| Other Current Liabilities (interest-free) | $0 |
| Total Liabilities | $60,000 |
| Capital | |
| Planned Investment | |
| Owner – Kilpatrick Cash | $45,000 |
| Owner – Kilpatrick Credit Line | $12,500 |
| Other Assets Invested | $1,630 |
| Additional Investment Requirement | $0 |
| Total Planned Investment | $59,130 |
| Loss at Start-up (Start-up Expenses) | ($39,450) |
| Total Capital | $19,680 |
| Total Capital and Liabilities | $79,680 |
| Total Funding | $119,130 |
Brought to you by
Create a professional business plan
Using AI and step-by-step instructions
Create Your PlanSecure funding
Validate ideas
Build a strategy
Company Locations and Facilities
Kid’s Community College® will begin with one location – a newly constructed 3,600 square foot campus in Riverview, FL located near the entrance of the upscale Lake St. Charles subdivision. The campus is in the Lake St. Charles Medical Professional center and will boast separate halls for arts and crafts, theatre and dance, information technology, library and quiet study, tutoring, infant care and a cafeteria. The play area will be adjacent to the campus and will be securely fenced and furnished with appropriate playground equipment and facilities.
Three additional campuses are planned in the rural Tampa marketplace over the next four years. Franchise start-ups will be offered in the Orlando, Miami and Jacksonville marketplace after 2 years of successful operation.
Company Ownership
Kid’s Community College® is a privately-held proprietorship owned in majority by its founder and president, Timothy Bernard Kilpatrick, Sr. There are also two silent partners, neither of whom owns more than 10%, but will be active participants in daily operations, management decisions and consulting, though they do not own a financial stake in the company.
Once the operation reaches its anticipated growth and profitability goals, the college plans to franchise and will re-register as a limited liability company or as a corporation, whichever will better suit the future business needs.
Services
Kid’s Community College® offers upscale child care services and an advanced collegiate based curriculum designed for kids ages 4 months to 5 years and 1st through 5th grades. Normal operating hours will be 6:45am to 6:30pm, Monday through Friday – with observance of all major legal holidays. Early drop-off service will be offered as needed.
KCC exists to provide Premier child care services that are aimed at enhancing traditional day care methodologies and integrating extracurricular interests (such as arts and crafts, dance, theatre and gymnastics) into one comprehensive program. Our activity based collegiate curriculum is specifically tailored for children and mirrors the arts and sciences taught at colleges, universities and vocational schools around the nation. We offer state-of-the-art technology programs in leading-edge facilities which help prepare students for the technology age in which they live. Our general and “continuing” education programs help mentor and tutor students through “main school” homework assignments and provide a base of understanding and interaction to ensure success in future educational endeavors. Finally, our developmental programs reinforce basic social, listening, independence and motor skills and prepare students for future related interaction.
All of our learning and child care services employ technology, partnerships, professional services and other activities that support and promote higher learning.
In addition to the extensive services and curriculum offered, each campus will also offer weekend specialty classes for children and adults and planned family activities in the community it serves. KCC will also offer children birthday party hosting services, providing great activities for kids and an easy experience for parents. Activity instructors will be assigned for these events and will lead the activities, ensuring a memorable celebration.
Service Description
Upon its opening, Kid’s Community College® will offer four basic services in the Lake St. Charles community:
- Full-time Child Day Care
- Part-time/After School Care (including drop-off and pick-up)
- After School Tutoring
- Drop-In Care
Prior to opening, the college will have a two-month enrollment drive. Based on the market reaction to the drive, these services may be altered to meet the needs of the community. The college will always remain nimble enough to respond to the needs of the community in which it serves.
Competitive Comparison
The child care industry as a whole is saturated. However, based on US Census 2000 data, Hillsborough County Child Care Services provider listings and Hillsborough County building permit records, the city of Riverview, Florida itself is growing and has few licensed child care facilities. Kid’s Community College® intends to fill this local market need.
The Lake St. Charles and ‘The Villages of Lake St. Charles’ subdivisions have 800 and 100 single family homes respectively. There are only two other child care facilities in the neighborhood. One is in the immediate area, a church based facility and the other is 2 miles away, a facility hosted by a local martial arts academy. There are also three family child caregivers listed in the area, but none in the immediate community. Kid’s Community College® will differentiate itself from its local competitors by offering an alternative to these traditional day care approaches.
The Kid’s Community College® market strategy is based on providing an activity based learning environment that is used in many major colleges, universities and vocational centers around the nation. We will offer a community of professional caregivers with the credentials to not only enhance a child’s early social and motor skills, but to also teach them advanced studies in the arts and sciences found at institutions of higher learning.
Kid’s Community College® will be located in a new medical arts plaza, which has already shown a need and interest for child care services. The center currently has a pediatrics office and fitness center with clientele that has inquired about child care services. By forming collaborative partnerships with these businesses and becoming an active voice in the Lake St. Charles community, the college will position itself as the market share leader in child care services, development and educational offerings.
Sales Literature
A copy of the Kid’s Community College® informational brochure is attached in an appendix at the end of this document.
Fulfillment
The key fulfillment and delivery of services will be provided by the campus director, licensed campus instructors and staff workers. The real core value is the professional strength and industry expertise of the founder and silent partners, staff experience and certifications, education and hard work (in that order).
We will turn to qualified professionals for freelance back-up in tutoring and educational support, which will enhance the core values provided to the clients.
Technology
Since the company founder has an extensive Information Technology background, it’s only natural that Kid’s Community College® will employ and maintain the latest technology to enhance its curriculum, office management systems, payment processing and record keeping.
Future Services
Three additional campuses are planned in the rural Tampa marketplace over the next four years. Franchise start-ups will be offered in the Orlando, Miami and Jacksonville marketplace after 2 years of successful operation.
Market Analysis Summary
Kid’s Community College® offers services which are vitally important in today’s fast paced, dual-income world. As an increasing number of families have become dependent on two incomes, the need for quality child care has skyrocketed. According to Florida Business Statistics, 84.6% of licensed child care facilities succeed and make a profit in their 1st year of operation. Nationally, this number is 66.7%.
There is no doubt, in the Riverview, FL area, that there is room and a need for Kid’s Community College®. Market demographics to support this statement can be found below.
Brought to you by
Create a professional business plan
Using AI and step-by-step instructions
Create Your PlanSecure funding
Validate ideas
Build a strategy
Market Segmentation
Kid’s Community College® has a focus on meeting the local community need for child care services within the 10-mile radius of Riverview. Students will be taken in flexibly on either a full-time or part-time basis.
Full-Time Working Couples
The college will establish a significantly large, full-time, regular client base in order to establish the healthy, consistent revenue base which will ensure stability of the business. Customer and community relations are extremely important, as it is imperative to keep the parents pleased in order to keep their children in the college.
After School Care
Another large segment of the college’s business will be in the after school care market. This client base will provide a higher profit for the college since instructor-to-student ratios are higher, and the students require more educational services, which are the primary focus of the college. By offering tutoring, and advanced studies in technology, theatre, arts and sciences, the college will attract these profitable business clients, producing significant supplemental revenues.
Part-Time Workers/Drop-Ins
Part-time workers and Drop-Ins from the fitness center and locals businesses will comprise less than 1% of the revenues. While this market is not a primary focus, sufficient flexibility to handle this market is important to the local ‘word-of-mouth’ marketing strategy.
| Market Analysis | |||||||
| Year 1 | Year 2 | Year 3 | Year 4 | Year 5 | |||
| Potential Customers | Growth | CAGR | |||||
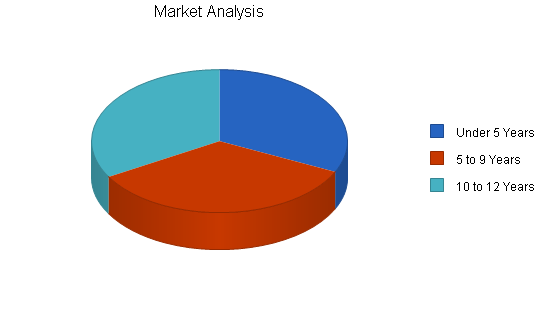
| Under 5 Years | 6% | 2,665 | 2,825 | 2,995 | 3,175 | 3,366 | 6.01% |
| 5 to 9 Years | 6% | 2,865 | 3,037 | 3,219 | 3,412 | 3,617 | 6.00% |
| 10 to 12 Years | 6% | 2,771 | 2,937 | 3,113 | 3,300 | 3,498 | 6.00% |
| Total | 6.00% | 8,301 | 8,799 | 9,327 | 9,887 | 10,481 | 6.00% |
Target Market Segment Strategy
The target market for Kid’s Community College® is full-time working couples. Referral marketing, direct-mail campaigns and community activity days will be the primary types of marketing strategies utilized. Maintaining and enhancing its reputation with families and in the community will be crucial in obtaining the planned market share growth of this target market.
Market Growth
According to US Census 2000 data, the population growth rate for Hillsborough county is approximately 2%, which is reflected in the market analysis summary. However, the Riverview area of Hillsborough County is experiencing a residential construction boom, yielding well over a 14.6% growth. This is supported by data obtained from the Hillsborough County Building Permits office and is included in the appendix of this plan. This suggests that more families continue to move into the Riverview area, thus becoming potential customers.
In our market analysis, we suggest a modest 6% yearly growth in the number of potential customers.
Market Needs
With inflation continuing to rise each year, the typical American family now requires dual or supplemental incomes. This trend has created a need for quality child care services. We do not see this model changing in the foreseeable future. In fact, based on the growth in the Riverview area, specifically the new Lake St. Charles and Village of Lake St. Charles communities, we expect the need to increase.
Market Trends
Currently there are more family caregivers than licensed child care facilities nationwide. However, this business model can’t keep up with the needs of the growing child care industry. In the family care giver paradigm, space is limited and quality of care is questionable – in many cases viewed as only slightly higher quality than babysitter services.
Service Business Analysis
Kid’s Community College® is in the child care services industry, which includes several models:
- Licensed Child Care Facilities: Business facilities that offer child daycare services.
- Family Child Care Homes: Individuals that offer child daycare services in their homes.
- Specific Interest Based Programs: Businesses that offer specialized instruction such as gymnastics, martial arts and athletics.
- Church Child Care Facilities: Religious organizations that offer child daycare services in their communities.
Competition and Buying Patterns
Price, service, certification and reputation are critical success factors in the child care services industry. Kid’s Community College® will compete well in our market by offering competitive prices, high-quality child care services, and leading-edge educational programs with certified, college-educated instructors, and by maintaining an excellent reputation with parents and the community in which we serve.
Main Competitors
- Catholic Church Day Care:
- Strengths: Large church congregation. Already established in market.
- Weaknesses: May not appeal to customers of different religious beliefs. Unlicensed facility. Non-accredited.
- Martial Arts America – Kick Kare:
- Strengths: Already established in area. Martial arts offering with child care services.
- Weaknesses: Location – outside of middle-income market. Non-educational offering. Building condition – prone to constant flooding.
- Family Child Care Homes:
- Strengths: Established in market. “Personal” service.
- Weaknesses: Capacity – only allowed a certain number of children. Non-professional stigma.
Business Participants
- Licensed Child Care Centers: Kids Kountry, Lapetite Academy, Mary Go Round Child Care Center and Bloomingdale Academy. While these centers are within the 10-mile radius target area, none are inside a 5-mile radius of the Lake St. Charles community. None of these facilities are nationally accredited.
- Family Child Care Homes: Mindy Rumore FCCH and Stacie Dawn Hamann FCCH.
- Specific Interest Based Programs: Martial Arts America
- Church Child Care Facilities: Christian Day Academy (not licensed).
Strategy and Implementation Summary
Kid’s Community College® will focus on two subdivisions: ‘Lake St. Charles’ and ‘The Villages of Lake St. Charles,’ which are new upscale community developments within a 2 square mile radius and boast over 900 new homes.
The target customers are dual income, middle-class families who value the quality of education and child care provided for their children ages 4 months to 12 years.
Value Proposition
Kid’s Community College’s® value proposition is quite clear and quite easily distinguished from others in the market. We offer uniquely premium child care services, as measured by the curriculum and activities offered, experience and educational level of the instructors, community involvement and community college theme.
Competitive Edge
We start with a critical competitive edge: there is no competitor in our market that is offering our concept, quality of educational program and child care services. Our educational approach is unique and we have a resource with over 25 years of child care expertise and over 17 years of technology savvy. Our positioning on these points is very hard to match, but only if we maintain the focus in our strategy, marketing, business development, and fulfillment. We should be aware that the tendency to dilute this expertise with bargain shopping could weaken the importance of our competitive edge, but we must continue to bolster our value proposition.
Marketing Strategy
Marketing in the child care industry depends largely on reputation and referral. At Kid’s Community College® that reputation will start within our community bolstered by our involved commitment to those we serve.
Promotion Strategy
We will depend on client referrals, community exposure and direct mail campaigns as our main way to reach new clients. As we change strategies, however, we need to change the way we promote ourselves:
Brought to you by
Create a professional business plan
Using AI and step-by-step instructions
Create Your PlanSecure funding
Validate ideas
Build a strategy
1. Advertising–We’ll be developing our core positioning message: “A community college for kids!” to differentiate our service from the competition. We will be using direct mail campaigns, pre-enrollment drives, and local community newspaper advertising to launch the initial campaign.
2. Sales Brochure–Our theme and curriculum will help sell the college to prospective clients.
3. Direct Mail–We will send quarterly direct mail campaigns to the housing developments in a 10-mile radius of the campus. We will also offer monthly calendars for parents and the Lake St. Charles community, noting weekend family days and other open house approaches.
4. Community Involvement–We will be active in the Lake St. Charles community, sponsoring events at the community center for families and residents.
Marketing Programs
Catered open houses, parent survival days/nights, clubhouse pool parties and weekend movie matinees are but a few approaches we will utilize to reach out to our community. We will also develop and maintain partnerships with local businesses that cater to the needs of children.
Our pre-opening effort will include an application fee waiver, free children ID cards, T-shirts and a community block party sponsored and hosted by Kid’s Community College®.
Positioning Statement
For families who value the importance of higher education and quality child care services, Kid’s Community College® offers a great alternative to traditional child care services and specific interest based programs. Unlike those programs, KCC combines child care services with a modified collegiate level curriculum, just for kids!
Pricing Strategy
Kid’s Community College® must charge appropriately for the high-end, high-quality educational and care giving services we offer. Our revenue structure has to support our cost structure, so the salaries we pay to assure quality services must be balanced by the revenue we charge.
We will be price competitive in the market we serve; however, we will not subscribe to the “low price leader” concept. The quality of our service will support the prices we charge.
Sales Strategy
Kid’s Community College® will sell its community college theme, services and offerings, separating itself from traditional daycare-only offerings.
We will be a one-stop shop for child care services, advanced learning and specialized program offerings. We will also be active in the community, building a solid reputation with parents and the community. By succeeding in these areas, we expect to begin seeing an operational net profit in month nine of the 1st year, while increasing enrollment by 32% monthly for the first 8 months and gradually thereafter, until our maximum allowed capacity is reached.
Sales Forecast
The following table and chart give a run-down on forecasted sales. A detailed spreadsheet is also included in the appendix of this business plan.
For the first eight months of operation, Kid’s Community College® has assumed a conservative enrollment due to the fact that school, aftercare and child care placement has already taken place for the school year and most parents will be comfortable with their current arrangements. Consequently, we expect initial enrollment to be far less than anticipated future year levels.
A sales increase of approximately 32% each month is expected until the start of the next school term, in August. While this forecasted increase seems large by industry standards, it is a good estimate based on initial enrollment. Going into years 2 and 3, we expect that our presence will be known, convenience factor considered and we will then be a considered as a choice in August 2003. In fiscal years 2004 and 2005, 80% and 90% of full enrollment is assumed respectively.
We expect to be open for business on January 1, 2003, starting with an initial enrollment of 13 students:
7 Full-time students at $115 each per week. 6 After-school students at $60 each per week and Drop-in revenue of approximately $100 per month.


| Sales Forecast | |||
| Year 1 | Year 2 | Year 3 | |
| Unit Sales | |||
| Full-time Couples | 199 | 455 | 512 |
| After School Care | 141 | 220 | 248 |
| Summer Camp | 26 | 29 | 31 |
| Part-time Workers/Drop-Ins | 12 | 14 | 16 |
| Total Unit Sales | 378 | 718 | 807 |
| Unit Prices | Year 1 | Year 2 | Year 3 |
| Full-time Couples | $460.00 | $460.00 | $460.00 |
| After School Care | $240.00 | $240.00 | $240.00 |
| Summer Camp | $460.00 | $460.00 | $460.00 |
| Part-time Workers/Drop-Ins | $100.00 | $100.00 | $100.00 |
| Sales | |||
| Full-time Couples | $91,540 | $209,300 | $235,520 |
| After School Care | $33,840 | $52,800 | $59,400 |
| Summer Camp | $11,960 | $13,340 | $14,352 |
| Part-time Workers/Drop-Ins | $1,200 | $1,380 | $1,587 |
| Total Sales | $138,540 | $276,820 | $310,859 |
| Direct Unit Costs | Year 1 | Year 2 | Year 3 |
| Full-time Couples | $13.34 | $13.82 | $13.82 |
| After School Care | $4.56 | $4.75 | $4.75 |
| Summer Camp | $13.80 | $13.80 | $13.80 |
| Part-time Workers/Drop-Ins | $0.00 | $0.00 | $0.00 |
| Direct Cost of Sales | |||
| Full-time Couples | $2,655 | $6,288 | $7,076 |
| After School Care | $643 | $1,045 | $1,176 |
| Summer Camp | $359 | $400 | $431 |
| Part-time Workers/Drop-Ins | $0 | $0 | $0 |
| Subtotal Direct Cost of Sales | $3,656 | $7,733 | $8,682 |
Sales Programs
Sales programs will include incentives for obtaining quarterly financial and enrollment goals, probationary period completion, passing county inspections and maintaining perfect attendance.
Customer service awards will be provided for those employees who best exemplify the mission of Kid’s Community College® and exceed customers’ expectations.
Milestones
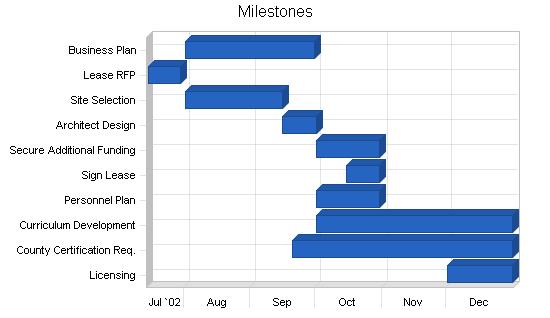
The accompanying table highlights important start-up milestones, with dates, completion status, responsible parties and budgets for each. The milestone schedule indicates our emphasis on planning for implementation.
What the table doesn’t show is the commitment behind it. Our business plan includes complete provisions for plan-vs.-actual analysis, and we will hold monthly follow-up meetings to discuss the variance and course corrections.
| Milestones | |||||
| Milestone | Start Date | End Date | Budget | Manager | Department |
| Business Plan | 8/1/2002 | 9/30/2002 | $200 | Tim Kilpatrick | Department |
| Lease RFP | 7/15/2002 | 7/30/2002 | $0 | Tim Kilpatrick | Department |
| Site Selection | 8/1/2002 | 9/15/2002 | $0 | Tim Kilpatrick | Department |
| Architect Design | 9/15/2002 | 10/1/2002 | $0 | Zimmer | Department |
| Secure Additional Funding | 10/1/2002 | 10/30/2002 | $500 | Tim Kilpatrick | Department |
| Sign Lease | 10/15/2002 | 10/30/2002 | $4,500 | Tim Kilpatrick | Department |
| Personnel Plan | 10/1/2002 | 10/30/2002 | $0 | Tim Kilpatrick | Department |
| Curriculum Development | 10/1/2002 | 12/31/2002 | $500 | Candice Harris | Department |
| County Certification Req. | 9/20/2002 | 12/31/2002 | $100 | Tim Kilpatrick | Department |
| Licensing | 12/1/2002 | 12/31/2002 | $0 | Tim Kilpatrick | Department |
| Totals | $5,800 | ||||
Strategic Alliances
As mentioned previously, Kid’s Community College® will form professional alliances with Impact Fitness to offer Drop-In child care services while parents work out. We will also partner with Family Pediatrics to provide referrals of their existing customers. A discounted rate will be offered in both cases.
Web Plan Summary
The Kid’s Community College® website will be the virtual business card and portfolio for the college, as well as its online “home.”
It will showcase the campus, curriculum and activity calendar for the school. It will also provide for an Internet background of the instructors, online projects posted by the students, the campus newsletter and online enrollment.
The Kid’s Community College® website will be simple, yet classy and well designed, but at the same time, in keeping with the latest trends in user interface design. A site that is too flashy, or tries to use too much of the latest technology can be over-done, and may not be supported by all browsers.
The key to the website strategy will be presenting a very well designed and informative Web presence that will market the Kid’s Community College® image, service offerings and community commitment.
Website Marketing Strategy
The Kid’s Community College® website will embody the mission of the college. It will not only offer visitors the opportunity to “look around” the campus, but it will give them a good idea of the level of quality and service they can come to expect from the college.
Mostly informative in nature, the website will be a digital representation of our physical self.
Development Requirements
The Kid’s Community College® website will be developed by the college founder, Timothy B. Kilpatrick, Sr., who has over 17 years of Information Technology experience. Formation Technologies will host the site.
The site will be developed using Macromedia Dreamweaver 4, which will allow for support outside of Mr. Kilpatrick’s involvement. The initial maintenance of the site will be done by Mr. Kilpatrick.
Management Summary
The opening management team of Kid’s Community College® will consist of the founder, a silent partner, a campus director and administrative assistant.
As the college grows, gradual investments in the instructional staff will be made over the next 3 years – beginning in June 2003 or as otherwise dictated by enrollment.
Organizational Structure
Kid’s Community College® depends on the founder, silent partner, Campus Director and VP of Education Operations for management in the following roles:
Management Team
Owner/President – Timothy B. Kilpatrick, Sr. The Owner/President will have overall fiscal responsibility, ensuring that the business is financially sound and attains its planned goals.
- 17 years Executive Management (VP) and Budgeting experience
- Advanced degree in Computer Science
- Proven leadership and employee development ability
- Extensive experience with budgeting methodologies and strategic planning, including the Balanced Scorecard approach.
Industry Consultant – Carolyn Steverson. The Industry Consultant will be relied upon for her industry expertise, providing valuable insight to rules, regulations and governmental programs that may benefit the college.
- 25 Year owner of Fat Albert Day Care Center
- Licensed child care facility owner
- Vast knowledge of Hillsborough County Child Care Licensing requirements and government supplemental programs
Campus Director – Candice Harris. The Campus Director will be responsible for daily operations, curriculum oversight and management of all instructors, caregivers and tutors.
- B.S. Degree in Education
- 2 years facilities administration/support experience with the University of South Florida
- 2+ years Regional Operations Manager
- 5+ years managerial/supervisory experience
- 3+ years grant writing, technical writing, workflow and process documentation experience
VP of Education Operations – Nitika Steverson-Kilpatrick
- Collegiate-level Public Relations education
- 5+ years customer service experience
- 8+ years child care industry experience (her mother owns Fat Albert Daycare)
- Extensive theatre and dance background
Management Team Gaps
The present team requires Child Care Development Associate credentials to support our value proposition and preparation for 2004 Florida child care requirements. Currently, the Campus Director and Industry Consultant are the only members of the management team who have these credentials.
The Owner/President and VP of Education Operations will be enrolling in January 2003 to complete the six-month course required to obtain these credentials. Education for these two can’t begin in this area until that time since it is a requirement that the college be open for business before the course work can begin. Long-term, all full-time instructors will be required by the college (not the State) to obtain this credential.
Regarding financial administration, we will retain a strong CPA to help the owner guard cash flow. While the owner is well versed in the worries of cash flow, he also has the sense to listen to reason and deal with constraints, as guided by the CPA.
Personnel Plan
The following table summarizes our personnel expenditures for the first three years, with compensation increasing from approximately $57K the first year to about $113K in the third. We believe this plan is a fair compromise between fairness and expedience, and meets the commitment of our mission statement.
The yearly figures in the second and third year are assumptions for the Lake St. Charles campus only. The numbers reflect 100% enrollment, a full staff of instructors and a 5% payroll increase each year – which will include tuition reimbursement, pay increases, vacation pay, bonuses and state required certifications.
| Personnel Plan | |||
| Year 1 | Year 2 | Year 3 | |
| Campus Director | $23,877 | $25,071 | $26,324 |
| F/T Instructors | $21,760 | $61,440 | $64,512 |
| P/T Instructors | $11,400 | $21,600 | $22,680 |
| Total People | 5 | 8 | 8 |
| Total Payroll | $57,037 | $108,111 | $113,516 |
Financial Plan
- Kid’s Community College® will finance growth mainly through cash flow. It is recognized that this means the school will have to grow gradually into the planned four campuses.
- The most important factor in our case is enrollment. We must stay focused on our enrollment plan and maintain budgeted enrollment levels.
- Adequate start-up capital is assumed, along with an SBA 5-year guaranteed loan.
Important Assumptions
The Kid’s Community College® financial plan depends on important assumptions, most of which are shown in the following table as annual assumptions. The monthly assumptions are included in the appendices. From the beginning, it is recognized that total enrollment is critical, which is a factor that must be influenced immediately. Interest rates, tax rates, and personnel burden are based on conservative assumptions.
The most important underlying assumption is that there is a strong need for the business in the Lake St. Charles community.
| General Assumptions | |||
| Year 1 | Year 2 | Year 3 | |
| Plan Month | 1 | 2 | 3 |
| Current Interest Rate | 7.00% | 7.00% | 7.00% |
| Long-term Interest Rate | 7.00% | 7.00% | 7.00% |
| Tax Rate | 30.00% | 30.00% | 30.00% |
| Other | 0 | 0 | 0 |
Key Financial Indicators
The following benchmark chart indicates the key financial indicators for the first three years. We foresee a gradual growth in sales (enrollment) and operating expenses into the second and third year.
It is projected that the raw gross margin will remain stable for the first three years since expenses are relatively indirect in the service based course work industry. Operating expenses increase gradually as enrollment increases.
Enrollment is very important. We must maintain an average weekly enrollment of 34 students for fixed cost coverage.

Break-even Analysis
For the break-even analysis, start-up monthly running costs assumptions are shown in the the table below, including a three person payroll, rent, utilities and an estimation of other running costs. Payroll, at median market averages, was presented previously in the Personnel table.
Based on these assumptions, the chart below shows the enrollment of students per month needed to break-even. This represents about 46% of our allowable monthly enrollment based on state and county course work guidelines.

| Break-even Analysis | |
| Monthly Units Break-even | 34 |
| Monthly Revenue Break-even | $12,350 |
| Assumptions: | |
| Average Per-Unit Revenue | $366.51 |
| Average Per-Unit Variable Cost | $9.67 |
| Estimated Monthly Fixed Cost | $12,024 |
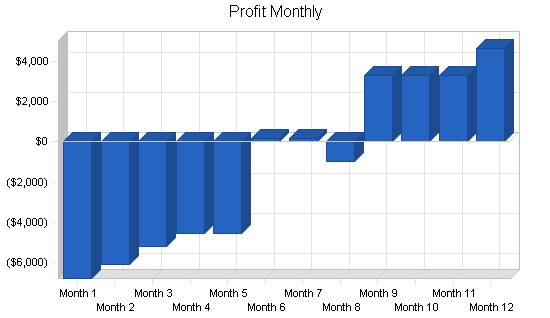
Projected Profit and Loss
Our projected profit and loss is shown on the following table, with sales increasing from the first year to the third.
In years two and three, we are projecting full enrollment regarding cost of sales and gross margin. The investment return in these years supports the goal of opening another campus at the end of the second year and begin the franchise offering by the end of the third year. Profit from the additional campuses and income from franchising are not included in this business plan.
The detailed monthly projections are included in the appendices.


| Pro Forma Profit and Loss | |||
| Year 1 | Year 2 | Year 3 | |
| Sales | $138,540 | $276,820 | $310,859 |
| Direct Cost of Sales | $3,656 | $7,733 | $8,682 |
| Hidden Row | $0 | $0 | $0 |
| Total Cost of Sales | $3,656 | $7,733 | $8,682 |
| Gross Margin | $134,884 | $269,087 | $302,177 |
| Gross Margin % | 97.36% | 97.21% | 97.21% |
| Expenses | |||
| Payroll | $57,037 | $108,111 | $113,516 |
| Sales and Marketing and Other Expenses | $2,200 | $3,500 | $3,500 |
| Depreciation | $0 | $0 | $0 |
| Rent | $58,800 | $59,500 | $60,000 |
| Utilities | $10,500 | $10,500 | $10,500 |
| Insurance | $7,200 | $7,200 | $7,200 |
| Payroll Taxes | $8,556 | $16,217 | $17,027 |
| Other | $0 | $0 | $0 |
| Total Operating Expenses | $144,293 | $205,027 | $211,744 |
| Profit Before Interest and Taxes | ($9,409) | $64,059 | $90,433 |
| EBITDA | ($9,409) | $64,059 | $90,433 |
| Interest Expense | $3,819 | $3,144 | $2,440 |
| Taxes Incurred | $0 | $18,275 | $26,398 |
| Net Profit | ($13,228) | $42,641 | $61,595 |
| Net Profit/Sales | -9.55% | 15.40% | 19.81% |
Projected Cash Flow
The following cash flow projections show the annual amounts only, significant for the first year mainly in the amounts projected in cash sales and payables.
Cash flow projections are critical to the success of Kid’s Community College®. The monthly cash flow is shown in the illustration, with one bar representing the cash flow per month and the other the monthly cash balance. The annual cash flow figures are included here and the more important detailed monthly numbers are included in the appendices.

| Pro Forma Cash Flow | |||
| Year 1 | Year 2 | Year 3 | |
| Cash Received | |||
| Cash from Operations | |||
| Cash Sales | $138,540 | $276,820 | $310,859 |
| Subtotal Cash from Operations | $138,540 | $276,820 | $310,859 |
| Additional Cash Received | |||
| Sales Tax, VAT, HST/GST Received | $0 | $0 | $0 |
| New Current Borrowing | $0 | $0 | $0 |
| New Other Liabilities (interest-free) | $0 | $0 | $0 |
| New Long-term Liabilities | $0 | $0 | $0 |
| Sales of Other Current Assets | $0 | $0 | $0 |
| Sales of Long-term Assets | $0 | $0 | $0 |
| New Investment Received | $0 | $0 | $0 |
| Subtotal Cash Received | $138,540 | $276,820 | $310,859 |
| Expenditures | Year 1 | Year 2 | Year 3 |
| Expenditures from Operations | |||
| Cash Spending | $57,037 | $108,111 | $113,516 |
| Bill Payments | $86,777 | $123,660 | $134,952 |
| Subtotal Spent on Operations | $143,814 | $231,771 | $248,468 |
| Additional Cash Spent | |||
| Sales Tax, VAT, HST/GST Paid Out | $0 | $0 | $0 |
| Principal Repayment of Current Borrowing | $0 | $0 | $0 |
| Other Liabilities Principal Repayment | $0 | $0 | $0 |
| Long-term Liabilities Principal Repayment | $10,057 | $10,057 | $10,057 |
| Purchase Other Current Assets | $0 | $0 | $0 |
| Purchase Long-term Assets | $0 | $0 | $0 |
| Dividends | $0 | $0 | $0 |
| Subtotal Cash Spent | $153,871 | $241,828 | $258,525 |
| Net Cash Flow | ($15,331) | $34,992 | $52,334 |
| Cash Balance | $50,219 | $85,211 | $137,545 |
Projected Balance Sheet
The balance sheet in the following table shows managed but sufficient growth of net worth, and a gradually sufficient healthy financial position. The monthly estimates are included in the appendices.
| Pro Forma Balance Sheet | |||
| Year 1 | Year 2 | Year 3 | |
| Assets | |||
| Current Assets | |||
| Cash | $50,219 | $85,211 | $137,545 |
| Other Current Assets | $14,130 | $14,130 | $14,130 |
| Total Current Assets | $64,349 | $99,341 | $151,675 |
| Long-term Assets | |||
| Long-term Assets | $0 | $0 | $0 |
| Accumulated Depreciation | $0 | $0 | $0 |
| Total Long-term Assets | $0 | $0 | $0 |
| Total Assets | $64,349 | $99,341 | $151,675 |
| Liabilities and Capital | Year 1 | Year 2 | Year 3 |
| Current Liabilities | |||
| Accounts Payable | $7,954 | $10,362 | $11,157 |
| Current Borrowing | $0 | $0 | $0 |
| Other Current Liabilities | $0 | $0 | $0 |
| Subtotal Current Liabilities | $7,954 | $10,362 | $11,157 |
| Long-term Liabilities | $49,943 | $39,886 | $29,829 |
| Total Liabilities | $57,897 | $50,248 | $40,986 |
| Paid-in Capital | $59,130 | $59,130 | $59,130 |
| Retained Earnings | ($39,450) | ($52,678) | ($10,037) |
| Earnings | ($13,228) | $42,641 | $61,595 |
| Total Capital | $6,452 | $49,093 | $110,688 |
| Total Liabilities and Capital | $64,349 | $99,341 | $151,675 |
| Net Worth | $6,452 | $49,093 | $110,688 |
Business Ratios
The following table shows the projected businesses ratios for our industry: Child Day Care services, SIC code 8351. Kid’s Community College® expects to maintain healthy ratios for profitability, risk, and return.
| Ratio Analysis | ||||
| Year 1 | Year 2 | Year 3 | Industry Profile | |
| Sales Growth | n.a. | 99.81% | 12.30% | 6.98% |
| Percent of Total Assets | ||||
| Other Current Assets | 21.96% | 14.22% | 9.32% | 30.21% |
| Total Current Assets | 100.00% | 100.00% | 100.00% | 60.28% |
| Long-term Assets | 0.00% | 0.00% | 0.00% | 39.72% |
| Total Assets | 100.00% | 100.00% | 100.00% | 100.00% |
| Current Liabilities | 12.36% | 10.43% | 7.36% | 27.78% |
| Long-term Liabilities | 77.61% | 40.15% | 19.67% | 24.23% |
| Total Liabilities | 89.97% | 50.58% | 27.02% | 52.01% |
| Net Worth | 10.03% | 49.42% | 72.98% | 47.99% |
| Percent of Sales | ||||
| Sales | 100.00% | 100.00% | 100.00% | 100.00% |
| Gross Margin | 97.36% | 97.21% | 97.21% | 100.00% |
| Selling, General & Administrative Expenses | 113.51% | 78.74% | 72.22% | 81.45% |
| Advertising Expenses | 0.00% | 0.00% | 0.00% | 0.88% |
| Profit Before Interest and Taxes | -6.79% | 23.14% | 29.09% | 1.52% |
| Main Ratios | ||||
| Current | 8.09 | 9.59 | 13.59 | 1.96 |
| Quick | 8.09 | 9.59 | 13.59 | 1.56 |
| Total Debt to Total Assets | 89.97% | 50.58% | 27.02% | 60.93% |
| Pre-tax Return on Net Worth | -205.01% | 124.08% | 79.50% | 2.47% |
| Pre-tax Return on Assets | -20.56% | 61.32% | 58.01% | 6.32% |
| Additional Ratios | Year 1 | Year 2 | Year 3 | |
| Net Profit Margin | -9.55% | 15.40% | 19.81% | n.a |
| Return on Equity | -205.01% | 86.86% | 55.65% | n.a |
| Activity Ratios | ||||
| Accounts Payable Turnover | 11.91 | 12.17 | 12.17 | n.a |
| Payment Days | 27 | 27 | 29 | n.a |
| Total Asset Turnover | 2.15 | 2.79 | 2.05 | n.a |
| Debt Ratios | ||||
| Debt to Net Worth | 8.97 | 1.02 | 0.37 | n.a |
| Current Liab. to Liab. | 0.14 | 0.21 | 0.27 | n.a |
| Liquidity Ratios | ||||
| Net Working Capital | $56,396 | $88,979 | $140,517 | n.a |
| Interest Coverage | -2.46 | 20.37 | 37.06 | n.a |
| Additional Ratios | ||||
| Assets to Sales | 0.46 | 0.36 | 0.49 | n.a |
| Current Debt/Total Assets | 12% | 10% | 7% | n.a |
| Acid Test | 8.09 | 9.59 | 13.59 | n.a |
| Sales/Net Worth | 21.47 | 5.64 | 2.81 | n.a |
| Dividend Payout | 0.00 | 0.00 | 0.00 | n.a |
Appendix
| Sales Forecast | |||||||||||||
| Month 1 | Month 2 | Month 3 | Month 4 | Month 5 | Month 6 | Month 7 | Month 8 | Month 9 | Month 10 | Month 11 | Month 12 | ||
| Unit Sales | |||||||||||||
| Full-time Couples | 0% | 6 | 8 | 10 | 12 | 12 | 10 | 10 | 20 | 27 | 27 | 27 | 30 |
| After School Care | 0% | 6 | 6 | 6 | 6 | 6 | 8 | 8 | 15 | 20 | 20 | 20 | 20 |
| Summer Camp | 0% | 0 | 0 | 0 | 0 | 0 | 13 | 13 | 0 | 0 | 0 | 0 | 0 |
| Part-time Workers/Drop-Ins | 0% | 1 | 1 | 1 | 1 | 1 | 1 | 1 | 1 | 1 | 1 | 1 | 1 |
| Total Unit Sales | 13 | 15 | 17 | 19 | 19 | 32 | 32 | 36 | 48 | 48 | 48 | 51 | |
| Unit Prices | Month 1 | Month 2 | Month 3 | Month 4 | Month 5 | Month 6 | Month 7 | Month 8 | Month 9 | Month 10 | Month 11 | Month 12 | |
| Full-time Couples | $460.00 | $460.00 | $460.00 | $460.00 | $460.00 | $460.00 | $460.00 | $460.00 | $460.00 | $460.00 | $460.00 | $460.00 | |
| After School Care | $240.00 | $240.00 | $240.00 | $240.00 | $240.00 | $240.00 | $240.00 | $240.00 | $240.00 | $240.00 | $240.00 | $240.00 | |
| Summer Camp | $460.00 | $460.00 | $460.00 | $460.00 | $460.00 | $460.00 | $460.00 | $460.00 | $460.00 | $460.00 | $460.00 | $460.00 | |
| Part-time Workers/Drop-Ins | $100.00 | $100.00 | $100.00 | $100.00 | $100.00 | $100.00 | $100.00 | $100.00 | $100.00 | $100.00 | $100.00 | $100.00 | |
| Sales | |||||||||||||
| Full-time Couples | $2,760 | $3,680 | $4,600 | $5,520 | $5,520 | $4,600 | $4,600 | $9,200 | $12,420 | $12,420 | $12,420 | $13,800 | |
| After School Care | $1,440 | $1,440 | $1,440 | $1,440 | $1,440 | $1,920 | $1,920 | $3,600 | $4,800 | $4,800 | $4,800 | $4,800 | |
| Summer Camp | $0 | $0 | $0 | $0 | $0 | $5,980 | $5,980 | $0 | $0 | $0 | $0 | $0 | |
| Part-time Workers/Drop-Ins | $100 | $100 | $100 | $100 | $100 | $100 | $100 | $100 | $100 | $100 | $100 | $100 | |
| Total Sales | $4,300 | $5,220 | $6,140 | $7,060 | $7,060 | $12,600 | $12,600 | $12,900 | $17,320 | $17,320 | $17,320 | $18,700 | |
| Direct Unit Costs | Month 1 | Month 2 | Month 3 | Month 4 | Month 5 | Month 6 | Month 7 | Month 8 | Month 9 | Month 10 | Month 11 | Month 12 | |
| Full-time Couples | 2.90% | $13.34 | $13.34 | $13.34 | $13.34 | $13.34 | $13.34 | $13.34 | $13.34 | $13.34 | $13.34 | $13.34 | $13.34 |
| After School Care | 1.90% | $4.56 | $4.56 | $4.56 | $4.56 | $4.56 | $4.56 | $4.56 | $4.56 | $4.56 | $4.56 | $4.56 | $4.56 |
| Summer Camp | 3.00% | $13.80 | $13.80 | $13.80 | $13.80 | $13.80 | $13.80 | $13.80 | $13.80 | $13.80 | $13.80 | $13.80 | $13.80 |
| Part-time Workers/Drop-Ins | 0.00% | $0.00 | $0.00 | $0.00 | $0.00 | $0.00 | $0.00 | $0.00 | $0.00 | $0.00 | $0.00 | $0.00 | $0.00 |
| Direct Cost of Sales | |||||||||||||
| Full-time Couples | $80 | $107 | $133 | $160 | $160 | $133 | $133 | $267 | $360 | $360 | $360 | $400 | |
| After School Care | $27 | $27 | $27 | $27 | $27 | $36 | $36 | $68 | $91 | $91 | $91 | $91 | |
| Summer Camp | $0 | $0 | $0 | $0 | $0 | $179 | $179 | $0 | $0 | $0 | $0 | $0 | |
| Part-time Workers/Drop-Ins | $0 | $0 | $0 | $0 | $0 | $0 | $0 | $0 | $0 | $0 | $0 | $0 | |
| Subtotal Direct Cost of Sales | $107 | $134 | $161 | $187 | $187 | $349 | $349 | $335 | $451 | $451 | $451 | $491 | |
| Personnel Plan | |||||||||||||
| Month 1 | Month 2 | Month 3 | Month 4 | Month 5 | Month 6 | Month 7 | Month 8 | Month 9 | Month 10 | Month 11 | Month 12 | ||
| Campus Director | 0% | $1,833 | $1,833 | $1,833 | $2,042 | $2,042 | $2,042 | $2,042 | $2,042 | $2,042 | $2,042 | $2,042 | $2,042 |
| F/T Instructors | 0% | $1,280 | $1,280 | $1,280 | $1,280 | $1,280 | $1,280 | $1,280 | $2,560 | $2,560 | $2,560 | $2,560 | $2,560 |
| P/T Instructors | 0% | $600 | $600 | $600 | $600 | $600 | $1,200 | $1,200 | $1,200 | $1,200 | $1,200 | $1,200 | $1,200 |
| Total People | 3 | 3 | 3 | 3 | 3 | 4 | 4 | 5 | 5 | 5 | 5 | 5 | |
| Total Payroll | $3,713 | $3,713 | $3,713 | $3,922 | $3,922 | $4,522 | $4,522 | $5,802 | $5,802 | $5,802 | $5,802 | $5,802 | |
| General Assumptions | |||||||||||||
| Month 1 | Month 2 | Month 3 | Month 4 | Month 5 | Month 6 | Month 7 | Month 8 | Month 9 | Month 10 | Month 11 | Month 12 | ||
| Plan Month | 1 | 2 | 3 | 4 | 5 | 6 | 7 | 8 | 9 | 10 | 11 | 12 | |
| Current Interest Rate | 7.00% | 7.00% | 7.00% | 7.00% | 7.00% | 7.00% | 7.00% | 7.00% | 7.00% | 7.00% | 7.00% | 7.00% | |
| Long-term Interest Rate | 7.00% | 7.00% | 7.00% | 7.00% | 7.00% | 7.00% | 7.00% | 7.00% | 7.00% | 7.00% | 7.00% | 7.00% | |
| Tax Rate | 30.00% | 30.00% | 30.00% | 30.00% | 30.00% | 30.00% | 30.00% | 30.00% | 30.00% | 30.00% | 30.00% | 30.00% | |
| Other | 0 | 0 | 0 | 0 | 0 | 0 | 0 | 0 | 0 | 0 | 0 | 0 | |
| Pro Forma Profit and Loss | |||||||||||||
| Month 1 | Month 2 | Month 3 | Month 4 | Month 5 | Month 6 | Month 7 | Month 8 | Month 9 | Month 10 | Month 11 | Month 12 | ||
| Sales | $4,300 | $5,220 | $6,140 | $7,060 | $7,060 | $12,600 | $12,600 | $12,900 | $17,320 | $17,320 | $17,320 | $18,700 | |
| Direct Cost of Sales | $107 | $134 | $161 | $187 | $187 | $349 | $349 | $335 | $451 | $451 | $451 | $491 | |
| Hidden Row | $0 | $0 | $0 | $0 | $0 | $0 | $0 | $0 | $0 | $0 | $0 | $0 | |
| Total Cost of Sales | $107 | $134 | $161 | $187 | $187 | $349 | $349 | $335 | $451 | $451 | $451 | $491 | |
| Gross Margin | $4,193 | $5,086 | $5,979 | $6,873 | $6,873 | $12,251 | $12,251 | $12,565 | $16,869 | $16,869 | $16,869 | $18,209 | |
| Gross Margin % | 97.50% | 97.43% | 97.38% | 97.35% | 97.35% | 97.23% | 97.23% | 97.40% | 97.39% | 97.39% | 97.39% | 97.37% | |
| Expenses | |||||||||||||
| Payroll | $3,713 | $3,713 | $3,713 | $3,922 | $3,922 | $4,522 | $4,522 | $5,802 | $5,802 | $5,802 | $5,802 | $5,802 | |
| Sales and Marketing and Other Expenses | $0 | $200 | $200 | $200 | $200 | $200 | $200 | $200 | $200 | $200 | $200 | $200 | |
| Depreciation | $0 | $0 | $0 | $0 | $0 | $0 | $0 | $0 | $0 | $0 | $0 | $0 | |
| Rent | $4,900 | $4,900 | $4,900 | $4,900 | $4,900 | $4,900 | $4,900 | $4,900 | $4,900 | $4,900 | $4,900 | $4,900 | |
| Utilities | $875 | $875 | $875 | $875 | $875 | $875 | $875 | $875 | $875 | $875 | $875 | $875 | |
| Insurance | $600 | $600 | $600 | $600 | $600 | $600 | $600 | $600 | $600 | $600 | $600 | $600 | |
| Payroll Taxes | 15% | $557 | $557 | $557 | $588 | $588 | $678 | $678 | $870 | $870 | $870 | $870 | $870 |
| Other | $0 | $0 | $0 | $0 | $0 | $0 | $0 | $0 | $0 | $0 | $0 | $0 | |
| Total Operating Expenses | $10,645 | $10,845 | $10,845 | $11,085 | $11,085 | $11,775 | $11,775 | $13,247 | $13,247 | $13,247 | $13,247 | $13,247 | |
| Profit Before Interest and Taxes | ($6,452) | ($5,759) | ($4,866) | ($4,213) | ($4,213) | $475 | $475 | ($683) | $3,621 | $3,621 | $3,621 | $4,961 | |
| EBITDA | ($6,452) | ($5,759) | ($4,866) | ($4,213) | ($4,213) | $475 | $475 | ($683) | $3,621 | $3,621 | $3,621 | $4,961 | |
| Interest Expense | $345 | $340 | $335 | $330 | $326 | $321 | $316 | $311 | $306 | $301 | $296 | $291 | |
| Taxes Incurred | $0 | $0 | $0 | $0 | $0 | $0 | $0 | $0 | $0 | $0 | $0 | $0 | |
| Net Profit | ($6,797) | ($6,099) | ($5,201) | ($4,543) | ($4,538) | $155 | $160 | ($993) | $3,315 | $3,320 | $3,325 | $4,670 | |
| Net Profit/Sales | -158.08% | -116.84% | -84.71% | -64.35% | -64.28% | 1.23% | 1.27% | -7.70% | 19.14% | 19.17% | 19.20% | 24.97% | |
| Pro Forma Cash Flow | |||||||||||||
| Month 1 | Month 2 | Month 3 | Month 4 | Month 5 | Month 6 | Month 7 | Month 8 | Month 9 | Month 10 | Month 11 | Month 12 | ||
| Cash Received | |||||||||||||
| Cash from Operations | |||||||||||||
| Cash Sales | $4,300 | $5,220 | $6,140 | $7,060 | $7,060 | $12,600 | $12,600 | $12,900 | $17,320 | $17,320 | $17,320 | $18,700 | |
| Subtotal Cash from Operations | $4,300 | $5,220 | $6,140 | $7,060 | $7,060 | $12,600 | $12,600 | $12,900 | $17,320 | $17,320 | $17,320 | $18,700 | |
| Additional Cash Received | |||||||||||||
| Sales Tax, VAT, HST/GST Received | 0.00% | $0 | $0 | $0 | $0 | $0 | $0 | $0 | $0 | $0 | $0 | $0 | $0 |
| New Current Borrowing | $0 | $0 | $0 | $0 | $0 | $0 | $0 | $0 | $0 | $0 | $0 | $0 | |
| New Other Liabilities (interest-free) | $0 | $0 | $0 | $0 | $0 | $0 | $0 | $0 | $0 | $0 | $0 | $0 | |
| New Long-term Liabilities | $0 | $0 | $0 | $0 | $0 | $0 | $0 | $0 | $0 | $0 | $0 | $0 | |
| Sales of Other Current Assets | $0 | $0 | $0 | $0 | $0 | $0 | $0 | $0 | $0 | $0 | $0 | $0 | |
| Sales of Long-term Assets | $0 | $0 | $0 | $0 | $0 | $0 | $0 | $0 | $0 | $0 | $0 | $0 | |
| New Investment Received | $0 | $0 | $0 | $0 | $0 | $0 | $0 | $0 | $0 | $0 | $0 | $0 | |
| Subtotal Cash Received | $4,300 | $5,220 | $6,140 | $7,060 | $7,060 | $12,600 | $12,600 | $12,900 | $17,320 | $17,320 | $17,320 | $18,700 | |
| Expenditures | Month 1 | Month 2 | Month 3 | Month 4 | Month 5 | Month 6 | Month 7 | Month 8 | Month 9 | Month 10 | Month 11 | Month 12 | |
| Expenditures from Operations | |||||||||||||
| Cash Spending | $3,713 | $3,713 | $3,713 | $3,922 | $3,922 | $4,522 | $4,522 | $5,802 | $5,802 | $5,802 | $5,802 | $5,802 | |
| Bill Payments | $246 | $7,392 | $7,607 | $7,630 | $7,681 | $7,685 | $7,923 | $7,924 | $8,095 | $8,203 | $8,198 | $8,194 | |
| Subtotal Spent on Operations | $3,959 | $11,105 | $11,320 | $11,552 | $11,603 | $12,207 | $12,445 | $13,726 | $13,897 | $14,005 | $14,000 | $13,996 | |
| Additional Cash Spent | |||||||||||||
| Sales Tax, VAT, HST/GST Paid Out | $0 | $0 | $0 | $0 | $0 | $0 | $0 | $0 | $0 | $0 | $0 | $0 | |
| Principal Repayment of Current Borrowing | $0 | $0 | $0 | $0 | $0 | $0 | $0 | $0 | $0 | $0 | $0 | $0 | |
| Other Liabilities Principal Repayment | $0 | $0 | $0 | $0 | $0 | $0 | $0 | $0 | $0 | $0 | $0 | $0 | |
| Long-term Liabilities Principal Repayment | $838 | $838 | $838 | $838 | $838 | $838 | $838 | $838 | $838 | $838 | $838 | $838 | |
| Purchase Other Current Assets | $0 | $0 | $0 | $0 | $0 | $0 | $0 | $0 | $0 | $0 | $0 | $0 | |
| Purchase Long-term Assets | $0 | $0 | $0 | $0 | $0 | $0 | $0 | $0 | $0 | $0 | $0 | $0 | |
| Dividends | $0 | $0 | $0 | $0 | $0 | $0 | $0 | $0 | $0 | $0 | $0 | $0 | |
| Subtotal Cash Spent | $4,797 | $11,943 | $12,158 | $12,390 | $12,441 | $13,045 | $13,283 | $14,564 | $14,735 | $14,843 | $14,838 | $14,834 | |
| Net Cash Flow | ($497) | ($6,723) | ($6,018) | ($5,330) | ($5,381) | ($445) | ($683) | ($1,664) | $2,585 | $2,477 | $2,482 | $3,866 | |
| Cash Balance | $65,053 | $58,330 | $52,312 | $46,982 | $41,601 | $41,156 | $40,473 | $38,809 | $41,394 | $43,871 | $46,353 | $50,219 | |
| Pro Forma Balance Sheet | |||||||||||||
| Month 1 | Month 2 | Month 3 | Month 4 | Month 5 | Month 6 | Month 7 | Month 8 | Month 9 | Month 10 | Month 11 | Month 12 | ||
| Assets | Starting Balances | ||||||||||||
| Current Assets | |||||||||||||
| Cash | $65,550 | $65,053 | $58,330 | $52,312 | $46,982 | $41,601 | $41,156 | $40,473 | $38,809 | $41,394 | $43,871 | $46,353 | $50,219 |
| Other Current Assets | $14,130 | $14,130 | $14,130 | $14,130 | $14,130 | $14,130 | $14,130 | $14,130 | $14,130 | $14,130 | $14,130 | $14,130 | $14,130 |
| Total Current Assets | $79,680 | $79,183 | $72,460 | $66,442 | $61,112 | $55,731 | $55,286 | $54,603 | $52,939 | $55,524 | $58,001 | $60,483 | $64,349 |
| Long-term Assets | |||||||||||||
| Long-term Assets | $0 | $0 | $0 | $0 | $0 | $0 | $0 | $0 | $0 | $0 | $0 | $0 | $0 |
| Accumulated Depreciation | $0 | $0 | $0 | $0 | $0 | $0 | $0 | $0 | $0 | $0 | $0 | $0 | $0 |
| Total Long-term Assets | $0 | $0 | $0 | $0 | $0 | $0 | $0 | $0 | $0 | $0 | $0 | $0 | $0 |
| Total Assets | $79,680 | $79,183 | $72,460 | $66,442 | $61,112 | $55,731 | $55,286 | $54,603 | $52,939 | $55,524 | $58,001 | $60,483 | $64,349 |
| Liabilities and Capital | Month 1 | Month 2 | Month 3 | Month 4 | Month 5 | Month 6 | Month 7 | Month 8 | Month 9 | Month 10 | Month 11 | Month 12 | |
| Current Liabilities | |||||||||||||
| Accounts Payable | $0 | $7,138 | $7,353 | $7,374 | $7,425 | $7,420 | $7,659 | $7,654 | $7,822 | $7,929 | $7,925 | $7,920 | $7,954 |
| Current Borrowing | $0 | $0 | $0 | $0 | $0 | $0 | $0 | $0 | $0 | $0 | $0 | $0 | $0 |
| Other Current Liabilities | $0 | $0 | $0 | $0 | $0 | $0 | $0 | $0 | $0 | $0 | $0 | $0 | $0 |
| Subtotal Current Liabilities | $0 | $7,138 | $7,353 | $7,374 | $7,425 | $7,420 | $7,659 | $7,654 | $7,822 | $7,929 | $7,925 | $7,920 | $7,954 |
| Long-term Liabilities | $60,000 | $59,162 | $58,324 | $57,486 | $56,648 | $55,810 | $54,972 | $54,134 | $53,295 | $52,457 | $51,619 | $50,781 | $49,943 |
| Total Liabilities | $60,000 | $66,300 | $65,677 | $64,860 | $64,073 | $63,230 | $62,631 | $61,788 | $61,117 | $60,387 | $59,544 | $58,701 | $57,897 |
| Paid-in Capital | $59,130 | $59,130 | $59,130 | $59,130 | $59,130 | $59,130 | $59,130 | $59,130 | $59,130 | $59,130 | $59,130 | $59,130 | $59,130 |
| Retained Earnings | ($39,450) | ($39,450) | ($39,450) | ($39,450) | ($39,450) | ($39,450) | ($39,450) | ($39,450) | ($39,450) | ($39,450) | ($39,450) | ($39,450) | ($39,450) |
| Earnings | $0 | ($6,797) | ($12,897) | ($18,098) | ($22,641) | ($27,179) | ($27,024) | ($26,865) | ($27,858) | ($24,543) | ($21,223) | ($17,898) | ($13,228) |
| Total Capital | $19,680 | $12,883 | $6,783 | $1,582 | ($2,961) | ($7,499) | ($7,344) | ($7,185) | ($8,178) | ($4,863) | ($1,543) | $1,782 | $6,452 |
| Total Liabilities and Capital | $79,680 | $79,183 | $72,460 | $66,442 | $61,112 | $55,731 | $55,286 | $54,603 | $52,939 | $55,524 | $58,001 | $60,483 | $64,349 |
| Net Worth | $19,680 | $12,883 | $6,783 | $1,582 | ($2,961) | ($7,499) | ($7,344) | ($7,185) | ($8,178) | ($4,863) | ($1,543) | $1,782 | $6,452 |


