
Auto Paradise
Executive Summary
Auto Paradise is a dynamic start-up company requiring $934,100 to establish a two-bay automatic and four-bay self-serve car wash that will provide exceptional car care services to the members of the San Angelo community. Quality services that will exceed expectations will establish Auto Paradise as the premiere car wash service in San Angelo, Texas. Bobby and Vicki Lewallen are pledging $45,000 and are looking for investors to raise an additional $150,000, which represents 20% of the company stock, to establish the company and to secure a Small Business Administration (SBA) loan of $740,400. Auto Paradise will be dedicated to offering the highest quality laser car wash, self-serve car wash and vacuum/shampoo services. Auto Paradise will also offer ATM services and will sell reverse osmosis (RO) water on site.
Auto Paradise has a strong management team. Mr. Lewallen, who will be the President and Chief Executive Officer of the Auto Paradise Texas Corporation (C), has extensive leadership, management and organizational experience. He has served our country for the last 10 years as an officer in the United States Army. During those 10 years, he served one year as a Brigade Logistics Officer and two years as a Company Commander. As such, he helped plan, coordinate and execute several complex deployments and missions.
Extensive research indicates that the mild winter climate in San Angelo will support steady year-round sales. Further, Auto Paradise’s Avenue N location and marketing campaign will attract the local residents, Angelo State University community and Goodfellow Air Force Base customers. Auto Paradise will be near the intersection of two major roads in San Angelo. Direct competition is limited to outdated “tunnel” or friction car washes, lube & washes and convenience stores. Auto Paradise will boast the Laserwash 4000 “touchless, spot-free” system. Washing Equipment of Texas (WET) is located in San Angelo and will provide all equipment and maintenance support.
Auto Paradise will open approximately 90 days after securing financing. Mr. Lewallen is offering several ways to invest in Auto Paradise:
- Company stock: Mr. Lewallen is offering 20% of company stock to investors: offering 1% of company stock for $7,500. This capital will help establish the first Auto Paradise location. Auto Paradise plans to distribute $2,500 per 1% share each of the first three years.
- Secured Investment: Mr. Lewallen is offering a guaranteed 10% annual return for a three year investment. Mr. Lewallen is willing to secure these investments with personal assets/investments.
The SBA loan that Mr. Lewallen will secure from Compass Bank in San Antonio is structured to ensure Auto Paradise’s success during the early months of operation. The $740,400 loan includes two elements designed to help build operating capital. First, the loan includes a 10% ($69,000) construction contingency that will convert to operating capital if the construction costs are consistent with the estimate. It also includes nine months of interim interest which will defer the long-term mortgage payment.
Mr. Lewallen’s ability and willingness to invest substantial cash in launching this business is furthered by the lack of personal dependence on business profits during the first 6-12 months of business. These factors will enable Mr. Lewallen to expand to a second location within the first two years of operation.
1.1 Objectives
1. Average monthly sales of $28,000.
2. Establish second site 12 months after first Auto Paradise opens.
3. Provide initial investors a 33% ($2,500/share) distribution each of the first three years to recover initial investment.
1.2 Mission
Auto Paradise is dedicated to providing its customers the ultimate car care experience. Focusing all of its energy and resources on customer satisfaction and value, while providing owners and employees an excellent reward.

1.3 Keys to Success
Auto Paradise will be near the intersection of two major roads in San Angelo. Direct competition is limited to outdated “tunnel” or friction car washes, lube & washes and convenience stores.
Auto Paradise will boast the Laserwash 4000 “touchless, spot-free” system. Washing Equipment of Texas (WET) is located in San Angelo and will provide all equipment and maintenance support.
Company Summary
Auto Paradise is a dynamic start-up company that will provide exceptional car care services to the members of the San Angelo community. Quality services that exceed expectations will establish Auto Paradise as the premiere car wash service in San Angelo, Texas. It will provide that following products and services to the local community:
- Two Laser Automatic “touch-free and spot-free” car wash bays
- Four “self-serve” bays
- Vacuum and car wash vending services
- Reverse osmosis drinking water.
Auto Paradise will establish its first location one lot from the intersection of Avenue N and Byrant Avenue, which are two of the busiest streets in San Angelo. The lot faces Avenue N and will be accessible from two sides. The ATM and RO dispensers will be accessible from a side road and will not interfere with the car wash traffic.
The facility will have two automatic car wash bays, four self-serve bays and an equipment room/office in the middle of the bays. It will also have four high powered vacuum islands (eight total vacuums), vending area, and an ATM/RO water area.
2.1 Company Ownership
Mr. Lewallen will create Auto Paradise as a Texas C corporation based in Tom Green County. Mr. and Mrs. Lewallen will be the majority owners (80%) with principal investors owning the remaining 20%. As of this writing, it has not yet been chartered and Mr. Lewallen is still considering alternatives.
2.2 Start-up Summary
Total projected start-up expenses (including construction, equipment, land, landscaping and related start-up expenses) come to $934,100. The start-up costs are to be financed by direct owner investment and long term financing.
A. Investment Options. Auto Paradise will open approximately 90 days after securing financing. Mr. Lewallen is offering several ways to invest in Auto Paradise:
- Company stock: Mr. Lewallen is offering 20% of company stock to investors. Auto Paradise is offering 1% of company stock for $7,500. Capital will help establish the first Auto Paradise location and provide “head start” on the second location. Auto Paradise plans to distribute $2,500 per 1% share each of the first three years.
- Secured Investment: Mr. Lewallen is offering a guaranteed 10% return for a three year investment. Mr. Lewallen is willing to secure these investments with personal assets/investments.
B. Financing. The SBA loan that Mr. Lewallen will secure from the SBA is structured to ensure Auto Paradise’s success during the early months of operation. The $740,400 loan includes two elements designed to help build operating capital. First, the loan includes a 10% ($69,000) construction contingency that will convert to operating capital if the construction costs are consistent with the estimate. It also includes 9 months of interim interest which will defer the long-term mortgage payment for 9 months (6 months of operation).
C. Land. Auto Paradise is in the process of securing a lot near (one lot from corner) the intersection of Bryant Ave. and Avenue N, which are two of the busiest streets in San Angelo. The lot will be 165′ along Avenue N and 175′ deep. The purchase is pending the results of a phase I environmental inspection, which is expected to produce favorable results.
D. Construction. Getting a firm construction bid is the next step in the process after securing the initial investors. The architect plans and an actual bid will be the last elements necessary to secure bank financing. The estimates included are from previous projects and are considered generous (on the high-side). The estimated $390,000 includes total construction costs for two automatic and four self-serve bays, parking lot, signage, landscaping and architect fees.
Brought to you by
Create a professional business plan
Using AI and step-by-step instructions
Create Your PlanSecure funding
Validate ideas
Build a strategy
E. Construction Contingency. The 10% construction contingency will cover any unexpected expenses or shortfalls. This may be re-negotiated as a “line of credit” in order to reduce the amount of the loan.
F. Equipment. Washing Equipment of Texas (WET) has provided a detailed estimate for the purchase and installation of the equipment for two automatic bays, four self-serve bays, four vacuum islands (eight vacuums) and a reverse osmosis water dispenser. WET, which is located in San Angelo, will also provide all maintenance and repair services.
The assumptions are shown in the following tables and chart.

| Start-up Funding | |
| Start-up Expenses to Fund | $40,500 |
| Start-up Assets to Fund | $893,500 |
| Total Funding Required | $934,000 |
| Assets | |
| Non-cash Assets from Start-up | $799,000 |
| Cash Requirements from Start-up | $94,500 |
| Additional Cash Raised | $0 |
| Cash Balance on Starting Date | $94,500 |
| Total Assets | $893,500 |
| Liabilities and Capital | |
| Liabilities | |
| Current Borrowing | $0 |
| Long-term Liabilities | $700,000 |
| Accounts Payable (Outstanding Bills) | $0 |
| Other Current Liabilities (interest-free) | $0 |
| Total Liabilities | $700,000 |
| Capital | |
| Planned Investment | |
| Bobby Lewallen | $45,000 |
| Additional Investors (20% Ownership) | $150,000 |
| 10% Construction Contingency | $39,000 |
| Additional Investment Requirement | $0 |
| Total Planned Investment | $234,000 |
| Loss at Start-up (Start-up Expenses) | ($40,500) |
| Total Capital | $193,500 |
| Total Capital and Liabilities | $893,500 |
| Total Funding | $934,000 |
| Start-up | |
| Requirements | |
| Start-up Expenses | |
| Project Closing Costs | $25,000 |
| Summit Funding Fee | $10,500 |
| Misc (Legal/CPA/Misc) | $5,000 |
| Total Start-up Expenses | $40,500 |
| Start-up Assets | |
| Cash Required | $94,500 |
| Other Current Assets | $0 |
| Long-term Assets | $799,000 |
| Total Assets | $893,500 |
| Total Requirements | $934,000 |
Services
Auto Paradise realizes the car wash industry, top to bottom, is a service industry. Auto Paradise will establish itself as the premier car wash facility in San Angelo by providing a quality service for a competitive price and by focusing our staff on customer service. We will offer the following services to the San Angelo community:
- Laser “touch-free and spot-free” car wash (4 different washes: $5, $6, $7, $8)
- Four “self-serve” bays ($1.25 for 4 min cycle)
- Vacuum and car wash vending services($.75 for 4 min cycle)
- Reverse osmosis drinking water ($.25/gal)
- First Convenience Bank Goldkey ATM services.
Market Analysis Summary
Auto Paradise will be focusing on Angelo State University students, local residents and Goodfellow Air force Base drive-by traffic for repeat customers. The volume of drive-by traffic (approx. 14,000 – 17000 cars/day) will provide a high volume of opportunity customers. Our most important group of potential customers are those customers who live and work in the immediate area. Those college students, college faculty and local residents who will want a quick, quality car wash at a competitive price. We will also aggressively pursue building relationships with the local car dealerships to develop additional business opportunities.
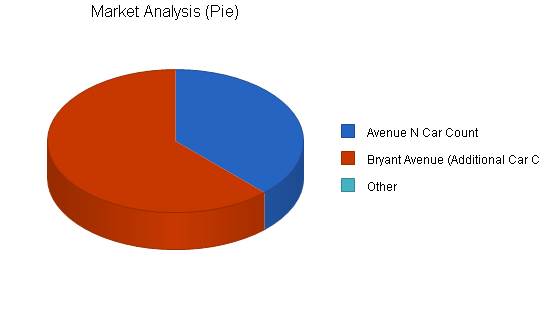
4.1 Market Segmentation
1. College Students/Faculty, Local Residents and Goodfellow Air Force Base traffic.
2. Drive-by Opportunities: 1998 Department of Transportation data indicates the following:
- Avenue N car count: 14,000 cars per day.
- Bryant Avenue car count: 37,000 cars per day (37,000 – 14,000 = 23,000 additional cars).
| Market Analysis | |||||||
| Year 1 | Year 2 | Year 3 | Year 4 | Year 5 | |||
| Potential Customers | Growth | CAGR | |||||
| Avenue N Car Count | 3% | 14,000 | 14,420 | 14,853 | 15,299 | 15,758 | 3.00% |
| Bryant Avenue (Additional Car Count) | 3% | 23,000 | 23,690 | 24,401 | 25,133 | 25,887 | 3.00% |
| Other | 0% | 0 | 0 | 0 | 0 | 0 | 0.00% |
| Total | 3.00% | 37,000 | 38,110 | 39,254 | 40,432 | 41,645 | 3.00% |
4.2 Competition and Buying Patterns
Extensive research indicates that the mild winter climate in San Angelo will support steady year round sales. Further, Auto Paradise’s location and marketing campaign will attract residential, Angelo State University and Goodfellow Air Force Base customers.
Direct competition is limited to outdated “tunnel” or friction car washes, lube and wash and convenience stores.
Auto Paradise will boast the Laserwash 4000 “touchless, spot-free” system.Laserwash is widely recognized as the leader in automatic car wash systems. It will also have attendants on duty Monday – Saturday to provide additional customer service and car preparation. Washing Equipment of Texas (WET) of San Angelo will provide all car wash supplies, equipment and maintenance support. The Laserwash system is a fast, convenient, high quality car wash system that does not damage your car, while offering a great value to its customers. Auto Paradise will increase its customer base by also offering four self-serve bays for those “do-it-yourself” customers.
Strategy and Implementation Summary
The following topics describe our competitive edge, marketing strategy and sales strategy.
5.1 Marketing Strategy
Marketing in our car wash business relies on the name recognition of the Laserwash system as an industry leader and the “curbside” appeal of the site for first time customers. Quality service will bring customers back time and time again. Also, use of a local radio station and the “word of mouth” advertising of satisfied customers will grow our customer base. We will offer a competitive price for all budgets. Our base wash will be $5 and our deluxe wash will be $8.
5.2 Competitive Edge
We start with a critical competitive edge: there is no competitor in San Angelo that offers a 2-bay, 24 hour, automatic and self-serve combination car wash. Our competitors consist of “event washes.” We define “event washes” as self-serve, lube+wash, gas+wash and friction washes. Currently, San Angelo customers must plan significate time and/or effort to get a quality car wash. Our positioning in these areas are very hard to match if we maintain our focus on customer service, speed, quality and reliability.
5.3 Sales Strategy
Sales in our business is client service. It is repeat business. We will ensure the following elements are the building blocks of our marketing/sales strategy:
- 24 hour service availability
- quality service at good value (attendants on duty: 10 – 6, Mon – Sat, who are always focused on customer satisfaction)
- Reliability in all seasons/weather.
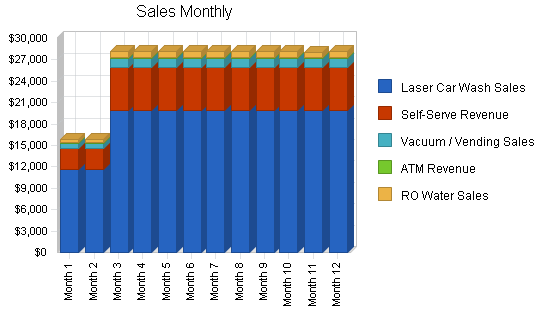
5.3.1 Sales Forecast
The following table and chart give a run-down on forecasted sales. We expect to average over $26,000 in overall sales by the third month of operation. Being an all cash business we also expect to at least break-even during the first two months of operation.
Because of the all-weather capabilities of the Laserwash 4000 system and the mild winters in West Texas, we expect to have relatively consistent sales throughout the year. Variable expenses have been averaged to account for fluctuation in price from season to season.
Plan years 2004 and 2005 have the income and expenses for two sites with the same assumptions for the second site during its first year of operation.
Projected Gross Revenue:
- Both Automatic Bays are projected to average 61 cars/day the first two months and 105 cars/day after the business is well established. Wash prices will vary, currently $5.00 to $8.00, depending on the options the customers selects. Projected automatic wash revenue assumes an average of $6.25 per wash.
- Self-Serve Bay income is projected at $1,500 per month. This assumes 40 cycles per bay each day. A cycle is $1.25 for 4 minutes. The average self-serve customer spends $4.50 per wash.
- Vacuum and Vending revenue is projected to be 5% of aggregate automatic and self-serve revenue. This projection is based on a vacuum price of $.75 for 4 minutes.
- Reverse Osmosis Water revenue is projected to be $750 per/month. Drinking water in San Angelo is a significant market. Reverse osmosis water will be offered at $.25 per/gallon.
- ATM revenue is projected to be $100/month. First Convenience Bank will fully maintain the ATM.
Note: All numbers assume a second site is opened at the beginning of the second year.

| Sales Forecast | |||
| Year 1 | Year 2 | Year 3 | |
| Sales | |||
| Laser Car Wash Sales | $222,802 | $462,334 | $479,064 |
| Self-Serve Revenue | $66,000 | $138,000 | $144,000 |
| Vacuum / Vending Sales | $14,440 | $29,600 | $30,672 |
| ATM Revenue | $1,096 | $2,224 | $2,304 |
| RO Water Sales | $8,500 | $19,224 | $19,920 |
| Total Sales | $312,838 | $651,382 | $675,960 |
| Direct Cost of Sales | Year 1 | Year 2 | Year 3 |
| Laser Car Wash Sales | $50,130 | $104,025 | $107,789 |
| Self-Serve Revenue | $7,333 | $15,332 | $15,998 |
| Vacuum / Vending Sales | $2,834 | $5,950 | $6,231 |
| ATM Revenue | $0 | $0 | $0 |
| RO Water Sales | $0 | $0 | $0 |
| Subtotal Direct Cost of Sales | $60,297 | $125,307 | $130,018 |
Brought to you by
Create a professional business plan
Using AI and step-by-step instructions
Create Your PlanSecure funding
Validate ideas
Build a strategy
Management Summary
Auto Paradise has a strong management team. Mr. Lewallen, who will be the President and Chief Executive Officer of the Auto Paradise Texas Corporation (C), has extensive leadership, management and organization experience. He has served our country for the last 10 years as an officer in the United States Army. During those 10 years, he served one year as a Brigade logistics officer and two years as a company commander. As such, he helped plan, coordinate and execute several complex deployments and missions.
6.1 Personnel Plan
The following table summarizes our personnel expenditures for the first three years, with compensation increasing from less than $50,000 the first year to about $140K in the third. Mr. Lewallen will be the CEO and will manage the Avenue N location. Two attendants will staff the wash Monday – Saturday. They will provide customer service, vehicle prep at the automatic washes and maintain the car wash site. The detailed monthly personnel plan for the first year is included in the appendix.
| Personnel Plan | |||
| Year 1 | Year 2 | Year 3 | |
| 2 Attendants, 1st site | $24,000 | $24,000 | $24,000 |
| Manager, 1st site (Owner) | $18,000 | $36,000 | $36,000 |
| 2 Attentants, 2nd site | $0 | $24,000 | $24,000 |
| Manager, 2nd site (Owner) | $0 | $18,000 | $36,000 |
| Total People | 3 | 5 | 5 |
| Total Payroll | $42,000 | $102,000 | $120,000 |
Financial Plan
Our business is an “all cash” business that will pay for all variable and fixed expenses monthly. Thus, we will rapidly build cash flow to finance future growth. During the first nine months (six months of operation), two key issues will assist Auto Paradise in rapidly building capital:
- Nine months (three months construction, six months of operation) of deferred long-term loan repayment ($7,081 savings/month)
- CEO/manager will not receive a salary for at least six months ($3,000 savings/month).
7.1 Important Assumptions
The financial plan depends on important assumptions, most of which are shown in the following table as annual assumptions. From the beginning, we recognize that variable expenses are critical. Cost of water, sewer and electricity are our largest expenses. Water is our major concern in West Texas. We are planning for this possibility by installing all of the required storage, electrical and plumbing for a total water reclamation system.
Two of the more important underlying assumptions are:
- We assume our long term financing includes nine months of interim interest for repayment.
- We assume a sound economy, without major recession despite our modest pricing.
- We assume, of course, that there are no unforeseen changes in local regulations that will interrupt our service.
| General Assumptions | |||
| Year 1 | Year 2 | Year 3 | |
| Plan Month | 1 | 2 | 3 |
| Current Interest Rate | 7.50% | 7.50% | 7.50% |
| Long-term Interest Rate | 8.00% | 8.00% | 8.00% |
| Tax Rate | 20.83% | 20.00% | 20.83% |
| Other | 0 | 0 | 0 |
7.2 Break-even Analysis
The break-even analysis table below the following revenue sources:
1. Laser Car Wash Sales
2. Vacuum/vending sales
3. ATM revenue
4. Reverse Osmosis water revenue.

| Break-even Analysis | |
| Monthly Revenue Break-even | $16,059 |
| Assumptions: | |
| Average Percent Variable Cost | 19% |
| Estimated Monthly Fixed Cost | $12,964 |
7.3 Projected Profit and Loss
Projected Revenue. See “Sales Forecast” for a detailed breakdown of projected revenue.
Projected Operating Expenses.
- Direct Cost of Automatic Sales.
- Chemicals. Average 8.6% of gross revenue. Chemicals include soap, wax and salt.
- Utilities. Average 13.9% of gross revenue. Utilities include water, electricity, gas and sewer.
- Direct Cost of Self-Serve Sales. Total cost averages 11.1% of self-serve revenue.
- Direct Cost of Vacuum/Vending Sales. Average 1% of aggregate automatic and self-serve revenue.
- Variable/Fixed Expenses
- Labor. Labor is estimated to be $2,000/month with an additional 15% burden to cover related payroll taxes and workman’s compensation insurance. Based on two part time employees, 70 total hours/week @ $6.50/hr.
- Repair and Maintenance includes $750/month for monthly service provided by WET and $100/month to clean each wash bay pit.
- Real Estate Taxes are estimated at 3% of value of land and construction costs ($500,000).
- General Liability Insurance is estimated at $1800/year.
Depreciation. Depreciation was calculated as follows:
- Equipment. $295,000 ¸ 6 years ¸ 12 months = $4,097/month
- Construction: $390,000 ¸ 15 years ¸ 12 months = $2,167/month


| Pro Forma Profit and Loss | |||
| Year 1 | Year 2 | Year 3 | |
| Sales | $312,838 | $651,382 | $675,960 |
| Direct Cost of Sales | $60,297 | $125,307 | $130,018 |
| Other Production Expenses | $0 | $0 | $0 |
| Total Cost of Sales | $60,297 | $125,307 | $130,018 |
| Gross Margin | $252,541 | $526,075 | $545,942 |
| Gross Margin % | 80.73% | 80.76% | 80.77% |
| Expenses | |||
| Payroll | $42,000 | $102,000 | $120,000 |
| Sales and Marketing and Other Expenses | $17,400 | $34,800 | $34,800 |
| Depreciation | $75,168 | $150,336 | $150,336 |
| Accounting / Legal | $1,200 | $2,400 | $2,400 |
| Dumpster / Telephone / Pager | $1,500 | $3,000 | $3,000 |
| Insurance | $1,800 | $3,600 | $3,600 |
| Repairs / Maintenance | $10,200 | $20,400 | $20,400 |
| Payroll Taxes | $6,300 | $15,300 | $18,000 |
| Other | $0 | $0 | $0 |
| Total Operating Expenses | $155,568 | $331,836 | $352,536 |
| Profit Before Interest and Taxes | $96,973 | $194,239 | $193,406 |
| EBITDA | $172,141 | $344,575 | $343,742 |
| Interest Expense | $55,603 | $84,490 | $111,401 |
| Taxes Incurred | $7,963 | $21,950 | $17,084 |
| Net Profit | $33,407 | $87,800 | $64,920 |
| Net Profit/Sales | 10.68% | 13.48% | 9.60% |
7.4 Projected Cash Flow
The following table outlines are estimated cash flow.

| Pro Forma Cash Flow | |||
| Year 1 | Year 2 | Year 3 | |
| Cash Received | |||
| Cash from Operations | |||
| Cash Sales | $312,838 | $651,382 | $675,960 |
| Subtotal Cash from Operations | $312,838 | $651,382 | $675,960 |
| Additional Cash Received | |||
| Sales Tax, VAT, HST/GST Received | $0 | $0 | $0 |
| New Current Borrowing | $0 | $0 | $0 |
| New Other Liabilities (interest-free) | $0 | $0 | $0 |
| New Long-term Liabilities | $0 | $771,390 | $0 |
| Sales of Other Current Assets | $0 | $0 | $0 |
| Sales of Long-term Assets | $0 | $0 | $0 |
| New Investment Received | $0 | $0 | $0 |
| Subtotal Cash Received | $312,838 | $1,422,772 | $675,960 |
| Expenditures | Year 1 | Year 2 | Year 3 |
| Expenditures from Operations | |||
| Cash Spending | $42,000 | $102,000 | $120,000 |
| Bill Payments | $148,606 | $299,321 | $338,283 |
| Subtotal Spent on Operations | $190,606 | $401,321 | $458,283 |
| Additional Cash Spent | |||
| Sales Tax, VAT, HST/GST Paid Out | $0 | $0 | $0 |
| Principal Repayment of Current Borrowing | $0 | $0 | $0 |
| Other Liabilities Principal Repayment | $0 | $0 | $0 |
| Long-term Liabilities Principal Repayment | $9,168 | $40,808 | $57,792 |
| Purchase Other Current Assets | $0 | $0 | $0 |
| Purchase Long-term Assets | $0 | $857,100 | $0 |
| Dividends | $65,000 | $65,000 | $65,000 |
| Subtotal Cash Spent | $264,774 | $1,364,229 | $581,075 |
| Net Cash Flow | $48,064 | $58,543 | $94,885 |
| Cash Balance | $142,564 | $201,107 | $295,992 |
7.5 Projected Balance Sheet
The following table indicates our estimated balance sheet totals.
| Pro Forma Balance Sheet | |||
| Year 1 | Year 2 | Year 3 | |
| Assets | |||
| Current Assets | |||
| Cash | $142,564 | $201,107 | $295,992 |
| Other Current Assets | $0 | $0 | $0 |
| Total Current Assets | $142,564 | $201,107 | $295,992 |
| Long-term Assets | |||
| Long-term Assets | $799,000 | $1,656,100 | $1,656,100 |
| Accumulated Depreciation | $75,168 | $225,504 | $375,840 |
| Total Long-term Assets | $723,832 | $1,430,596 | $1,280,260 |
| Total Assets | $866,396 | $1,631,703 | $1,576,252 |
| Liabilities and Capital | Year 1 | Year 2 | Year 3 |
| Current Liabilities | |||
| Accounts Payable | $13,656 | $25,582 | $28,003 |
| Current Borrowing | $0 | $0 | $0 |
| Other Current Liabilities | $0 | $0 | $0 |
| Subtotal Current Liabilities | $13,656 | $25,582 | $28,003 |
| Long-term Liabilities | $690,832 | $1,421,414 | $1,363,622 |
| Total Liabilities | $704,488 | $1,446,996 | $1,391,625 |
| Paid-in Capital | $234,000 | $234,000 | $234,000 |
| Retained Earnings | ($105,500) | ($137,093) | ($114,293) |
| Earnings | $33,407 | $87,800 | $64,920 |
| Total Capital | $161,907 | $184,707 | $184,627 |
| Total Liabilities and Capital | $866,396 | $1,631,703 | $1,576,252 |
| Net Worth | $161,907 | $184,707 | $184,627 |
7.6 Business Ratios
Business ratios for the years of this plan are shown below. Industry profile ratios based on the Standard Industrial Classification (SIC) code 7542, Car washes, are shown for comparison.
| Ratio Analysis | ||||
| Year 1 | Year 2 | Year 3 | Industry Profile | |
| Sales Growth | 0.00% | 108.22% | 3.77% | 3.00% |
| Percent of Total Assets | ||||
| Other Current Assets | 0.00% | 0.00% | 0.00% | 26.40% |
| Total Current Assets | 16.45% | 12.32% | 18.78% | 44.60% |
| Long-term Assets | 83.55% | 87.68% | 81.22% | 55.40% |
| Total Assets | 100.00% | 100.00% | 100.00% | 100.00% |
| Current Liabilities | 1.58% | 1.57% | 1.78% | 29.30% |
| Long-term Liabilities | 79.74% | 87.11% | 86.51% | 27.80% |
| Total Liabilities | 81.31% | 88.68% | 88.29% | 57.10% |
| Net Worth | 18.69% | 11.32% | 11.71% | 42.90% |
| Percent of Sales | ||||
| Sales | 100.00% | 100.00% | 100.00% | 100.00% |
| Gross Margin | 80.73% | 80.76% | 80.77% | 0.00% |
| Selling, General & Administrative Expenses | 70.15% | 67.28% | 71.06% | 68.20% |
| Advertising Expenses | 0.38% | 0.37% | 0.36% | 1.50% |
| Profit Before Interest and Taxes | 31.00% | 29.82% | 28.61% | 2.70% |
| Main Ratios | ||||
| Current | 10.44 | 7.86 | 10.57 | 1.53 |
| Quick | 10.44 | 7.86 | 10.57 | 0.88 |
| Total Debt to Total Assets | 81.31% | 88.68% | 88.29% | 57.10% |
| Pre-tax Return on Net Worth | 25.55% | 59.42% | 44.42% | 3.40% |
| Pre-tax Return on Assets | 4.77% | 6.73% | 5.20% | 8.00% |
| Additional Ratios | Year 1 | Year 2 | Year 3 | |
| Net Profit Margin | 10.68% | 13.48% | 9.60% | n.a |
| Return on Equity | 20.63% | 47.53% | 35.16% | n.a |
| Activity Ratios | ||||
| Accounts Payable Turnover | 11.88 | 12.17 | 12.17 | n.a |
| Payment Days | 27 | 23 | 29 | n.a |
| Total Asset Turnover | 0.36 | 0.40 | 0.43 | n.a |
| Debt Ratios | ||||
| Debt to Net Worth | 4.35 | 7.83 | 7.54 | n.a |
| Current Liab. to Liab. | 0.02 | 0.02 | 0.02 | n.a |
| Liquidity Ratios | ||||
| Net Working Capital | $128,907 | $175,525 | $267,989 | n.a |
| Interest Coverage | 1.74 | 2.30 | 1.74 | n.a |
| Additional Ratios | ||||
| Assets to Sales | 2.77 | 2.50 | 2.33 | n.a |
| Current Debt/Total Assets | 2% | 2% | 2% | n.a |
| Acid Test | 10.44 | 7.86 | 10.57 | n.a |
| Sales/Net Worth | 1.93 | 3.53 | 3.66 | n.a |
| Dividend Payout | 1.95 | 0.74 | 1.00 | n.a |
Appendix
| Sales Forecast | |||||||||||||
| Month 1 | Month 2 | Month 3 | Month 4 | Month 5 | Month 6 | Month 7 | Month 8 | Month 9 | Month 10 | Month 11 | Month 12 | ||
| Sales | |||||||||||||
| Laser Car Wash Sales | 0% | $11,596 | $11,596 | $19,961 | $19,961 | $19,961 | $19,961 | $19,961 | $19,961 | $19,961 | $19,961 | $19,961 | $19,961 |
| Self-Serve Revenue | 0% | $3,000 | $3,000 | $6,000 | $6,000 | $6,000 | $6,000 | $6,000 | $6,000 | $6,000 | $6,000 | $6,000 | $6,000 |
| Vacuum / Vending Sales | 0% | $730 | $730 | $1,298 | $1,298 | $1,298 | $1,298 | $1,298 | $1,298 | $1,298 | $1,298 | $1,298 | $1,298 |
| ATM Revenue | 0% | $50 | $50 | $100 | $100 | $100 | $100 | $100 | $100 | $100 | $100 | $96 | $100 |
| RO Water Sales | 0% | $500 | $500 | $750 | $750 | $750 | $750 | $750 | $750 | $750 | $750 | $750 | $750 |
| Total Sales | $15,876 | $15,876 | $28,109 | $28,109 | $28,109 | $28,109 | $28,109 | $28,109 | $28,109 | $28,109 | $28,105 | $28,109 | |
| Direct Cost of Sales | Month 1 | Month 2 | Month 3 | Month 4 | Month 5 | Month 6 | Month 7 | Month 8 | Month 9 | Month 10 | Month 11 | Month 12 | |
| Laser Car Wash Sales | $2,609 | $2,609 | $4,491 | $4,491 | $4,491 | $4,491 | $4,491 | $4,491 | $4,491 | $4,491 | $4,491 | $4,491 | |
| Self-Serve Revenue | $333 | $333 | $667 | $667 | $667 | $667 | $667 | $667 | $667 | $667 | $667 | $667 | |
| Vacuum / Vending Sales | $146 | $146 | $260 | $260 | $260 | $206 | $260 | $260 | $260 | $260 | $260 | $260 | |
| ATM Revenue | $0 | $0 | $0 | $0 | $0 | $0 | $0 | $0 | $0 | $0 | $0 | $0 | |
| RO Water Sales | $0 | $0 | $0 | $0 | $0 | $0 | $0 | $0 | $0 | $0 | $0 | $0 | |
| Subtotal Direct Cost of Sales | $3,088 | $3,088 | $5,417 | $5,417 | $5,417 | $5,364 | $5,417 | $5,417 | $5,417 | $5,417 | $5,417 | $5,417 | |
| Personnel Plan | |||||||||||||
| Month 1 | Month 2 | Month 3 | Month 4 | Month 5 | Month 6 | Month 7 | Month 8 | Month 9 | Month 10 | Month 11 | Month 12 | ||
| 2 Attendants, 1st site | 0% | $2,000 | $2,000 | $2,000 | $2,000 | $2,000 | $2,000 | $2,000 | $2,000 | $2,000 | $2,000 | $2,000 | $2,000 |
| Manager, 1st site (Owner) | 0% | $0 | $0 | $0 | $0 | $0 | $0 | $3,000 | $3,000 | $3,000 | $3,000 | $3,000 | $3,000 |
| 2 Attentants, 2nd site | 0% | $0 | $0 | $0 | $0 | $0 | $0 | $0 | $0 | $0 | $0 | $0 | $0 |
| Manager, 2nd site (Owner) | 0% | $0 | $0 | $0 | $0 | $0 | $0 | $0 | $0 | $0 | $0 | $0 | $0 |
| Total People | 3 | 3 | 3 | 3 | 3 | 3 | 3 | 3 | 3 | 3 | 3 | 3 | |
| Total Payroll | $2,000 | $2,000 | $2,000 | $2,000 | $2,000 | $2,000 | $5,000 | $5,000 | $5,000 | $5,000 | $5,000 | $5,000 | |
| General Assumptions | |||||||||||||
| Month 1 | Month 2 | Month 3 | Month 4 | Month 5 | Month 6 | Month 7 | Month 8 | Month 9 | Month 10 | Month 11 | Month 12 | ||
| Plan Month | 1 | 2 | 3 | 4 | 5 | 6 | 7 | 8 | 9 | 10 | 11 | 12 | |
| Current Interest Rate | 7.50% | 7.50% | 7.50% | 7.50% | 7.50% | 7.50% | 7.50% | 7.50% | 7.50% | 7.50% | 7.50% | 7.50% | |
| Long-term Interest Rate | 8.00% | 8.00% | 8.00% | 8.00% | 8.00% | 8.00% | 8.00% | 8.00% | 8.00% | 8.00% | 8.00% | 8.00% | |
| Tax Rate | 30.00% | 20.00% | 20.00% | 20.00% | 20.00% | 20.00% | 20.00% | 20.00% | 20.00% | 20.00% | 20.00% | 20.00% | |
| Other | 0 | 0 | 0 | 0 | 0 | 0 | 0 | 0 | 0 | 0 | 0 | 0 | |
| Pro Forma Profit and Loss | |||||||||||||
| Month 1 | Month 2 | Month 3 | Month 4 | Month 5 | Month 6 | Month 7 | Month 8 | Month 9 | Month 10 | Month 11 | Month 12 | ||
| Sales | $15,876 | $15,876 | $28,109 | $28,109 | $28,109 | $28,109 | $28,109 | $28,109 | $28,109 | $28,109 | $28,105 | $28,109 | |
| Direct Cost of Sales | $3,088 | $3,088 | $5,417 | $5,417 | $5,417 | $5,364 | $5,417 | $5,417 | $5,417 | $5,417 | $5,417 | $5,417 | |
| Other Production Expenses | $0 | $0 | $0 | $0 | $0 | $0 | $0 | $0 | $0 | $0 | $0 | $0 | |
| Total Cost of Sales | $3,088 | $3,088 | $5,417 | $5,417 | $5,417 | $5,364 | $5,417 | $5,417 | $5,417 | $5,417 | $5,417 | $5,417 | |
| Gross Margin | $12,787 | $12,787 | $22,692 | $22,692 | $22,692 | $22,745 | $22,692 | $22,692 | $22,692 | $22,692 | $22,688 | $22,692 | |
| Gross Margin % | 80.55% | 80.55% | 80.73% | 80.73% | 80.73% | 80.92% | 80.73% | 80.73% | 80.73% | 80.73% | 80.72% | 80.73% | |
| Expenses | |||||||||||||
| Payroll | $2,000 | $2,000 | $2,000 | $2,000 | $2,000 | $2,000 | $5,000 | $5,000 | $5,000 | $5,000 | $5,000 | $5,000 | |
| Sales and Marketing and Other Expenses | $1,450 | $1,450 | $1,450 | $1,450 | $1,450 | $1,450 | $1,450 | $1,450 | $1,450 | $1,450 | $1,450 | $1,450 | |
| Depreciation | $6,264 | $6,264 | $6,264 | $6,264 | $6,264 | $6,264 | $6,264 | $6,264 | $6,264 | $6,264 | $6,264 | $6,264 | |
| Accounting / Legal | $100 | $100 | $100 | $100 | $100 | $100 | $100 | $100 | $100 | $100 | $100 | $100 | |
| Dumpster / Telephone / Pager | $125 | $125 | $125 | $125 | $125 | $125 | $125 | $125 | $125 | $125 | $125 | $125 | |
| Insurance | $150 | $150 | $150 | $150 | $150 | $150 | $150 | $150 | $150 | $150 | $150 | $150 | |
| Repairs / Maintenance | $850 | $850 | $850 | $850 | $850 | $850 | $850 | $850 | $850 | $850 | $850 | $850 | |
| Payroll Taxes | 15% | $300 | $300 | $300 | $300 | $300 | $300 | $750 | $750 | $750 | $750 | $750 | $750 |
| Other | $0 | $0 | $0 | $0 | $0 | $0 | $0 | $0 | $0 | $0 | $0 | $0 | |
| Total Operating Expenses | $11,239 | $11,239 | $11,239 | $11,239 | $11,239 | $11,239 | $14,689 | $14,689 | $14,689 | $14,689 | $14,689 | $14,689 | |
| Profit Before Interest and Taxes | $1,548 | $1,548 | $11,453 | $11,453 | $11,453 | $11,506 | $8,003 | $8,003 | $8,003 | $8,003 | $7,999 | $8,003 | |
| EBITDA | $7,812 | $7,812 | $17,717 | $17,717 | $17,717 | $17,770 | $14,267 | $14,267 | $14,267 | $14,267 | $14,263 | $14,267 | |
| Interest Expense | $4,662 | $4,656 | $4,651 | $4,646 | $4,641 | $4,636 | $4,631 | $4,626 | $4,621 | $4,616 | $4,611 | $4,606 | |
| Taxes Incurred | ($934) | ($622) | $1,360 | $1,361 | $1,362 | $1,374 | $674 | $675 | $676 | $677 | $678 | $679 | |
| Net Profit | ($2,179) | ($2,486) | $5,441 | $5,445 | $5,449 | $5,496 | $2,697 | $2,701 | $2,705 | $2,710 | $2,710 | $2,718 | |
| Net Profit/Sales | -13.73% | -15.66% | 19.36% | 19.37% | 19.39% | 19.55% | 9.60% | 9.61% | 9.62% | 9.64% | 9.64% | 9.67% | |
Brought to you by
Create a professional business plan
Using AI and step-by-step instructions
Create Your PlanSecure funding
Validate ideas
Build a strategy
| Pro Forma Cash Flow | |||||||||||||
| Month 1 | Month 2 | Month 3 | Month 4 | Month 5 | Month 6 | Month 7 | Month 8 | Month 9 | Month 10 | Month 11 | Month 12 | ||
| Cash Received | |||||||||||||
| Cash from Operations | |||||||||||||
| Cash Sales | $15,876 | $15,876 | $28,109 | $28,109 | $28,109 | $28,109 | $28,109 | $28,109 | $28,109 | $28,109 | $28,105 | $28,109 | |
| Subtotal Cash from Operations | $15,876 | $15,876 | $28,109 | $28,109 | $28,109 | $28,109 | $28,109 | $28,109 | $28,109 | $28,109 | $28,105 | $28,109 | |
| Additional Cash Received | |||||||||||||
| Sales Tax, VAT, HST/GST Received | 0.00% | $0 | $0 | $0 | $0 | $0 | $0 | $0 | $0 | $0 | $0 | $0 | $0 |
| New Current Borrowing | $0 | $0 | $0 | $0 | $0 | $0 | $0 | $0 | $0 | $0 | $0 | $0 | |
| New Other Liabilities (interest-free) | $0 | $0 | $0 | $0 | $0 | $0 | $0 | $0 | $0 | $0 | $0 | $0 | |
| New Long-term Liabilities | $0 | $0 | $0 | $0 | $0 | $0 | $0 | $0 | $0 | $0 | $0 | $0 | |
| Sales of Other Current Assets | $0 | $0 | $0 | $0 | $0 | $0 | $0 | $0 | $0 | $0 | $0 | $0 | |
| Sales of Long-term Assets | $0 | $0 | $0 | $0 | $0 | $0 | $0 | $0 | $0 | $0 | $0 | $0 | |
| New Investment Received | $0 | $0 | $0 | $0 | $0 | $0 | $0 | $0 | $0 | $0 | $0 | $0 | |
| Subtotal Cash Received | $15,876 | $15,876 | $28,109 | $28,109 | $28,109 | $28,109 | $28,109 | $28,109 | $28,109 | $28,109 | $28,105 | $28,109 | |
| Expenditures | Month 1 | Month 2 | Month 3 | Month 4 | Month 5 | Month 6 | Month 7 | Month 8 | Month 9 | Month 10 | Month 11 | Month 12 | |
| Expenditures from Operations | |||||||||||||
| Cash Spending | $2,000 | $2,000 | $2,000 | $2,000 | $2,000 | $2,000 | $5,000 | $5,000 | $5,000 | $5,000 | $5,000 | $5,000 | |
| Bill Payments | $326 | $9,801 | $10,242 | $14,404 | $14,400 | $14,394 | $14,342 | $14,148 | $14,144 | $14,139 | $14,135 | $14,131 | |
| Subtotal Spent on Operations | $2,326 | $11,801 | $12,242 | $16,404 | $16,400 | $16,394 | $19,342 | $19,148 | $19,144 | $19,139 | $19,135 | $19,131 | |
| Additional Cash Spent | |||||||||||||
| Sales Tax, VAT, HST/GST Paid Out | $0 | $0 | $0 | $0 | $0 | $0 | $0 | $0 | $0 | $0 | $0 | $0 | |
| Principal Repayment of Current Borrowing | $0 | $0 | $0 | $0 | $0 | $0 | $0 | $0 | $0 | $0 | $0 | $0 | |
| Other Liabilities Principal Repayment | $0 | $0 | $0 | $0 | $0 | $0 | $0 | $0 | $0 | $0 | $0 | $0 | |
| Long-term Liabilities Principal Repayment | $764 | $764 | $764 | $764 | $764 | $764 | $764 | $764 | $764 | $764 | $764 | $764 | |
| Purchase Other Current Assets | $0 | $0 | $0 | $0 | $0 | $0 | $0 | $0 | $0 | $0 | $0 | $0 | |
| Purchase Long-term Assets | $0 | $0 | $0 | $0 | $0 | $0 | $0 | $0 | $0 | $0 | $0 | $0 | |
| Dividends | $0 | $0 | $0 | $0 | $0 | $0 | $0 | $0 | $0 | $0 | $0 | $65,000 | |
| Subtotal Cash Spent | $3,090 | $12,565 | $13,006 | $17,168 | $17,164 | $17,158 | $20,106 | $19,912 | $19,908 | $19,903 | $19,899 | $84,895 | |
| Net Cash Flow | $12,785 | $3,311 | $15,103 | $10,941 | $10,945 | $10,951 | $8,003 | $8,197 | $8,201 | $8,206 | $8,206 | ($56,786) | |
| Cash Balance | $107,285 | $110,596 | $125,699 | $136,640 | $147,586 | $158,536 | $166,539 | $174,737 | $182,938 | $191,144 | $199,349 | $142,564 | |
| Pro Forma Balance Sheet | |||||||||||||
| Month 1 | Month 2 | Month 3 | Month 4 | Month 5 | Month 6 | Month 7 | Month 8 | Month 9 | Month 10 | Month 11 | Month 12 | ||
| Assets | Starting Balances | ||||||||||||
| Current Assets | |||||||||||||
| Cash | $94,500 | $107,285 | $110,596 | $125,699 | $136,640 | $147,586 | $158,536 | $166,539 | $174,737 | $182,938 | $191,144 | $199,349 | $142,564 |
| Other Current Assets | $0 | $0 | $0 | $0 | $0 | $0 | $0 | $0 | $0 | $0 | $0 | $0 | $0 |
| Total Current Assets | $94,500 | $107,285 | $110,596 | $125,699 | $136,640 | $147,586 | $158,536 | $166,539 | $174,737 | $182,938 | $191,144 | $199,349 | $142,564 |
| Long-term Assets | |||||||||||||
| Long-term Assets | $799,000 | $799,000 | $799,000 | $799,000 | $799,000 | $799,000 | $799,000 | $799,000 | $799,000 | $799,000 | $799,000 | $799,000 | $799,000 |
| Accumulated Depreciation | $0 | $6,264 | $12,528 | $18,792 | $25,056 | $31,320 | $37,584 | $43,848 | $50,112 | $56,376 | $62,640 | $68,904 | $75,168 |
| Total Long-term Assets | $799,000 | $792,736 | $786,472 | $780,208 | $773,944 | $767,680 | $761,416 | $755,152 | $748,888 | $742,624 | $736,360 | $730,096 | $723,832 |
| Total Assets | $893,500 | $900,021 | $897,068 | $905,907 | $910,584 | $915,266 | $919,952 | $921,691 | $923,625 | $925,562 | $927,504 | $929,445 | $866,396 |
| Liabilities and Capital | Month 1 | Month 2 | Month 3 | Month 4 | Month 5 | Month 6 | Month 7 | Month 8 | Month 9 | Month 10 | Month 11 | Month 12 | |
| Current Liabilities | |||||||||||||
| Accounts Payable | $0 | $9,465 | $9,762 | $13,924 | $13,920 | $13,916 | $13,871 | $13,676 | $13,672 | $13,668 | $13,664 | $13,660 | $13,656 |
| Current Borrowing | $0 | $0 | $0 | $0 | $0 | $0 | $0 | $0 | $0 | $0 | $0 | $0 | $0 |
| Other Current Liabilities | $0 | $0 | $0 | $0 | $0 | $0 | $0 | $0 | $0 | $0 | $0 | $0 | $0 |
| Subtotal Current Liabilities | $0 | $9,465 | $9,762 | $13,924 | $13,920 | $13,916 | $13,871 | $13,676 | $13,672 | $13,668 | $13,664 | $13,660 | $13,656 |
| Long-term Liabilities | $700,000 | $699,236 | $698,472 | $697,708 | $696,944 | $696,180 | $695,416 | $694,652 | $693,888 | $693,124 | $692,360 | $691,596 | $690,832 |
| Total Liabilities | $700,000 | $708,701 | $708,234 | $711,632 | $710,864 | $710,096 | $709,287 | $708,328 | $707,560 | $706,792 | $706,024 | $705,256 | $704,488 |
| Paid-in Capital | $234,000 | $234,000 | $234,000 | $234,000 | $234,000 | $234,000 | $234,000 | $234,000 | $234,000 | $234,000 | $234,000 | $234,000 | $234,000 |
| Retained Earnings | ($40,500) | ($40,500) | ($40,500) | ($40,500) | ($40,500) | ($40,500) | ($40,500) | ($40,500) | ($40,500) | ($40,500) | ($40,500) | ($40,500) | ($105,500) |
| Earnings | $0 | ($2,179) | ($4,666) | $775 | $6,220 | $11,670 | $17,166 | $19,863 | $22,564 | $25,270 | $27,979 | $30,690 | $33,407 |
| Total Capital | $193,500 | $191,321 | $188,834 | $194,275 | $199,720 | $205,170 | $210,666 | $213,363 | $216,064 | $218,770 | $221,479 | $224,190 | $161,907 |
| Total Liabilities and Capital | $893,500 | $900,021 | $897,068 | $905,907 | $910,584 | $915,266 | $919,952 | $921,691 | $923,625 | $925,562 | $927,504 | $929,445 | $866,396 |
| Net Worth | $193,500 | $191,321 | $188,834 | $194,275 | $199,720 | $205,170 | $210,666 | $213,363 | $216,064 | $218,770 | $221,479 | $224,190 | $161,907 |


