
The Wonderkind
Executive Summary
Our Mission: Our mission is to tap into the brightest young minds of today and tomorrow by empowering them to research the trends, themes, and technological advances that are prevalent among college students and decipher how these phenomena translate into the investing dynamics of the stock market.
Description of the Business Concept: We will offer bright, motivated college students who are passionate about business and investing a forum to gain real business experience by empowering them to analyze trends, themes, and companies and write about them outside of the classroom. The original thoughts and ideas of these business-minded wunderkinds will be available on the Internet at our website: www.thewonderkind.com and in a hard copy newsletter printed quarterly and mailed to subscribers. We are an informational publishing company which provides analysis citing key trends in various industries to our subscribers. The Wonderkind’s focus allows students to discuss business matters most relevant to them and their Wall Street analyst counterparts-–current market and product trends, social issues, and general stock market dynamics-–and decipher how these phenomena translate into current investment opportunities. Our analysts are independent from the biases created due to the investment banking relationships between traditional Wall Street firms and their clients. Interested readers from across America will be able to access the collaborative findings of The Wonderkind by subscribing via the website for a monthly fee of $12.95 or $129.95 per year. This flat fee includes unlimited access to our online database, including email interaction with our analysts, as well as our quarterly newsletter, which provides the top articles and analyses in a printed form.
Opportunity and Strategy: The founding partners will rely upon their own investment wisdom and perspicacity as well as that of their network of peers from other schools from across the country to create the initial knowledge base. This foundational base will be used as a marketing tool to encourage motivated students from any university to submit their own original investment ideas to be considered for publication on the website and newsletter of The Wonderkind. We believe that motivated students will flock to this opportunity to gain exposure and honor through publication on the website as well as in the quality periodical without the need for other monetary compensation. Judging from the quality of investment analyses submitted we would look to recruit additional full-time writers and compensate them accordingly. As our subscriber base continues to grow, so will the number and quality of articles submitted by students.
The Wonderkind has a range of possible recruitment and implementation methods including the Internet; promotion via official college and university newsletters and magazines; with business and entrepreneurial departments at other schools; and lastly, through friend and family networking and support.
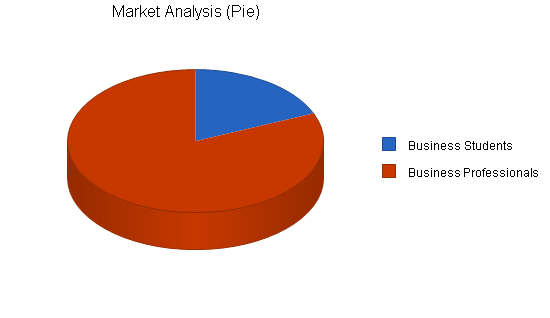
Target Market: Subscribers of The Wonderkind will be motivated to gain exposure to the pulse of collegiate America. The Wonderkind’s target market consists of:
- Business professionals who enjoy a multitude of information sources.
- College students with business, finance, or marketing interests.
Competitive Advantage: Our competitive advantage is two fold:
- There is currently no other investment publication that taps into the collective collegiate intellect.
- We will appeal to motivated college students who are frustrated with the lack of response and organization of internship programs at large corporations.
- Our internship would be offered during the school year as well as during the summer.
- Because our internship would be performed electronically, students will not need to relocate nor arrange for lodging.
The Wonderkind’s uniqueness stems from its planned creation of an elite team of college students who embody America’s most technologically savvy and dynamic generation of youth. College students of today command more respect from business professionals and society at large than ever before. With the incredible success stories of college entrepreneurs such as Bill Gates, Michael Dell, and Sean Fanning, everyone seems to have an interest in the pulse of the collegiate America.
Economic Potential: Our five year projected models indicate over one million dollars in annual revenue. Additional value-added services and cross marketing initiatives could become accretive to our bottom line beginning two years out.
Management: Both founding partners, Frank Peanut and Jacob Sweller have unique resumes and background experiences. They each bring to the table distinct personal qualities that will complement one another as they manage and grow their business.
Frank Peanut is majoring in finance and is ranked in the top 5% of his class. His past experience includes being mentored under the guidance of two hedge fund managers in Minneapolis. Frank currently serves as the Co-fund Manager of the Investment Club at school responsible for approximately $400,000 in assets. Frank has been managing his own personal funds in the equity markets since the age of 14. His future plans after graduation entail working in the Investment Banking industry for a short duration and then attending graduate school.
Jacob Sweller is on track to receive a dual degree in finance and government. Jacob, enrolled in the Honors Program, scored a 1500 on the SAT exam and is currently ranked in the top 10% of his class. While at school, Jacob has been extremely active in the business arena and has directed business-consulting presentations to the Credit Suisse First Boston investment banking firm as well as McKinsey & Co. consulting firm. Jacob has received over 30 prestigious awards in academics and athletics over the past few years. Jacob currently serves as the Co-fund Manager of the Investment Club responsible for approximately $400,000 in assets.
The Offering: We propose to offer a large minority stake in The Wonderkind in exchange for our desired financing to cover start-up costs associated with promotion of our services, and business infrastructure. We are open for negotiations.
Risks: While any start-up company investment necessitates a high degree of risk, we are committed to using any funds received conservatively and wisely. However, The Wonderkind is not an Internet company. We are an informational publishing company which provides services citing key trends in various industries to our customers. We have decided to utilize the Internet for distribution purposes because it is the most cost efficient method.
1.1 100 Word Summary of Business Venture
The Wonderkind is an informational publishing company whose focus allows exceptionally bright students with business/investing interests to discuss business matters most relevant to them and their Wall Street analyst counterparts–current market and product trends, social issues, and general stock market dynamics-–and decipher how these phenomena translate into current investment opportunities. Our analysts are independent from the biases created due to the investment banking relationships between traditional Wall Street firms and their clients.
Team leaders and contact personnel:
Frank Peanut: peanut@wonderkind.com. Office: (555) 589-3432
Jacob Sweller: sweller@wonderkind.com. Office: (555) 589-3453
1.2 Objectives
We will offer bright, motivated students who are passionate about the stock market a forum to gain real business experience by allowing them to analyze companies and write about them outside of the classroom.
Our objectives for growth in our subscriber base are as follows:
|
Year: |
1 |
2 |
3 |
4 |
5 |
| Service Subscribers: |
500 |
1,500 |
4,500 |
6,000 |
7,500 |
1.3 Mission
Our mission is to tap into the brightest young minds of today and tomorrow by empowering them to research the trends, themes, and technological advances that are prevalent among college students and decipher how these phenomena translate into the investing dynamics of the stock market.
Brought to you by
Create a professional business plan
Using AI and step-by-step instructions
Create Your PlanSecure funding
Validate ideas
Build a strategy
1.4 Keys to Success
The following is a list of crucial steps in which we will take:
- Recruit qualified college students from around the country and properly integrate their research into our services.
- Ensure that the content we publish is truly original and unique in all aspects.
- Convince investors and interested readers of the quality and differentiated content of our service.
- Market our concept to institutional interests at the collegiate level and in business to ensure that more than just individual subscribers endorse it.
- Retain existing subscribers and persuade them to recommend our service to others.
- Keep our costs minimized to ensure self-sufficiency and longevity in all operations.
Company Summary
The Wonderkind is an informational publishing company comprised of the best and brightest college students with business/investing interests. The Wonderkind’s focus allows students to discuss business matters most relevant to them and their Wall Street analyst counterparts-–current market and product trends, social issues, and general stock market dynamics-–and decipher how these phenomena translate into current investment opportunities. Our analysts are independent from the biases created due to the investment banking relationships between traditional Wall Street firms and their clients. Student analysts will offer a unique perspective in the following areas:
- Company analysis and recommendation.
- Business and investment issues from the perspective of generation Y.
- Current market and product trends/themes prevalent on the college campus.
- What’s happening now in collegiate America and business today?
An online edition and hard-copy newsletter will be available to subscribers for $12.95 per month or $129.95 per year.
2.1 Company Ownership
The Wonderkind will be a privately owned, operated, and funded partnership.
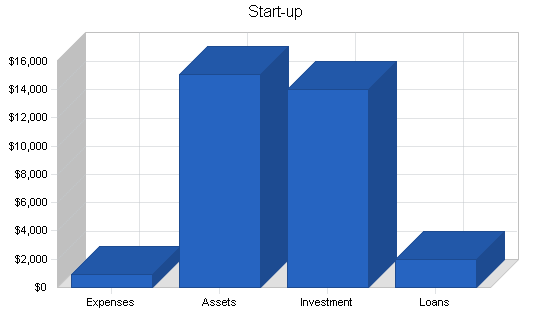
2.2 Start-up Summary
At this time, we anticipate minimal start-up related costs associated with our company. We plan on devoting a substantial amount of our personal time and utilizing already existent resources available to us at little or no cost. Our website is hosted and maintained by Vista.com for a monthly charge of $50. However, through a special partnership with Vista we will receive Web hosting and developing capabilities free of charge for the first year. Marketing and business infrastructure expenses will be the primary source of cash outflow during the beginning stages of growth.
| Start-up | |
| Requirements | |
| Start-up Expenses | |
| Legal | $200 |
| Stationery etc. | $50 |
| Brochures | $150 |
| Consultants | $0 |
| Insurance | $0 |
| Rent | $0 |
| Research and development | $0 |
| Expensed equipment | $0 |
| Other | $500 |
| Total Start-up Expenses | $900 |
| Start-up Assets | |
| Cash Required | $15,100 |
| Other Current Assets | $0 |
| Long-term Assets | $0 |
| Total Assets | $15,100 |
| Total Requirements | $16,000 |
| Start-up Funding | |
| Start-up Expenses to Fund | $900 |
| Start-up Assets to Fund | $15,100 |
| Total Funding Required | $16,000 |
| Assets | |
| Non-cash Assets from Start-up | $0 |
| Cash Requirements from Start-up | $15,100 |
| Additional Cash Raised | $0 |
| Cash Balance on Starting Date | $15,100 |
| Total Assets | $15,100 |
| Liabilities and Capital | |
| Liabilities | |
| Current Borrowing | $0 |
| Long-term Liabilities | $2,000 |
| Accounts Payable (Outstanding Bills) | $0 |
| Other Current Liabilities (interest-free) | $0 |
| Total Liabilities | $2,000 |
| Capital | |
| Planned Investment | |
| Frank Peanut | $6,000 |
| Jacob Sweller | $8,000 |
| Other | $0 |
| Additional Investment Requirement | $0 |
| Total Planned Investment | $14,000 |
| Loss at Start-up (Start-up Expenses) | ($900) |
| Total Capital | $13,100 |
| Total Capital and Liabilities | $15,100 |
| Total Funding | $16,000 |
2.3 Company Locations and Facilities
The primary operations of The Wonderkind will take place in New York, NY. Because all activities and information can be tracked and maintained using a personal computer and the Internet, we will not need exclusive office space until our operations have reached a scale in which dedicated office space is necessary.
Services
The Wonderkind will publish a website and newsletter that provides product, market trends, and theme analysis, company insight, and interesting business issues impacting society from the collegiate perspective. The angle that we address business and societal issues from is unique in that it is representative of today’s and tomorrow’s top college students opinions. The interests of today’s college generation indicates broader themes that will eventually transform society as a whole. The Wonderkind offers bright, motivated students who are passionate about business and/or the stock market a forum to gain real business experience by allowing them to analyze companies and trends and write about them outside of the classroom. The original thoughts and ideas of these wunderkinds will be available on the Internet at our website: www.thewonderkind.com and in a hard copy newsletter printed quarterly.
3.1 Competitive Comparison
The Wonderkind is a collection of the best young financial minds in the U.S. These people see trends and issues in the market that the Wall Street analysts fail to realize. In addition, our analysts do not have the investment banking ties that create a major bias in the Wall Street analysts’ opinion. Certain trends cannot be read in yearly reports and can only be realized at the earliest moments by those with a feel for the future of trends in business and technology. In addition, our analysts are willing to perform the more hands-on research carried out by the Wall Street analyst of thirty years ago. This kind of research could include actually eating at a restaurant with the intent of judging the quality of food service. Or perhaps visiting the local mall and witnessing the consumer traffic at Abercrombie & Fitch vs. The Gap vs. J. Crew. If a hot new MP3 player is creping into the popular music scene, then college students with an astute wit will detect the trend first. Our team of college students will be the Wall Street analysts and business professionals of the future. The Wonderkind provides a forum for these brilliant students to voice their observations and ideas before they become biased by their investment banking counterparts.
The Wonderkind’s uniqueness stems from its creation of an elite team of college students who embody America’s most technologically savvy and dynamic generation of youth. College students of today command more respect from business professionals and society at large than ever before. With the incredible success stories of college entrepreneurs such as Bill Gates, Michael Dell, and Sean Fanning, everyone seems to have an interest in the pulse of the collegiate America.
Our competitive advantage is two fold:
- There is currently no other business/investment publication that taps into the collective collegiate intellect.
- We will appeal to motivated college students who are frustrated with the lack of response and organization of internship programs at large corporations.
- Our internship would be offered during the school year as well as during the summer.
- Because our internship would be performed electronically, students will not need to relocate nor arrange for lodging.
The Internet has revolutionized the way people are able to trade equities and gather information. The growth in acceptance of this new medium of trading is largely a result of the much reduced commission charges. There is an abundance of online financial websites in existence today that attempt to service this new market of online investors. We do not see these entities as potential threats to our services. We believe that each of these services are not mutually exclusive and that our service will actually benefit by co-existing with other services. The responsibility and necessity of performing research is paramount for investors to make decisions. While nearly anyone can benefit from substantially reduced commission charges, not everyone has the time or the energy to learn the market tactics of Wall Street professionals. Analysts at The Wonderkind are devoted to studying not only the stock market, but witnessing the trends and themes that appear to them first, and materializing accurate and quality analytical information that cannot be obtained from other sources.
Brought to you by
Create a professional business plan
Using AI and step-by-step instructions
Create Your PlanSecure funding
Validate ideas
Build a strategy
3.2 Sales Literature
Nearly all needed sales literature will be produced in-house using personal computer desktop publishing software such as Microsoft Publisher. We will outsource all of our printing needs. Sales literature will consist of brochures that can be passed out in person or mailed to our initial list of prospective clients. In addition we will publish performance reports including graphs and charts from our analysts using software such as Microsoft Excel.
3.3 Future Services
After creating the initial knowledge base for our business and we have a growing base of subscribers to our service, we will explore opportunities to further personalize the relationships between our subscribers and our analysts/writers. Our analysts will become available via email communication to subscribers who wish to further discuss the ideas presented by the writer. We will also explore the possibilities of adding additional channels of more consistent communication between subscribers and writers. One possibility for a future channel would be aimed at the corporate recruitment division of firms seeking top collegiate talent. The Wonderkind could become a means to establish an early link between corporations and students.
3.4 Technology
The Wonderkind will be heavily reliant upon the use of the Internet as a means for publishing its website and communicating with clients through email. We feel that technology will be utilized strictly to our advantage and we currently do not see any competitive threats resulting from the advent of new technologies. This mentality is subject to change and will be reevaluated continually in the future.
3.5 Fulfillment
The core value of The Wonderkind will lie in our analysts’ role as the brightest and most motivated college students in the country. The Wonderkind is different from other informational publishing services in that it represents collegiate America. Furthermore, value of this company will lie in the experience, education, dedication, and willingness of the analysts and owners to go out on a limb to observe the most pressing trends and tech themes prevalent today. Sound, unbiased analysis of these market trends, themes, and investment ideas, will be our objective.
Market Analysis Summary
Subscribers of The Wonderkind will be motivated to gain exposure to the pulse of collegiate America. The Wonderkind’s target market consists of business professionals who enjoy a multitude of information sources.
4.1 Market Segmentation
We will target business professionals who enjoy a range information sources. These people could include buy/sell-side Wall Street analysts or other marketing managers at companies with an interest in consumer trends. The perspective offered by college students is truly separate from the bombardment of traditional business periodical sources. The interests of today’s college generation indicates broader themes business professionals need to be aware of.
| Market Analysis | |||||||
| Year 1 | Year 2 | Year 3 | Year 4 | Year 5 | |||
| Potential Customers | Growth | CAGR | |||||
| Business Students | 8% | 800,000 | 860,000 | 924,500 | 993,838 | 1,068,376 | 7.50% |
| Business Professionals | 5% | 3,500,000 | 3,675,000 | 3,858,750 | 4,051,688 | 4,254,272 | 5.00% |
| Total | 5.48% | 4,300,000 | 4,535,000 | 4,783,250 | 5,045,526 | 5,322,648 | 5.48% |
4.2 Market Trends
The most relevant trend to the success of The Wonderkind is the continuing recognition of college business persons. No longer are the top Wall Street analysts and managers the only voices being heard. After the astounding success stories of college students such as Bill Gates, Michael Dell, and Sean Fanning, everyone seems to have an open ear to the collective collegiate conscious.
Another important trend originating in the last few years results from the “Fair Disclosure Act” which was created by the S.E.C. This act states explicitly that companies must disclose all information to the general investing public at the same time as releasing information to Wall Street analysts. In other words, individual investors can be present in the same conference calls with management along with Wall Street analysts effectively leveling the playing field for individual investors.
Another critical market influence on the investing public deals with the separation of the Wall Street research analysts from their investment banking counterparts. The inherent biases of investment banking research is being realized by the investing public. Investors want unbiased fundamental research to make decisions.
4.3 Market Growth
J. P. Morgan estimates that that 18 million Americans used online brokerages in 2000. This number is expected to increase to 27 million users with online accounts by the year 2003. J. P. Morgan also projects European online accounts to increase from 3.9 million in 2000 to an estimated 17 million accounts by 2003, an anticipated average annualized growth of over 60%. We mention the European statistics here because we expect some foreign investors to utilize The Wonderkind’s service as a concise, interactive, and cost-efficient method of gaining insight into the American markets. This trend indicates that more people are investing without the aid of a traditional broker. Such people, whether they be college students or business professionals, need supplementary research and information to make their investment decisions.
4.4 Service Business Analysis
The online investment research industry consists of a handful of all-inclusive websites that touch on nearly all realms of financial activity. Next, there are numerous lesser-known websites and newsletter services that take a more limited approach, specializing in various aspects of the financial markets.
The Wonderkind’s biggest challenge will be to establish itself as a quality niche service in an arena already filled with a wealth of information.
4.4.1 Business Participants
To our knowledge, there is no other company that offers the same services as The Wonderkind. However, there are several virtual businesses that charge fixed monthly rates for their analysts’ suggested portfolios along with periodic email newsletters. These companies will certainly be competition. However, we believe that The Wonderkind offers many competitive advantages over these more automated market information services. The uniquely powerful collection of extremely smart college students that we plan to create will separate us from these other standardized information services.
4.4.2 Distributing a Service
The Wonderkind will be distributed via Internet subscriptions and mailed newsletters, which will be promoted via our marketing campaigns. The highly scalable knowledge-based platform on which we will operate, will allow us to efficiently leverage our business to a large audience. In addition, we will be able to communicate with our clients via our website, email, and telephone.
4.4.3 Main Competitors
The Wonderkind is removed from these otherwise comparable sites because of our collection of the best and brightest young minds representative of the American collegiate pulse:
1. All-inclusive online financial services:
Already established financial sites such as Yahoo! Finance, CBS MarketWatch, MSN MoneyCentral, The Street.com, and Fool.com certainly could be grouped in the same industry as The Wonderkind. We also group any information provided by discount brokers into this category as well. These services provide market research, daily articles, charts, quotes, and much more. We certainly recognize the breadth and reputation of these sites. However, our object will not be to take away market share from this group. Instead we will strive to serve as a desired supplementary informational service.
2. Reputable and focused companies:
Some of these sites include Bloomberg, Investorguide.com, and Hoover’s. Each of the aforementioned sites have a more limited arena of expertise. For example, Bloomberg Online focuses primarily on the status of the market and economy while Hoover’s provides superb company profiles for nearly all publicly traded companies.
Brought to you by
Create a professional business plan
Using AI and step-by-step instructions
Create Your PlanSecure funding
Validate ideas
Build a strategy
3. Stock Picking Services/Technological Forecasting
Persons such as George Gilder and Michael Murphy have set up subscription-based revenue models similar to what we will strive to achieve for The Wonderkind.
Strategy and Implementation Summary
We plan to collect an extensive network of bright and talented college students as writers and analysts. We will gather student representatives from schools across the nation. The position of writer and analyst for The Wonderkind will become more coveted than an internship because of the manner in which our newsletter will provide students with a voice to be heard. Lastly, the college community has a perspective and insight that the overall investing world needs to hear.
5.1 Value Proposition
Subscribers have access to the stock ideas and societal trend/theme analysis generated by our analysts. In addition, subscribers will have access to a more personalized form of communication with our advisors regarding their own investment ideas as well as further exploration into those ideas already put forth by our analysts.
While traditional stockbrokers and Wall Street Analysts are biased in their buy/sell recommendations due to their financial incentives being aligned with the quantity of trading and preconceived investment banking relationships rather than the soundness of individual investment decisions, The Wonderkind analysts remain independent and unbiased in their advice. The Wonderkind analysts have no incentives other than to offer practical stock picking and trend/theme analysis based upon independent and thorough research.
5.2 Competitive Edge
The Wonderkind is a collection of the best young financial minds in the U.S. These people see trends and issues in the market that the Wall Street analysts fail to realize. In addition, our analysts do not have the investment banking ties that create a major bias in the Wall Street analysts’ opinion. Certain trends cannot be read in yearly reports and can only be realized at the earliest moments by those with a feel for the future of trends in business and technology. Furthermore, our analysts are willing to perform the more hands-on research carried out by the Wall Street analyst of thirty years ago. This kind of research could include actually eating at a restaurant with the intent of judging the quality of food service, or perhaps visiting the local mall and witnessing the consumer traffic at Abercrombie & Fitch vs. The Gap vs. J. Crew. If a hot new MP3 player is creeping into the popular music scene, then college students with an astute wit will detect the trend first. Our team of college students will be the Wall Street analysts and business professionals of the future. The Wonderkind provides a forum for these brilliant students to voice their observations and ideas before they become biased by their investment banking counterparts.
The Wonderkind’s uniqueness stems from its elite team of college students who embody America’s most technologically savvy and dynamic generation of youth. College students of today command more respect from business professionals and society at large than ever before.
5.3 Marketing Strategy
Our marketing strategy for The Wonderkind will focus on our differentiation by virtue of representation of college students and their opinions and advice. We seek out the brightest and most motivated students at colleges and universities around the country. The name ‘The Wonderkind’ is a play on the German and American word wunderkind, which describes a person of remarkable talent or ability who achieves great success or acclaim at an early age especially in business.
5.3.1 Promotion Strategy
Our most effective means of gaining exposure to a wide audience will come as a result of communicating with the business/entrepreneurial offices at the top 100 universities in the country. We will look to establish permanent links with these institutions in order to generate interest for student writers as well as publicity from university publications. Also, we will be mailing brochures and information to selective lists of potential subscribers and investors.
Our promotion strategy will be in-line with our main competitive advantage from a business perspective: our ability to contain costs. We will rely upon inexpensive forms of publicity that reach a large number of potential clients. Examples of such publicity will manifest in the form of articles written for student-business publications. One publication in which we have already contacted regarding our proposal is Business Today magazine. Business Today is the largest and most influential student-run publication in the country and is distributed widely to over 200,000 subscribers nationwide.
It is our assumption that one effective means of promoting our service will come by word-of-mouth from all people connected with our service including our analysts, writers, and customers. We expect that networks of friends and family will represent a portion of our initial cliental base and that word of mouth will continue to spread. We will be offering incentives for clients to sign up their friends and colleagues. This incentive will take the form of credit toward our existing services for referring clients. We will reward two free months of service for each new subscriber that is referred by an existing subscriber.
5.3.2 Positioning Statement
The Wonderkind will be positioned as an alternative form of investment advice designed to offer an enjoyable and energetic source of investment advice from an otherwise unrecognized group of people–college students. We provide investment advice from those who will be making the rules in the future. Ultimately, we fall into the category of an informational publishing service utilizing the Internet as well as traditional paper printing methods of distribution.
5.3.3 Pricing Strategy
While we believe that our services are premium in quality, we have decided to offer them for a flat monthly charge. We believe that we should enter the market with a pricing strategy that is focused on convincing possible clients to give us a try. If we were to initially charge a much higher amount, possibly more in-line with the quality of service our clients will be receiving, we may experience a more difficult time selling to new clients. Once we have established ourselves in the eyes of our clients, we will begin raising our prices accordingly.
We will initially charge a fee of $12.95/month or $129.95/year for our basic service which provides access to all articles and content on our website in addition to a quarterly newsletter mailed to the subscriber.
5.4 Sales Strategy
We imagine that our sales strategy will be a natural follow up from our marketing strategy. Once we have attracted users to our website, the natural progression will be to retain them as subscribers. The majority of this process will be carried out through the website itself. The website will describe the specific benefits of subscribing to our service as well as address any questions prospective subscribers may have. We will give prospective subscribers a sample of the services offered by The Wonderkind. Sample articles and abridged articles will be available free of charge by accessing our website at www.thewonderkind.com. We will make an extraordinary effort to accommodate new subscribers in the beginning and throughout the duration of his or her subscription. We will strive to familiarize our subscribers with our services both on the website and through the comprehensive quarterly newsletter.
5.4.1 Sales Forecast
Our objectives for growth in our subscriber base are as follows:
| Year: |
1 |
2 |
3 |
4 |
5 |
| Service Subscribers: |
500 |
1,500 |
4,500 |
6,000 |
7,500 |
Assuming our yearly subscription fee of $129.95, projected subscriber bases translate into yearly revenue projections of:
| Year: |
1 |
2 |
3 |
4 |
5 |
| Projected revenue in dollars: |
65,000 |
195,000 |
585,000 |
780,000 |
975,000 |
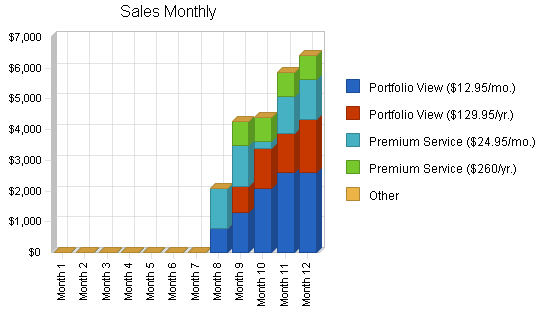
For fiscal accounting purposes, this plan begins in June even though we do not expect to receive income from subscriptions until January of the following year. In the seven months between these dates, we will be carrying out an aggressive marketing campaign to attract both subscribers and contributors.

| Sales Forecast | |||
| Year 1 | Year 2 | Year 3 | |
| Unit Sales | |||
| Portfolio View ($12.95/mo.) | 720 | 1,980 | 4,200 |
| Portfolio View ($129.95/yr.) | 480 | 1,620 | 4,200 |
| Premium Service ($24.95/mo.) | 216 | 720 | 1,680 |
| Premium Service ($260/yr.) | 144 | 720 | 2,520 |
| Other | 0 | 0 | 0 |
| Total Unit Sales | 1,560 | 5,040 | 12,600 |
| Unit Prices | Year 1 | Year 2 | Year 3 |
| Portfolio View ($12.95/mo.) | $12.95 | $12.95 | $12.95 |
| Portfolio View ($129.95/yr.) | $10.83 | $10.83 | $10.83 |
| Premium Service ($24.95/mo.) | $24.95 | $24.95 | $24.95 |
| Premium Service ($260/yr.) | $21.67 | $21.67 | $21.67 |
| Other | $0.00 | $0.00 | $0.00 |
| Sales | |||
| Portfolio View ($12.95/mo.) | $9,324 | $25,641 | $54,390 |
| Portfolio View ($129.95/yr.) | $5,198 | $17,545 | $45,486 |
| Premium Service ($24.95/mo.) | $5,389 | $17,964 | $41,916 |
| Premium Service ($260/yr.) | $3,120 | $15,602 | $54,608 |
| Other | $0 | $0 | $0 |
| Total Sales | $23,032 | $76,752 | $196,400 |
| Direct Unit Costs | Year 1 | Year 2 | Year 3 |
| Portfolio View ($12.95/mo.) | $1.00 | $1.00 | $1.00 |
| Portfolio View ($129.95/yr.) | $1.00 | $1.00 | $1.00 |
| Premium Service ($24.95/mo.) | $1.00 | $1.00 | $1.00 |
| Premium Service ($260/yr.) | $1.00 | $1.00 | $1.00 |
| Other | $0.00 | $0.00 | $0.00 |
| Direct Cost of Sales | |||
| Portfolio View ($12.95/mo.) | $720 | $1,980 | $4,200 |
| Portfolio View ($129.95/yr.) | $480 | $1,620 | $4,200 |
| Premium Service ($24.95/mo.) | $216 | $720 | $1,680 |
| Premium Service ($260/yr.) | $144 | $720 | $2,520 |
| Other | $0 | $0 | $0 |
| Subtotal Direct Cost of Sales | $1,560 | $5,040 | $12,600 |
5.5 Strategic Alliances
Once we have established The Wonderkind as a viable entity, we will begin to evaluate strategic alliances and co-marketing initiatives. One possibility for a future alliance exists in another student-operated investment service called WallStreetProdigy.com which offers recommended stock portfolio analysis via its website. WSP offers analysis and live quotes for all stock picks and represents some of the best investing students in universities and colleges in the U.S. However, for now, our main focus will be on building the foundation of The Wonderkind alone.
Management Summary
The initial management team consists of the founders, Frank Peanut and Jacob Sweller. As we grow, we will be looking to recruit exceptionally qualified students. Both partners are currently taking on as much responsibilities as possible and working together on a number of critical issues.
6.1 Organizational Structure
Frank Peanut and Jacob Sweller will remain full-time partners for the short term. We will look to expand our organizational structure of student networks very shortly and have already contacted a select few potential analysts for The Wonderkind. These students come from universities including: University of Pennsylvania, University of Virginia, and Duke University.
6.2 Management Team
Both founding partners have unique resumes and background experiences. They each bring to the table distinct personal qualities that will complement one another as they manage and grow their business.
Frank Peanut is majoring in finance and is ranked in the top 5% of his class. His past experience includes being mentored under the guidance of two hedge fund managers in Minneapolis. Frank currently serves as the Co-fund Manager of the Investment Club at school responsible for approximately $400,000 in assets. Frank has been managing his own personal funds in the equity markets since the age of 14. His future plans after graduation entail working in the Investment Banking industry for a short duration and then attending graduate school.
Jacob Sweller is on track to receive a dual degree in finance and government. Jacob, enrolled in the Honors Program, scored a 1500 on the SAT exam and is currently ranked in the top 10% of his class. While at school, Jacob has been extremely active in the business arena and has directed business-consulting presentations to the Credit Suisse First Boston investment banking firm as well as McKinsey & Co. consulting firm. Jacob has received over 30 prestigious awards in academics and athletics over the past few years. Jacob currently serves as the Co-fund Manager of the Investment Club responsible for approximately $400,000 in assets.
6.3 Management Team Gaps
Our management team identified insufficient expertise in Web development as an area of concern. While both Frank Peanut and Jacob Sweller have some experience with HTML hard coding and building basic Web pages, neither has the expertise to develop the website that they had originally envisioned.
Several solutions to this problem were evaluated:
- Bringing in a third partner to specialize entirely in building and maintaining the company’s website.
- Hiring a professional Web-development team to build and host a custom website.
- Partnering with Vista.
Vista.com is a revolutionary e-Business Infrastructure Provider (eBIP) delivering a fully automated and integrated infrastructure platform for corporations to rapidly deliver e-business services to their small- and medium-size business customers. Vista will be providing us with an all-inclusive solution to develop our Web-based business. We are able to access a full range of tools through a Web browser platform from any computer terminal with Internet access. In addition, Vista will be hosting our site and managing a range of smaller details related to maintaining a business on the Web. They have provided us with the tools necessary to implement a fully enabled e-commerce site that has many features including customer database management, password protected content filled areas, email management, and a myriad of other back office applications that will prove extremely useful and necessary. While Vista has empowered us to create our website on our own, they also have customer support and technical specialists available twenty-four hours a day, seven days a week in the event that we need assistance with any area of our site. We feel that in choosing to setup our business with Vista, we have effectively filled the Web design gap that initially existed. Vista should allow for our growth and expansion plans as we envision them.
6.4 Personnel Plan
The Writers: Our writers will be students who submit articles for publishing on The Wonderkind website and newsletter. Only select articles that embody the quality and spirit of The Wonderkind will be published. The writers will not be paid but will gain the opportunity to be promoted to analyst status through exceptional written articles.
The Analysts: An analyst is defined as a consistent writer for The Wonderkind. These analysts will represent the best of our writers and will be true investment wunderkinds. We estimate that each analyst will make approximately $400 per month. Each analyst will be paid X amount of dollars per customer for every month plus a monthly commission determined by the analyst’s quality of service provided to the customers. We estimate the average commission at about $100 monthly for the first year.
The Wonderkind will not have any personnel during the initial stages of operation, during which the partners of the company will handle all services and site operations. We plan to employ 10 full-time analysts by the end of year one. By year three we plan to have 25 analysts on payroll. The table below indicates the payroll provided by The Wonderkind. Not all analysts are expected to produce articles for our company every month.
| Personnel Plan | |||
| Year 1 | Year 2 | Year 3 | |
| Frank Peanut – CEO | $5,000 | $12,000 | $24,000 |
| Jacob Sweller | $5,000 | $12,000 | $24,000 |
| Analyst | $200 | $3,500 | $7,000 |
| Analyst | $400 | $3,500 | $7,000 |
| Analyst | $400 | $3,500 | $7,000 |
| Analyst | $500 | $3,500 | $7,000 |
| Analyst | $200 | $3,500 | $7,000 |
| Analyst | $500 | $3,500 | $7,000 |
| Analyst | $200 | $3,500 | $7,000 |
| Analyst | $400 | $3,500 | $7,000 |
| Analyst | $300 | $3,500 | $7,000 |
| Analyst | $200 | $3,500 | $7,000 |
| Total People | 9 | 18 | 25 |
| Total Payroll | $13,300 | $59,000 | $118,000 |
Financial Plan
We want to finance growth mainly through free cash flow. We recognize that this means we will have to grow more slowly than we might like. We think that this strategy of more conservative financial management makes sense since we are not trying to create a conglomerate financial company, rather one that focuses on what we believe to be our core competencies and interests. We believe in financing opportunities that add value to our company from a cost/benefit analysis perspective. However, we will not blindly invest our resources in endeavors that do not have a high likelihood of bearing fruit in the future.
7.1 Important Assumptions
Our most important assumption is regarding the arrangement we have obtained with Vista whereby we are in essence being subsidized 100% for the first year. Vista, nonetheless, currently charges regular paying customers $100/month or $599/year.
| General Assumptions | |||
| Year 1 | Year 2 | Year 3 | |
| Plan Month | 1 | 2 | 3 |
| Current Interest Rate | 8.75% | 8.75% | 8.75% |
| Long-term Interest Rate | 8.75% | 8.75% | 8.75% |
| Tax Rate | 16.25% | 15.00% | 16.25% |
| Other | 0 | 0 | 0 |
7.2 Key Financial Indicators
We foresee steadily rising service revenues starting in June of 2001. Our initial objectives for client retention should lend itself directly to our sales forecasts. It is important to note that these goals as stated are extremely subjective to change once we begin operating and acquire a better feel for our market.

7.3 Break-even Analysis
By the beginning of the second year, assuming that we pay the costs related to Vista’s services, and assuming 10 analysts on the payroll, the Break-even Analysis below shows what is needed in sales to break even.

| Break-even Analysis | |
| Monthly Units Break-even | 126 |
| Monthly Revenue Break-even | $1,866 |
| Assumptions: | |
| Average Per-Unit Revenue | $14.76 |
| Average Per-Unit Variable Cost | $1.00 |
| Estimated Monthly Fixed Cost | $1,740 |
7.4 Projected Profit and Loss
The Wonderkind should be a profitable entity following the first year. This is possible because of our minimal start-up expenses and projections for consistent sales growth. Also, our arrangement with Vista for a full year’s worth of service free of charge is a substantial financial subsidy. The primary expenses incurred will be marketing and payroll. Marketing expenses will include printing fees for brochures to be distributed and other promotional initiatives.
The following table shows the Projected Profit and Loss for The Wonderkind.


| Pro Forma Profit and Loss | |||
| Year 1 | Year 2 | Year 3 | |
| Sales | $23,032 | $76,752 | $196,400 |
| Direct Cost of Sales | $1,560 | $5,040 | $12,600 |
| Other | $0 | $0 | $0 |
| Total Cost of Sales | $1,560 | $5,040 | $12,600 |
| Gross Margin | $21,472 | $71,712 | $183,800 |
| Gross Margin % | 93.23% | 93.43% | 93.58% |
| Expenses | |||
| Payroll | $13,300 | $59,000 | $118,000 |
| Sales and Marketing and Other Expenses | $6,250 | $5,600 | $5,600 |
| Depreciation | $0 | $0 | $0 |
| Rent | $0 | $0 | $7,200 |
| Leased Equipment | $0 | $0 | $0 |
| Utilities | $0 | $0 | $0 |
| Insurance | $0 | $0 | $0 |
| Payroll Taxes | $1,330 | $5,900 | $11,800 |
| Other | $0 | $0 | $0 |
| Total Operating Expenses | $20,880 | $70,500 | $142,600 |
| Profit Before Interest and Taxes | $592 | $1,212 | $41,200 |
| EBITDA | $592 | $1,212 | $41,200 |
| Interest Expense | $321 | $481 | $394 |
| Taxes Incurred | $41 | $110 | $6,631 |
| Net Profit | $231 | $621 | $34,176 |
| Net Profit/Sales | 1.00% | 0.81% | 17.40% |
7.5 Projected Cash Flow
The following chart and table show the Projected Cash Flow for The Wonderkind.

| Pro Forma Cash Flow | |||
| Year 1 | Year 2 | Year 3 | |
| Cash Received | |||
| Cash from Operations | |||
| Cash Sales | $0 | $0 | $0 |
| Cash from Receivables | $13,894 | $55,438 | $148,928 |
| Subtotal Cash from Operations | $13,894 | $55,438 | $148,928 |
| Additional Cash Received | |||
| Sales Tax, VAT, HST/GST Received | $0 | $0 | $0 |
| New Current Borrowing | $2,000 | $5,000 | $0 |
| New Other Liabilities (interest-free) | $0 | $0 | $0 |
| New Long-term Liabilities | $0 | $0 | $0 |
| Sales of Other Current Assets | $0 | $0 | $0 |
| Sales of Long-term Assets | $0 | $0 | $0 |
| New Investment Received | $0 | $47,000 | $0 |
| Subtotal Cash Received | $15,894 | $107,438 | $148,928 |
| Expenditures | Year 1 | Year 2 | Year 3 |
| Expenditures from Operations | |||
| Cash Spending | $13,300 | $59,000 | $118,000 |
| Bill Payments | $7,842 | $17,382 | $41,998 |
| Subtotal Spent on Operations | $21,142 | $76,382 | $159,998 |
| Additional Cash Spent | |||
| Sales Tax, VAT, HST/GST Paid Out | $0 | $0 | $0 |
| Principal Repayment of Current Borrowing | $0 | $2,000 | $5,000 |
| Other Liabilities Principal Repayment | $0 | $0 | $0 |
| Long-term Liabilities Principal Repayment | $0 | $0 | $0 |
| Purchase Other Current Assets | $0 | $0 | $0 |
| Purchase Long-term Assets | $0 | $0 | $2,500 |
| Dividends | $0 | $0 | $0 |
| Subtotal Cash Spent | $21,142 | $78,382 | $167,498 |
| Net Cash Flow | ($5,248) | $29,055 | ($18,570) |
| Cash Balance | $9,852 | $38,907 | $20,337 |
7.6 Business Ratios
The Industry standard ratios are for the Other Management Consulting service industry, NAICS code 541618. A quick comparison between the industry standards and Wonderkind shows that our company is in a class all by itself. Therefore, some explanation is necessary. First of all, because it is primarily an Internet company, all sales will be on credit. This means that the company has a very high amount of accounts receivable. In addition, the company has a very high gross margin for the same reasons. Furthermore, because it is a service company utilizing currently owned assets, the company has few long-term assets. We expect the company to have a decreasing net worth as the sales growth slows down, however it may seem abnormally high for some time.
| Ratio Analysis | ||||
| Year 1 | Year 2 | Year 3 | Industry Profile | |
| Sales Growth | 0.00% | 233.24% | 155.89% | 7.29% |
| Percent of Total Assets | ||||
| Accounts Receivable | 48.12% | 43.91% | 77.34% | 27.65% |
| Other Current Assets | 0.00% | 0.00% | 0.00% | 50.47% |
| Total Current Assets | 100.00% | 100.00% | 97.52% | 81.73% |
| Long-term Assets | 0.00% | 0.00% | 2.48% | 18.27% |
| Total Assets | 100.00% | 100.00% | 100.00% | 100.00% |
| Current Liabilities | 19.27% | 9.24% | 3.61% | 32.03% |
| Long-term Liabilities | 10.53% | 2.88% | 1.98% | 21.13% |
| Total Liabilities | 29.80% | 12.12% | 5.59% | 53.16% |
| Net Worth | 70.20% | 87.88% | 94.41% | 46.84% |
| Percent of Sales | ||||
| Sales | 100.00% | 100.00% | 100.00% | 100.00% |
| Gross Margin | 93.23% | 93.43% | 93.58% | 100.00% |
| Selling, General & Administrative Expenses | 92.23% | 92.62% | 75.92% | 75.12% |
| Advertising Expenses | 16.93% | 6.51% | 2.55% | 1.53% |
| Profit Before Interest and Taxes | 2.57% | 1.58% | 20.98% | 1.69% |
| Main Ratios | ||||
| Current | 5.19 | 10.82 | 27.03 | 1.82 |
| Quick | 5.19 | 10.82 | 27.03 | 1.42 |
| Total Debt to Total Assets | 29.80% | 12.12% | 5.59% | 63.28% |
| Pre-tax Return on Net Worth | 2.03% | 1.20% | 42.90% | 3.39% |
| Pre-tax Return on Assets | 1.43% | 1.05% | 40.50% | 9.24% |
| Additional Ratios | Year 1 | Year 2 | Year 3 | |
| Net Profit Margin | 1.00% | 0.81% | 17.40% | n.a |
| Return on Equity | 1.73% | 1.02% | 35.93% | n.a |
| Activity Ratios | ||||
| Accounts Receivable Turnover | 2.52 | 2.52 | 2.52 | n.a |
| Collection Days | 41 | 94 | 101 | n.a |
| Accounts Payable Turnover | 5.73 | 12.17 | 12.17 | n.a |
| Payment Days | 27 | 33 | 21 | n.a |
| Total Asset Turnover | 1.21 | 1.11 | 1.95 | n.a |
| Debt Ratios | ||||
| Debt to Net Worth | 0.42 | 0.14 | 0.06 | n.a |
| Current Liab. to Liab. | 0.65 | 0.76 | 0.65 | n.a |
| Liquidity Ratios | ||||
| Net Working Capital | $15,331 | $62,952 | $94,627 | n.a |
| Interest Coverage | 1.85 | 2.52 | 104.64 | n.a |
| Additional Ratios | ||||
| Assets to Sales | 0.82 | 0.90 | 0.51 | n.a |
| Current Debt/Total Assets | 19% | 9% | 4% | n.a |
| Acid Test | 2.69 | 6.07 | 5.59 | n.a |
| Sales/Net Worth | 1.73 | 1.26 | 2.06 | n.a |
| Dividend Payout | 0.00 | 0.00 | 0.00 | n.a |
7.7 Projected Balance Sheet
The table below is the Project Balance Sheet.
| Pro Forma Balance Sheet | |||
| Year 1 | Year 2 | Year 3 | |
| Assets | |||
| Current Assets | |||
| Cash | $9,852 | $38,907 | $20,337 |
| Accounts Receivable | $9,138 | $30,453 | $77,925 |
| Other Current Assets | $0 | $0 | $0 |
| Total Current Assets | $18,990 | $69,360 | $98,262 |
| Long-term Assets | |||
| Long-term Assets | $0 | $0 | $2,500 |
| Accumulated Depreciation | $0 | $0 | $0 |
| Total Long-term Assets | $0 | $0 | $2,500 |
| Total Assets | $18,990 | $69,360 | $100,762 |
| Liabilities and Capital | Year 1 | Year 2 | Year 3 |
| Current Liabilities | |||
| Accounts Payable | $1,659 | $1,408 | $3,635 |
| Current Borrowing | $2,000 | $5,000 | $0 |
| Other Current Liabilities | $0 | $0 | $0 |
| Subtotal Current Liabilities | $3,659 | $6,408 | $3,635 |
| Long-term Liabilities | $2,000 | $2,000 | $2,000 |
| Total Liabilities | $5,659 | $8,408 | $5,635 |
| Paid-in Capital | $14,000 | $61,000 | $61,000 |
| Retained Earnings | ($900) | ($669) | ($48) |
| Earnings | $231 | $621 | $34,176 |
| Total Capital | $13,331 | $60,952 | $95,127 |
| Total Liabilities and Capital | $18,990 | $69,360 | $100,762 |
| Net Worth | $13,331 | $60,952 | $95,127 |
Appendix
| Personnel Plan | |||||||||||||
| Month 1 | Month 2 | Month 3 | Month 4 | Month 5 | Month 6 | Month 7 | Month 8 | Month 9 | Month 10 | Month 11 | Month 12 | ||
| Frank Peanut – CEO | 0% | $0 | $0 | $0 | $0 | $0 | $0 | $0 | $1,000 | $1,000 | $1,000 | $1,000 | $1,000 |
| Jacob Sweller | 0% | $0 | $0 | $0 | $0 | $0 | $0 | $0 | $1,000 | $1,000 | $1,000 | $1,000 | $1,000 |
| Analyst | 0% | $0 | $0 | $0 | $0 | $0 | $0 | $0 | $0 | $100 | $0 | $100 | $0 |
| Analyst | 0% | $0 | $0 | $0 | $0 | $0 | $0 | $0 | $100 | $0 | $100 | $100 | $100 |
| Analyst | 0% | $0 | $0 | $0 | $0 | $0 | $0 | $0 | $100 | $100 | $100 | $100 | $0 |
| Analyst | 0% | $0 | $0 | $0 | $0 | $0 | $0 | $0 | $100 | $100 | $0 | $100 | $200 |
| Analyst | 0% | $0 | $0 | $0 | $0 | $0 | $0 | $0 | $0 | $0 | $100 | $0 | $100 |
| Analyst | 0% | $0 | $0 | $0 | $0 | $0 | $0 | $0 | $100 | $100 | $100 | $100 | $100 |
| Analyst | 0% | $0 | $0 | $0 | $0 | $0 | $0 | $0 | $0 | $100 | $0 | $100 | $0 |
| Analyst | 0% | $0 | $0 | $0 | $0 | $0 | $0 | $0 | $0 | $0 | $100 | $100 | $200 |
| Analyst | 0% | $0 | $0 | $0 | $0 | $0 | $0 | $0 | $0 | $0 | $0 | $100 | $200 |
| Analyst | 0% | $0 | $0 | $0 | $0 | $0 | $0 | $0 | $0 | $0 | $0 | $0 | $200 |
| Total People | 0 | 0 | 0 | 0 | 0 | 0 | 0 | 6 | 7 | 7 | 10 | 9 | |
| Total Payroll | $0 | $0 | $0 | $0 | $0 | $0 | $0 | $2,400 | $2,500 | $2,500 | $2,800 | $3,100 | |
| General Assumptions | ||||||||||||
| Month 1 | Month 2 | Month 3 | Month 4 | Month 5 | Month 6 | Month 7 | Month 8 | Month 9 | Month 10 | Month 11 | Month 12 | |
| Plan Month | 1 | 2 | 3 | 4 | 5 | 6 | 7 | 8 | 9 | 10 | 11 | 12 |
| Current Interest Rate | 8.75% | 8.75% | 8.75% | 8.75% | 8.75% | 8.75% | 8.75% | 8.75% | 8.75% | 8.75% | 8.75% | 8.75% |
| Long-term Interest Rate | 8.75% | 8.75% | 8.75% | 8.75% | 8.75% | 8.75% | 8.75% | 8.75% | 8.75% | 8.75% | 8.75% | 8.75% |
| Tax Rate | 15.00% | 15.00% | 15.00% | 15.00% | 15.00% | 15.00% | 15.00% | 15.00% | 15.00% | 15.00% | 15.00% | 15.00% |
| Other | 0 | 0 | 0 | 0 | 0 | 0 | 0 | 0 | 0 | 0 | 0 | 0 |
| Pro Forma Profit and Loss | |||||||||||||
| Month 1 | Month 2 | Month 3 | Month 4 | Month 5 | Month 6 | Month 7 | Month 8 | Month 9 | Month 10 | Month 11 | Month 12 | ||
| Sales | $0 | $0 | $0 | $0 | $0 | $0 | $0 | $2,099 | $4,264 | $4,401 | $5,867 | $6,400 | |
| Direct Cost of Sales | $0 | $0 | $0 | $0 | $0 | $0 | $0 | $113 | $269 | $326 | $404 | $448 | |
| Other | $0 | $0 | $0 | $0 | $0 | $0 | $0 | $0 | $0 | $0 | $0 | $0 | |
| Total Cost of Sales | $0 | $0 | $0 | $0 | $0 | $0 | $0 | $113 | $269 | $326 | $404 | $448 | |
| Gross Margin | $0 | $0 | $0 | $0 | $0 | $0 | $0 | $1,986 | $3,995 | $4,075 | $5,463 | $5,952 | |
| Gross Margin % | 0.00% | 0.00% | 0.00% | 0.00% | 0.00% | 0.00% | 0.00% | 94.62% | 93.69% | 92.59% | 93.11% | 93.00% | |
| Expenses | |||||||||||||
| Payroll | $0 | $0 | $0 | $0 | $0 | $0 | $0 | $2,400 | $2,500 | $2,500 | $2,800 | $3,100 | |
| Sales and Marketing and Other Expenses | $200 | $200 | $300 | $500 | $600 | $600 | $600 | $650 | $650 | $650 | $650 | $650 | |
| Depreciation | $0 | $0 | $0 | $0 | $0 | $0 | $0 | $0 | $0 | $0 | $0 | $0 | |
| Rent | $0 | $0 | $0 | $0 | $0 | $0 | $0 | $0 | $0 | $0 | $0 | $0 | |
| Leased Equipment | $0 | $0 | $0 | $0 | $0 | $0 | $0 | $0 | $0 | $0 | $0 | $0 | |
| Utilities | $0 | $0 | $0 | $0 | $0 | $0 | $0 | $0 | $0 | $0 | $0 | $0 | |
| Insurance | $0 | $0 | $0 | $0 | $0 | $0 | $0 | $0 | $0 | $0 | $0 | $0 | |
| Payroll Taxes | 10% | $0 | $0 | $0 | $0 | $0 | $0 | $0 | $240 | $250 | $250 | $280 | $310 |
| Other | $0 | $0 | $0 | $0 | $0 | $0 | $0 | $0 | $0 | $0 | $0 | $0 | |
| Total Operating Expenses | $200 | $200 | $300 | $500 | $600 | $600 | $600 | $3,290 | $3,400 | $3,400 | $3,730 | $4,060 | |
| Profit Before Interest and Taxes | ($200) | ($200) | ($300) | ($500) | ($600) | ($600) | ($600) | ($1,304) | $595 | $675 | $1,733 | $1,892 | |
| EBITDA | ($200) | ($200) | ($300) | ($500) | ($600) | ($600) | ($600) | ($1,304) | $595 | $675 | $1,733 | $1,892 | |
| Interest Expense | $15 | $15 | $29 | $29 | $29 | $29 | $29 | $29 | $29 | $29 | $29 | $29 | |
| Taxes Incurred | ($32) | ($32) | ($49) | ($79) | ($94) | ($94) | ($94) | ($200) | $85 | $97 | $256 | $279 | |
| Net Profit | ($182) | ($182) | ($280) | ($450) | ($535) | ($535) | ($535) | ($1,133) | $481 | $549 | $1,449 | $1,584 | |
| Net Profit/Sales | 0.00% | 0.00% | 0.00% | 0.00% | 0.00% | 0.00% | 0.00% | -53.96% | 11.28% | 12.48% | 24.69% | 24.74% | |
| Pro Forma Cash Flow | |||||||||||||
| Month 1 | Month 2 | Month 3 | Month 4 | Month 5 | Month 6 | Month 7 | Month 8 | Month 9 | Month 10 | Month 11 | Month 12 | ||
| Cash Received | |||||||||||||
| Cash from Operations | |||||||||||||
| Cash Sales | $0 | $0 | $0 | $0 | $0 | $0 | $0 | $0 | $0 | $0 | $0 | $0 | |
| Cash from Receivables | $0 | $0 | $0 | $0 | $0 | $0 | $0 | $0 | $1,120 | $3,254 | $4,337 | $5,183 | |
| Subtotal Cash from Operations | $0 | $0 | $0 | $0 | $0 | $0 | $0 | $0 | $1,120 | $3,254 | $4,337 | $5,183 | |
| Additional Cash Received | |||||||||||||
| Sales Tax, VAT, HST/GST Received | 0.00% | $0 | $0 | $0 | $0 | $0 | $0 | $0 | $0 | $0 | $0 | $0 | $0 |
| New Current Borrowing | $0 | $0 | $2,000 | $0 | $0 | $0 | $0 | $0 | $0 | $0 | $0 | $0 | |
| New Other Liabilities (interest-free) | $0 | $0 | $0 | $0 | $0 | $0 | $0 | $0 | $0 | $0 | $0 | $0 | |
| New Long-term Liabilities | $0 | $0 | $0 | $0 | $0 | $0 | $0 | $0 | $0 | $0 | $0 | $0 | |
| Sales of Other Current Assets | $0 | $0 | $0 | $0 | $0 | $0 | $0 | $0 | $0 | $0 | $0 | $0 | |
| Sales of Long-term Assets | $0 | $0 | $0 | $0 | $0 | $0 | $0 | $0 | $0 | $0 | $0 | $0 | |
| New Investment Received | $0 | $0 | $0 | $0 | $0 | $0 | $0 | $0 | $0 | $0 | $0 | $0 | |
| Subtotal Cash Received | $0 | $0 | $2,000 | $0 | $0 | $0 | $0 | $0 | $1,120 | $3,254 | $4,337 | $5,183 | |
| Expenditures | Month 1 | Month 2 | Month 3 | Month 4 | Month 5 | Month 6 | Month 7 | Month 8 | Month 9 | Month 10 | Month 11 | Month 12 | |
| Expenditures from Operations | |||||||||||||
| Cash Spending | $0 | $0 | $0 | $0 | $0 | $0 | $0 | $2,400 | $2,500 | $2,500 | $2,800 | $3,100 | |
| Bill Payments | $6 | $182 | $186 | $285 | $453 | $535 | $535 | $545 | $847 | $1,285 | $1,361 | $1,622 | |
| Subtotal Spent on Operations | $6 | $182 | $186 | $285 | $453 | $535 | $535 | $2,945 | $3,347 | $3,785 | $4,161 | $4,722 | |
| Additional Cash Spent | |||||||||||||
| Sales Tax, VAT, HST/GST Paid Out | $0 | $0 | $0 | $0 | $0 | $0 | $0 | $0 | $0 | $0 | $0 | $0 | |
| Principal Repayment of Current Borrowing | $0 | $0 | $0 | $0 | $0 | $0 | $0 | $0 | $0 | $0 | $0 | $0 | |
| Other Liabilities Principal Repayment | $0 | $0 | $0 | $0 | $0 | $0 | $0 | $0 | $0 | $0 | $0 | $0 | |
| Long-term Liabilities Principal Repayment | $0 | $0 | $0 | $0 | $0 | $0 | $0 | $0 | $0 | $0 | $0 | $0 | |
| Purchase Other Current Assets | $0 | $0 | $0 | $0 | $0 | $0 | $0 | $0 | $0 | $0 | $0 | $0 | |
| Purchase Long-term Assets | $0 | $0 | $0 | $0 | $0 | $0 | $0 | $0 | $0 | $0 | $0 | $0 | |
| Dividends | $0 | $0 | $0 | $0 | $0 | $0 | $0 | $0 | $0 | $0 | $0 | $0 | |
| Subtotal Cash Spent | $6 | $182 | $186 | $285 | $453 | $535 | $535 | $2,945 | $3,347 | $3,785 | $4,161 | $4,722 | |
| Net Cash Flow | ($6) | ($182) | $1,814 | ($285) | ($453) | ($535) | ($535) | ($2,945) | ($2,228) | ($532) | $176 | $461 | |
| Cash Balance | $15,094 | $14,912 | $16,726 | $16,440 | $15,988 | $15,453 | $14,918 | $11,974 | $9,746 | $9,214 | $9,390 | $9,852 | |
| Pro Forma Balance Sheet | |||||||||||||
| Month 1 | Month 2 | Month 3 | Month 4 | Month 5 | Month 6 | Month 7 | Month 8 | Month 9 | Month 10 | Month 11 | Month 12 | ||
| Assets | Starting Balances | ||||||||||||
| Current Assets | |||||||||||||
| Cash | $15,100 | $15,094 | $14,912 | $16,726 | $16,440 | $15,988 | $15,453 | $14,918 | $11,974 | $9,746 | $9,214 | $9,390 | $9,852 |
| Accounts Receivable | $0 | $0 | $0 | $0 | $0 | $0 | $0 | $0 | $2,099 | $5,244 | $6,391 | $7,921 | $9,138 |
| Other Current Assets | $0 | $0 | $0 | $0 | $0 | $0 | $0 | $0 | $0 | $0 | $0 | $0 | $0 |
| Total Current Assets | $15,100 | $15,094 | $14,912 | $16,726 | $16,440 | $15,988 | $15,453 | $14,918 | $14,073 | $14,989 | $15,605 | $17,312 | $18,990 |
| Long-term Assets | |||||||||||||
| Long-term Assets | $0 | $0 | $0 | $0 | $0 | $0 | $0 | $0 | $0 | $0 | $0 | $0 | $0 |
| Accumulated Depreciation | $0 | $0 | $0 | $0 | $0 | $0 | $0 | $0 | $0 | $0 | $0 | $0 | $0 |
| Total Long-term Assets | $0 | $0 | $0 | $0 | $0 | $0 | $0 | $0 | $0 | $0 | $0 | $0 | $0 |
| Total Assets | $15,100 | $15,094 | $14,912 | $16,726 | $16,440 | $15,988 | $15,453 | $14,918 | $14,073 | $14,989 | $15,605 | $17,312 | $18,990 |
| Liabilities and Capital | Month 1 | Month 2 | Month 3 | Month 4 | Month 5 | Month 6 | Month 7 | Month 8 | Month 9 | Month 10 | Month 11 | Month 12 | |
| Current Liabilities | |||||||||||||
| Accounts Payable | $0 | $176 | $176 | $270 | $435 | $517 | $517 | $517 | $805 | $1,240 | $1,307 | $1,565 | $1,659 |
| Current Borrowing | $0 | $0 | $0 | $2,000 | $2,000 | $2,000 | $2,000 | $2,000 | $2,000 | $2,000 | $2,000 | $2,000 | $2,000 |
| Other Current Liabilities | $0 | $0 | $0 | $0 | $0 | $0 | $0 | $0 | $0 | $0 | $0 | $0 | $0 |
| Subtotal Current Liabilities | $0 | $176 | $176 | $2,270 | $2,435 | $2,517 | $2,517 | $2,517 | $2,805 | $3,240 | $3,307 | $3,565 | $3,659 |
| Long-term Liabilities | $2,000 | $2,000 | $2,000 | $2,000 | $2,000 | $2,000 | $2,000 | $2,000 | $2,000 | $2,000 | $2,000 | $2,000 | $2,000 |
| Total Liabilities | $2,000 | $2,176 | $2,176 | $4,270 | $4,435 | $4,517 | $4,517 | $4,517 | $4,805 | $5,240 | $5,307 | $5,565 | $5,659 |
| Paid-in Capital | $14,000 | $14,000 | $14,000 | $14,000 | $14,000 | $14,000 | $14,000 | $14,000 | $14,000 | $14,000 | $14,000 | $14,000 | $14,000 |
| Retained Earnings | ($900) | ($900) | ($900) | ($900) | ($900) | ($900) | ($900) | ($900) | ($900) | ($900) | ($900) | ($900) | ($900) |
| Earnings | $0 | ($182) | ($365) | ($645) | ($1,094) | ($1,629) | ($2,164) | ($2,699) | ($3,832) | ($3,351) | ($2,802) | ($1,353) | $231 |
| Total Capital | $13,100 | $12,918 | $12,735 | $12,455 | $12,006 | $11,471 | $10,936 | $10,401 | $9,268 | $9,749 | $10,298 | $11,747 | $13,331 |
| Total Liabilities and Capital | $15,100 | $15,094 | $14,912 | $16,726 | $16,440 | $15,988 | $15,453 | $14,918 | $14,073 | $14,989 | $15,605 | $17,312 | $18,990 |
| Net Worth | $13,100 | $12,918 | $12,735 | $12,455 | $12,006 | $11,471 | $10,936 | $10,401 | $9,268 | $9,749 | $10,298 | $11,747 | $13,331 |
| Sales Forecast | |||||||||||||
| Month 1 | Month 2 | Month 3 | Month 4 | Month 5 | Month 6 | Month 7 | Month 8 | Month 9 | Month 10 | Month 11 | Month 12 | ||
| Unit Sales | |||||||||||||
| Portfolio View ($12.95/mo.) | 0% | 0 | 0 | 0 | 0 | 0 | 0 | 0 | 60 | 100 | 160 | 200 | 200 |
| Portfolio View ($129.95/yr.) | 0% | 0 | 0 | 0 | 0 | 0 | 0 | 0 | 0 | 80 | 120 | 120 | 160 |
| Premium Service ($24.95/mo.) | 0% | 0 | 0 | 0 | 0 | 0 | 0 | 0 | 53 | 53 | 10 | 48 | 52 |
| Premium Service ($260/yr.) | 0% | 0 | 0 | 0 | 0 | 0 | 0 | 0 | 0 | 36 | 36 | 36 | 36 |
| Other | 0% | 0 | 0 | 0 | 0 | 0 | 0 | 0 | 0 | 0 | 0 | 0 | 0 |
| Total Unit Sales | 0 | 0 | 0 | 0 | 0 | 0 | 0 | 113 | 269 | 326 | 404 | 448 | |
| Unit Prices | Month 1 | Month 2 | Month 3 | Month 4 | Month 5 | Month 6 | Month 7 | Month 8 | Month 9 | Month 10 | Month 11 | Month 12 | |
| Portfolio View ($12.95/mo.) | $0.00 | $0.00 | $0.00 | $0.00 | $0.00 | $0.00 | $0.00 | $12.95 | $12.95 | $12.95 | $12.95 | $12.95 | |
| Portfolio View ($129.95/yr.) | $0.00 | $0.00 | $0.00 | $0.00 | $0.00 | $0.00 | $0.00 | $0.00 | $10.83 | $10.83 | $10.83 | $10.83 | |
| Premium Service ($24.95/mo.) | $0.00 | $0.00 | $0.00 | $0.00 | $0.00 | $0.00 | $0.00 | $24.95 | $24.95 | $24.95 | $24.95 | $24.95 | |
| Premium Service ($260/yr.) | $0.00 | $0.00 | $0.00 | $0.00 | $0.00 | $0.00 | $0.00 | $0.00 | $21.67 | $21.67 | $21.67 | $21.67 | |
| Other | $0.00 | $0.00 | $0.00 | $0.00 | $0.00 | $0.00 | $0.00 | $0.00 | $0.00 | $0.00 | $0.00 | $0.00 | |
| Sales | |||||||||||||
| Portfolio View ($12.95/mo.) | $0 | $0 | $0 | $0 | $0 | $0 | $0 | $777 | $1,295 | $2,072 | $2,590 | $2,590 | |
| Portfolio View ($129.95/yr.) | $0 | $0 | $0 | $0 | $0 | $0 | $0 | $0 | $866 | $1,300 | $1,300 | $1,733 | |
| Premium Service ($24.95/mo.) | $0 | $0 | $0 | $0 | $0 | $0 | $0 | $1,322 | $1,322 | $250 | $1,198 | $1,297 | |
| Premium Service ($260/yr.) | $0 | $0 | $0 | $0 | $0 | $0 | $0 | $0 | $780 | $780 | $780 | $780 | |
| Other | $0 | $0 | $0 | $0 | $0 | $0 | $0 | $0 | $0 | $0 | $0 | $0 | |
| Total Sales | $0 | $0 | $0 | $0 | $0 | $0 | $0 | $2,099 | $4,264 | $4,401 | $5,867 | $6,400 | |
| Direct Unit Costs | Month 1 | Month 2 | Month 3 | Month 4 | Month 5 | Month 6 | Month 7 | Month 8 | Month 9 | Month 10 | Month 11 | Month 12 | |
| Portfolio View ($12.95/mo.) | 0.00% | $0.00 | $0.00 | $0.00 | $0.00 | $0.00 | $0.00 | $0.00 | $1.00 | $1.00 | $1.00 | $1.00 | $1.00 |
| Portfolio View ($129.95/yr.) | 0.00% | $0.00 | $0.00 | $0.00 | $0.00 | $0.00 | $0.00 | $0.00 | $0.00 | $1.00 | $1.00 | $1.00 | $1.00 |
| Premium Service ($24.95/mo.) | 0.00% | $0.00 | $0.00 | $0.00 | $0.00 | $0.00 | $0.00 | $0.00 | $1.00 | $1.00 | $1.00 | $1.00 | $1.00 |
| Premium Service ($260/yr.) | 0.00% | $0.00 | $0.00 | $0.00 | $0.00 | $0.00 | $0.00 | $0.00 | $0.00 | $1.00 | $1.00 | $1.00 | $1.00 |
| Other | 0.00% | $0.00 | $0.00 | $0.00 | $0.00 | $0.00 | $0.00 | $0.00 | $0.00 | $0.00 | $0.00 | $0.00 | $0.00 |
| Direct Cost of Sales | |||||||||||||
| Portfolio View ($12.95/mo.) | $0 | $0 | $0 | $0 | $0 | $0 | $0 | $60 | $100 | $160 | $200 | $200 | |
| Portfolio View ($129.95/yr.) | $0 | $0 | $0 | $0 | $0 | $0 | $0 | $0 | $80 | $120 | $120 | $160 | |
| Premium Service ($24.95/mo.) | $0 | $0 | $0 | $0 | $0 | $0 | $0 | $53 | $53 | $10 | $48 | $52 | |
| Premium Service ($260/yr.) | $0 | $0 | $0 | $0 | $0 | $0 | $0 | $0 | $36 | $36 | $36 | $36 | |
| Other | $0 | $0 | $0 | $0 | $0 | $0 | $0 | $0 | $0 | $0 | $0 | $0 | |
| Subtotal Direct Cost of Sales | $0 | $0 | $0 | $0 | $0 | $0 | $0 | $113 | $269 | $326 | $404 | $448 | |


