
Mad Keen Motors
Executive Summary
Mad Keen Motors is a family-owned business located in Backwater Downs, a suburb of London. It has been under the ownership of the Keen family for 35 years and has grown from a single mechanical repair shop to five locations that deal with body and mechanical repairs, vehicle storage and towing, washing and valeting and used car sales.
This plan is an internal document, outlining the effects on the company of adding a website. The Mad Keen Motors website will act as an additional customer service element for all our garages, offering basic advice on car maintenance, information about our services, staff, and location, and regular discount offers for website visitors on featured repairs and maintenance.
Our current phone-based and face-to-face customer service is excellent, but requires that potential customers make active contact with the company to learn about us. Most of our new business comes from referrals from current satisfied customers. We hope to make the referral process easier, by encouraging existing customers to point out our website to their friends, colleagues, neighbours and family members, building familiarity with our company long before they need emergency car care or consider buying another car. The “advice” section will be crucial in establishing customers’ trust in our expertise, as will our affiliation with nationally-syndicated car experts.
By helping local customers help themselves, Mad Keen hopes to build trust and relationships with existing and potential customers.
1.1 Mission
Mad Keen Motors provides excellent automotive care and service to all of our customers, whether they need to buy a used car, contract major body work or get a simple wash and wax.
1.2 Keys to Success
The keys to success for the company’s website will be:
- Compiling an extensive and thorough listing of questions and answers that will encourage customers to return to the site whenever they have a problem with their cars.
- Providing additional expert advice for answers that customers don’t find in the base list of questions in a timely and thorough manner.
- Offering Web-based promotions that will encourage customers to book cars into the garage through the website.
- Communicating the site’s existence to the businesses and residents within the local area.
- Getting existing customers to recommend the website to others.
1.3 Objectives
The objectives of the Mad Keen Motors website are:
- To drive traffic from the website to the garage.
- To expand the community of Mad Keen Motors customers.
- To provide customers with a substantial list of questions and answers regarding typical car repairs.
- To allow convenient bookings for service and repairs.
Company Summary
Mad Keen Motors is a family-owned business located in Backwater Downs, a suburb of London. It has been under the ownership of the Keen family for 35 years and has grown from a single mechanical repair shop to five locations that deal with body and mechanical repairs, vehicle storage and towing, washing and valeting and used car sales.
2.1 Company History
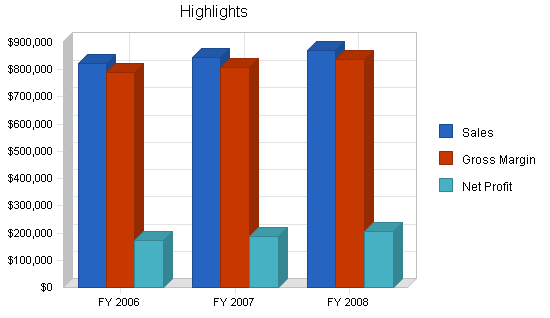
Mad Keen Motors has done very well. Annual net profits have exceeded £30,000 for the last two years. We decreased the marketing budget last year, which led to a small decline in sales. By directing the missing amount (and a bit more) towards the creation of a website, we hope to increase overall sales and net profits. The table shows only last year’s performance.

| Past Performance | |||
| FY 2003 | FY 2004 | FY 2005 | |
| Sales | £0 | £0 | £798,000 |
| Gross Margin | £0 | £0 | £767,853 |
| Gross Margin % | 0.00% | 0.00% | 96.22% |
| Operating Expenses | £0 | £0 | £695,820 |
| Inventory Turnover | 0.00 | 0.00 | 5.01 |
| Balance Sheet | |||
| FY 2003 | FY 2004 | FY 2005 | |
| Current Assets | |||
| Cash | £0 | £0 | £203,488 |
| Inventory | £0 | £0 | £12,040 |
| Other Current Assets | £0 | £0 | £70,000 |
| Total Current Assets | £0 | £0 | £285,528 |
| Long-term Assets | |||
| Long-term Assets | £0 | £0 | £1,250,000 |
| Accumulated Depreciation | £0 | £0 | £15,000 |
| Total Long-term Assets | £0 | £0 | £1,235,000 |
| Total Assets | £0 | £0 | £1,520,528 |
| Current Liabilities | |||
| Accounts Payable | £0 | £0 | £20,000 |
| Current Borrowing | £0 | £0 | £0 |
| Other Current Liabilities (interest free) | £0 | £0 | £0 |
| Total Current Liabilities | £0 | £0 | £20,000 |
| Long-term Liabilities | £0 | £0 | £750,000 |
| Total Liabilities | £0 | £0 | £770,000 |
| Paid-in Capital | £0 | £0 | £400,000 |
| Retained Earnings | £0 | £0 | £314,488 |
| Earnings | £0 | £0 | £36,040 |
| Total Capital | £0 | £0 | £750,528 |
| Total Capital and Liabilities | £0 | £0 | £1,520,528 |
| Other Inputs | |||
| Payment Days | 0 | 0 | 30 |
Products and Services
Mad Keen Motors offers body and mechanical repairs, vehicle storage and towing, washing and valeting and used car sales.
Market Analysis Summary
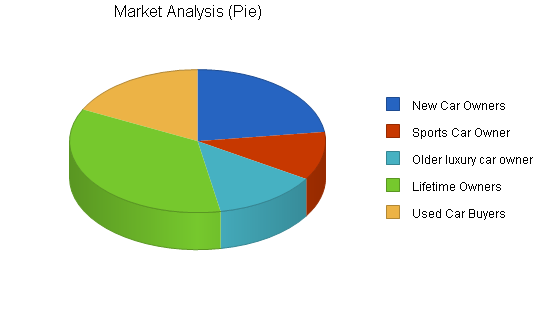
Mad Keen will target the following market segments with its website:
- New car owners
- Older luxury car owners
- Sports car owners
- Lifetime owners
- Buyers
4.1 Market Segmentation
Mad Keen Motors segments its customers by type of car ownership. We believe that the type of car that a person owns says volumes about their driving and therefore their garage requirements.
- New car owners: owners of newer cars are likely not to use the company’s garage repair service. If they do have problems with their car, they will return to the dealer where they bought it. These owners, though, will take great pride in their cars and will bring them often to the wash and valet service. The goal with these customers is to promote regular use of the wash and valet service. Eventually, as their warranty runs out, the goal will be to sell them on the efficiency, excellent service and price competitiveness of Mad Keen Motors’ repair services.
- Older luxury car owners: people who have either owned their high-end luxury cars for some years, or are unable to afford the expense of a brand new luxury car but want the feel of relaxed driving. Both of these groups want to keep their cars in the best shape possible. Those who have bought second-hand cars will often spend many hours in their cars and will place much importance on reliability. These owners will bring their cars in for regular services and occasional valets.
- Sports car owners: people who are younger, or middle-aged men, and will regard performance as important. They will also pride themselves on the look of their car and if involved in a minor scrape will have the body repaired very quickly, since looks are also important. These people will have regular service and tune-ups on their cars.
- Lifetime owners: many of these people have owned their cars for more than five or six years. They are more likely to be women. They are attached to their cars as friends and though it may be more sensible for them to purchase a new car, they will continue to have repairs done on their “old faithful.”
- Buyers: the site will provide links to information on new and used car prices and include tips on what to look for when buying a car.
| Market Analysis | |||||||
| 2005 | 2006 | 2007 | 2008 | 2009 | |||
| Potential Customers | Growth | CAGR | |||||
| New Car Owners | 2% | 52,000 | 53,040 | 54,101 | 55,183 | 56,287 | 2.00% |
| Sports Car Owner | 5% | 25,000 | 26,250 | 27,563 | 28,941 | 30,388 | 5.00% |
| Older luxury car owner | 10% | 30,000 | 33,000 | 36,300 | 39,930 | 43,923 | 10.00% |
| Lifetime Owners | 2% | 80,000 | 81,600 | 83,232 | 84,897 | 86,595 | 2.00% |
| Used Car Buyers | 12% | 40,000 | 44,800 | 50,176 | 56,197 | 62,941 | 12.00% |
| Total | 5.40% | 227,000 | 238,690 | 251,372 | 265,148 | 280,134 | 5.40% |
4.2 Target Market Segment Strategy
Aside from the washing and valet services, we are currently targeting owners of older cars or cars in need of much maintenance, since that will provide us the greatest revenue.
4.3 Service Business Analysis
The garage repair business as a whole is fragmented. There are a few major dealerships in each area, with a larger number of small garage repair shops, like Mad Keen Motors. Dealers target customers who buy new and used cars from them. Small garages rely on word of mouth and get most new customers because of emergency car care needs.
4.3.1 Competition and Buying Patterns
Word of mouth is important in the car repair business, since people are very wary of garages, due to their lack of knowledge of cars and engines. Mad Keen Motors leads the local competition in regards to word of mouth, having been in business for over three decades under the same ownership.
Brought to you by
Create a professional business plan
Using AI and step-by-step instructions
Create Your PlanSecure funding
Validate ideas
Build a strategy
Competition from dealerships is becoming stiffer. Car design is becoming more and more specialized, as car manufacturers aim to encourage owners of their vehicles to have services carried out at their franchised dealerships. However, small garages like Mad Keen have a price advantage over dealership, usually charging 50-70% less per hour for repair work.
Strategy and Implementation Summary
The marketing budget for this website is limited, so we will be relying on grassroots and viral marketing to spread the word about the site. In addition, the narrow geographical focus of the business does not necessitate large scale advertising and marketing support. We will focus on communicating with neighbours, nearby businesses, and existing customers to get the word out about the new website.
5.1 Competitive Edge
The website’s competitive edge is that it:
- Provides a local service for Backwater Downs car owners and wannabe car owners;
- Has the benefit of over 60 years of automobile repair experience to draw from;
- Provides an additional mode of communication for customers.
In addition, the website itself will be a competitive edge for the company as a whole, opening up new methods of communicating with our customers and potential customers, and making bookings and customer service faster and more convenient.
5.2 Marketing Strategy
Each of the car-owning groups identified in the Market Segmentation will be targeted, with different portions of the website directed at their unique needs.
Our marketing strategy for the website itself involves mailing fliers to all existing customers in our database, as well as to nearby neighbours and businesses. The fliers will include a special savings code – by going to the website and entering the code on the mailer, they access a 10% off coupon they can use on their next visit.
5.3 Sales Strategy
Mad Keen closes the sale by always putting our best face forward. Employees are thoroughly trained in customer service, the facilities are attractive and clean, and estimates for repair work are prepared promptly. A customer who is not suffering an immediate emergency will “shop around” until he finds a shop that feels trustworthy – it is our job to earn that trust in every encounter and contract.
5.3.1 Sales Forecast
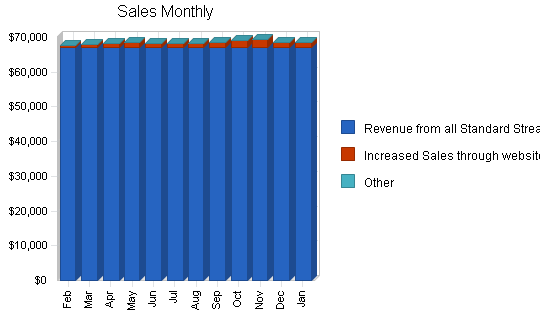
“Standard revenues” represents projections of existing revenue streams over the next three years. The second line shows projections for additional sales and costs directly related to the new website, either from increased visibility or online coupons.
By the end of the 2006, we expect almost 2.5% of monthly sales to be directly traceable to the website, rising to 4% by the end of 2008.

| Sales Forecast | |||
| FY 2006 | FY 2007 | FY 2008 | |
| Sales | |||
| Revenue from all Standard Streams | £804,000 | £820,080 | £836,482 |
| Increased Sales through website | £18,360 | £23,000 | £35,000 |
| Other | £0 | £0 | £0 |
| Total Sales | £822,360 | £843,080 | £871,482 |
| Direct Cost of Sales | FY 2006 | FY 2007 | FY 2008 |
| Direct Costs | £32,894 | £33,723 | £34,859 |
| Other | £0 | £0 | £0 |
| Subtotal Direct Cost of Sales | £32,894 | £33,723 | £34,859 |
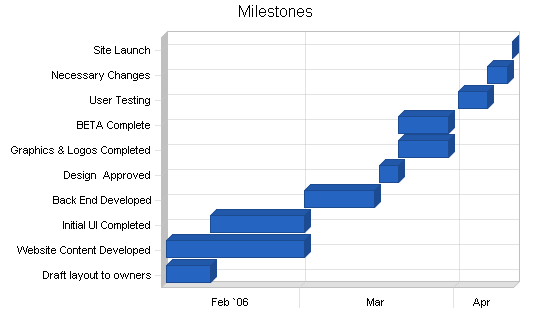
5.4 Milestones
The following milestones illustrate the timeline for the development and implementation of our website.
| Milestones | |||||
| Milestone | Start Date | End Date | Budget | Manager | Department |
| Draft layout to owners | 2/1/2006 | 2/10/2006 | £250 | Adrian | Consultant |
| Website Content Developed | 2/1/2006 | 3/1/2006 | £0 | Mark/Barry | Owners |
| Initial UI Completed | 2/10/2006 | 3/1/2006 | £500 | Adrian | Consultant |
| Back End Developed | 3/1/2006 | 3/15/2006 | £700 | Adrian | Consultant |
| Design Approved | 3/16/2006 | 3/20/2006 | £0 | Mark/Barry | Owners |
| Graphics & Logos Completed | 3/20/2006 | 3/30/2006 | £0 | Elisabeth | Admin |
| BETA Complete | 3/20/2006 | 3/30/2006 | £500 | Adrian | Consultant |
| User Testing | 4/1/2006 | 4/7/2006 | £200 | Adrian | Consultant |
| Necessary Changes | 4/7/2006 | 4/11/2006 | £200 | Adrian | Consultant |
| Site Launch | 4/12/2006 | 4/12/2006 | £0 | Adrian | Consultant |
| Totals | £2,350 | ||||
Web Plan Summary
The key champion for the development of the website is the co-owner of Mad Keen Motors, Mark Keen. He will be responsible for managing the development of the site and will work closely with Adrian Monkey on the design and creation. He will also be responsible for implementing the promotions that will be run at least monthly on the site and will maintain the “Ask the Mechanic” section on the site.
Most of the site development will be carried out by the consultant, Adrian Monkey. He will initially be paid a pre-arranged fee as he completes each stage of development. Later he will be paid a monthly retainer to maintain the site.
Barry Keen will work with Mark to develop the content section of the site dealing with typical car problems and tips on maintaining your vehicle during the different seasons.
Website Demographics Strategy
The website will focus on the the first three segments, since the last segment of lifetime owners are less likely to be connected to the Internet. It will also target people in the local area who aim to move into any of these categories (buyers), by providing information on how to buy a used car, and links to sites that contain new car reviews and pricing information.
Traffic Forecast
The following traffic forecast has been created after researching other small local service websites, and based on the size of the potential market with Internet presence in the Backwater Downs area. It is a conservative estimate of monthly page views and unique user sessions.
|
Feb |
Mar |
Apr |
May |
Jun |
Jul |
Aug |
Sep |
Oct |
Nov |
Dec |
Jan |
|
|
Unique Users |
100 |
175 |
250 |
450 |
600 |
400 |
400 |
600 |
600 |
500 |
400 |
600 |
|
Page Views |
500 |
800 |
1250 |
2200 |
2900 |
2000 |
2000 |
2900 |
2900 |
2400 |
2000 |
2900 |
|
|
|
|
|
|
|
|
|
|
|
|
|
|
|
Total |
600 |
975 |
1500 |
2650 |
3500 |
2400 |
2400 |
3500 |
3500 |
2900 |
2400 |
3500 |
6.1 Website Marketing Strategy
The website will have two main goals:
- To provide potential and existing customers with information about their cars through the provision of a typical problems area, plus an Ask the Mechanic Question and Answer section, where they can have specific questions about their cars answered.
- To ease the service experience and improve customer service through online booking database section that will allow them to review their cars service and repair records.
Key sections of the website will be:
- Question and Answer section.
- Ask the Mechanic section.
- Buyers guide–how to look for a new car.
- Links to information on car reviews–new and used.
Strategic Internet Alliances
Mad Keen Motors will rely on its alliance with Web consultant Adrian Monkey to ensure that the site is maintained and regularly updated.
Business Model
The aim of this site is not to earn direct sales, but to increase customer satisfaction rates, and therefore increase retention levels by 10%. In addition, the goal will be to encourage other customers in the Backwater Downs area to choose Mad Keen Motors over other service and repair facilities. The overall goal of the site in terms of increased sales is 7-10% over the next year.
Site Positioning
For sports car owners who value the importance of their car’s performance Mad Keen Motors website will give them tips on how to keep their car in tip-top running condition, with things that they can do themselves, as well as solutions that their local garage can provide. Unlike the local quick stop garages, it will provide part of the full-service solution for sports car owners. Unlike dealerships, prices will be competitive.
For older luxury car owners who value personal service, Mad Keen Motors website will provide another way for them to interact with the garage and provide excellent customer service. Unlike dealerships websites, it will not simply focus on new cars, it will provide them valuable information on their make and model of older luxury car as well as a full database of information on their car that they will be able to access at any time.
Brought to you by
Create a professional business plan
Using AI and step-by-step instructions
Create Your PlanSecure funding
Validate ideas
Build a strategy
For buyers who require an abundance of information when making a purchase, Mad Keen Motors website will provide an extensive list of online resources, so will act as a starting point for their search for information each time they access the Web. Unlike other online sites it will also give customers information about what to look for in a used car, that may save them the time and money of a mechanics inspection.
6.2 Development Requirements
Website Outline
The site will be designed with the following technology: ColdFusion, SQL and HTML.
Home Page: explains the website’s relation to the company, with visible links to the other sections of the site.
Section 1 – Q&A: begins with search. Visible links will go off to the subsections below.
- Ask the Mechanic: simple form that sends directly to the head mechanic.
- Q&A Browse: users will be able to browse through other customer’s Q&A sessions.
Section 2 – Booking
- Page 1: first page will display available dates, customer clicks on preferred available time, and proceeds to the next page.
- Page 2: customer fills out name, phone number, and car problem.
- Page 3: confirmation page for customer to print off as a reminder.
- User Car Information: first page has two links: “Buying a car” and “Selling a car.”
- Buying a car: first half of page with summary information, bottom half contains links to helpful sites.
- Selling a car: first half of page with summary information, bottom half contains links to helpful sites.
6.2.1 Technical Specifications
Front End
Because most people in the UK currently access the Web from their homes at 56.6k or less, the user interface will be a simple as possible, though still looking professional. Graphics will be kept to a minimum in order to keep download times short. Though pictures of cars for sale will take up room, thumbnail views with access to larger views will be used.
Information will be organized in buckets listed on front of each page so navigation will be as simple as possible for users.
The Objectives of the User Interface will be:
1. To allow easy and fast navigation for the users.
2. To create interest so that people will use and return to the site.
3. Display a lot of content information in a simple a manner as possible.
4. To encourage user interaction, i.e. bookings online and questions to the mechanics.
Back End
The back end of the site will be very simple, since it is really an information only website. There will be a number of areas where a visitor can send an email to request an answer to an expert question, to get information about a used car for sale or to book in their car for service.
Visitors will be able to interact with the site in two ways:
- Send an email requesting an appointment to have their car cleaned, valeted or repaired.
- To ask questions about problems they may be having with their car, for example “I had new brake pads fitted on my car approximately eight moths ago and they have started squeaking. Is it possible that they are worn out already?”
We will be hiring a Web engineer, Adrian Monkey, to build the website, so he will build this functionality into the site. We will rely on Adrian to give us recommendations for the database we will use to support the site.
Resource Requirements
Mad Keen Motors will hire the services of a consultant, Adrian Monkey, to build the website. Both the back end and the front end will be outsourced. The contents of the Website will be developed by the company owners, who between them have over 60 years of automobile repair experience, and the secretary who has excellent writing skills.
Future Development
Future development will be assessed after the website has been launched and user tested. It is hoped that the site will be popular enough to include an area for online repair bookings.
Management Summary
Mad Keen Motors is a family business, in which each employed family member oversees the area of operations best suited to his or her talents.
- Mark Keen is in charge of marketing and advertising, and non-mechanic employee training and personnel issues. Mark will oversee the company’s new website
- Barry Keen is head mechanic, and supervises all the mechanics working for Mad Keen Motors.
- Elisabeth Keen oversees the financial aspects of the business, including billing, accounting, and taxes.
In weekly meetings, these managers follow up on planned goals and deadlines and plan for the ongoing operations of the business.
7.1 Personnel Plan
Mad Keen employees ten full-time mechanics, as well as eight other full-time workers who serve as receptionists, car wash and valet attendants, and salespeople.
| Personnel Plan | |||
| FY 2006 | FY 2007 | FY 2008 | |
| Mark Keen, Co-Owner | £24,000 | £20,000 | £20,000 |
| Barry Keen, Co-Owner | £18,000 | £20,000 | £20,000 |
| Mechanics | £240,000 | £242,000 | £243,000 |
| Other Staff | £102,000 | £103,000 | £104,000 |
| Elisabeth Keen, Admin | £18,000 | £20,000 | £20,000 |
| Total People | 17 | 17 | 19 |
| Total Payroll | £402,000 | £405,000 | £407,000 |
Financial Plan
Website Expenses and Costs:
We expect to spend £6,200 over the next year on developing and then maintaining the website, with regular updates. We project another £6,200 will be needed for the same areas over the following two years.
In addition, we will have a slightly lower price/cost spread for website-related sales, once online coupons and other discounts are included. These have been factored in to the cost of sales. We will track this amount with a special record for “website coupons” in our sales and customer database.
Website Revenues:
We anticipate an additional £18,360 of sales in the next year directly related to the development of the website. This is based on reports from other locally focused service businesses which implemented websites to enhance visibility and promote sales through online discounts.
8.2 Break-even Analysis
The following table and chart show our break-even analysis with the website in place.

| Break-even Analysis | |
| Monthly Revenue Break-even | £40,547 |
| Assumptions: | |
| Average Percent Variable Cost | 4% |
| Estimated Monthly Fixed Cost | £38,925 |
8.3 Projected Profit and Loss
This table outlines additions to the standard operating expenses for developing and maintaining the website. Detailed monthly numbers can be found in the appendix.


| Pro Forma Profit and Loss | |||
| FY 2006 | FY 2007 | FY 2008 | |
| Sales | £822,360 | £843,080 | £871,482 |
| Direct Cost of Sales | £32,894 | £33,723 | £34,859 |
| Other Costs of Sales | £0 | £0 | £0 |
| Total Cost of Sales | £32,894 | £33,723 | £34,859 |
| Gross Margin | £789,466 | £809,357 | £836,622 |
| Gross Margin % | 96.00% | 96.00% | 96.00% |
| Expenses | |||
| Payroll | £402,000 | £405,000 | £407,000 |
| Other Expense Account Name | £0 | £0 | £0 |
| Depreciation | £4,800 | £4,800 | £4,800 |
| Standard Operating Expenses | £0 | £190,000 | £196,000 |
| Website Infrastructure | £0 | £0 | £0 |
| Website Development | £0 | £0 | £0 |
| Website Maintenance | £0 | £1,500 | £1,500 |
| Expensed Equipment | £0 | £2,000 | £1,200 |
| Payroll Taxes (National Insurance, etc.) | £60,300 | £60,750 | £61,050 |
| Other | £0 | £0 | £0 |
| Total Operating Expenses | £467,100 | £470,550 | £472,850 |
| Profit Before Interest and Taxes | £322,366 | £338,807 | £363,772 |
| EBITDA | £327,166 | £343,607 | £368,572 |
| Interest Expense | £74,800 | £73,600 | £71,200 |
| Taxes Incurred | £74,270 | £79,562 | £87,772 |
| Net Profit | £173,296 | £185,645 | £204,801 |
| Net Profit/Sales | 21.07% | 22.02% | 23.50% |
8.4 Projected Cash Flow
Mad Keen Motors is in a strong cash position right now, and can afford the relatively small expenses to start up the website. The following table and chart show our projected cash flow and cash balance.

| Pro Forma Cash Flow | |||
| FY 2006 | FY 2007 | FY 2008 | |
| Cash Received | |||
| Cash from Operations | |||
| Cash Sales | £822,360 | £843,080 | £871,482 |
| Subtotal Cash from Operations | £822,360 | £843,080 | £871,482 |
| Additional Cash Received | |||
| Sales Tax, VAT, HST/GST Received | £0 | £0 | £0 |
| New Current Borrowing | £0 | £0 | £0 |
| New Other Liabilities (interest-free) | £0 | £0 | £0 |
| New Long-term Liabilities | £0 | £0 | £0 |
| Sales of Other Current Assets | £0 | £0 | £0 |
| Sales of Long-term Assets | £0 | £0 | £0 |
| New Investment Received | £0 | £0 | £0 |
| Subtotal Cash Received | £822,360 | £843,080 | £871,482 |
| Expenditures | FY 2006 | FY 2007 | FY 2008 |
| Expenditures from Operations | |||
| Cash Spending | £402,000 | £405,000 | £407,000 |
| Bill Payments | £233,402 | £246,915 | £254,378 |
| Subtotal Spent on Operations | £635,402 | £651,915 | £661,378 |
| Additional Cash Spent | |||
| Sales Tax, VAT, HST/GST Paid Out | £0 | £0 | £0 |
| Principal Repayment of Current Borrowing | £0 | £0 | £0 |
| Other Liabilities Principal Repayment | £0 | £0 | £0 |
| Long-term Liabilities Principal Repayment | £2,000 | £24,000 | £24,000 |
| Purchase Other Current Assets | £0 | £0 | £0 |
| Purchase Long-term Assets | £0 | £0 | £0 |
| Dividends | £0 | £0 | £0 |
| Subtotal Cash Spent | £637,402 | £675,915 | £685,378 |
| Net Cash Flow | £184,958 | £167,165 | £186,103 |
| Cash Balance | £388,446 | £555,611 | £741,714 |
Brought to you by
Create a professional business plan
Using AI and step-by-step instructions
Create Your PlanSecure funding
Validate ideas
Build a strategy
8.5 Projected Balance Sheet
Our Net Worth will continue to grow as we pay off the mortgage for the two newest Mad Keen Motors locations.
| Pro Forma Balance Sheet | |||
| FY 2006 | FY 2007 | FY 2008 | |
| Assets | |||
| Current Assets | |||
| Cash | £388,446 | £555,611 | £741,714 |
| Inventory | £2,748 | £2,817 | £2,912 |
| Other Current Assets | £70,000 | £70,000 | £70,000 |
| Total Current Assets | £461,194 | £628,428 | £814,626 |
| Long-term Assets | |||
| Long-term Assets | £1,250,000 | £1,250,000 | £1,250,000 |
| Accumulated Depreciation | £19,800 | £24,600 | £29,400 |
| Total Long-term Assets | £1,230,200 | £1,225,400 | £1,220,600 |
| Total Assets | £1,691,394 | £1,853,828 | £2,035,226 |
| Liabilities and Capital | FY 2006 | FY 2007 | FY 2008 |
| Current Liabilities | |||
| Accounts Payable | £19,570 | £20,359 | £20,957 |
| Current Borrowing | £0 | £0 | £0 |
| Other Current Liabilities | £0 | £0 | £0 |
| Subtotal Current Liabilities | £19,570 | £20,359 | £20,957 |
| Long-term Liabilities | £748,000 | £724,000 | £700,000 |
| Total Liabilities | £767,570 | £744,359 | £720,957 |
| Paid-in Capital | £400,000 | £400,000 | £400,000 |
| Retained Earnings | £350,528 | £523,824 | £709,469 |
| Earnings | £173,296 | £185,645 | £204,801 |
| Total Capital | £923,824 | £1,109,469 | £1,314,269 |
| Total Liabilities and Capital | £1,691,394 | £1,853,828 | £2,035,226 |
| Net Worth | £923,824 | £1,109,469 | £1,314,269 |
8.6 Business Ratios
The following table outlines some of the more important ratios from the General Automotive Repair Shop industry. The final column, Industry Profile, details specific ratios based on the industry.
| Ratio Analysis | ||||
| FY 2006 | FY 2007 | FY 2008 | Industry Profile | |
| Sales Growth | 3.05% | 2.52% | 3.37% | 5.37% |
| Percent of Total Assets | ||||
| Inventory | 0.16% | 0.15% | 0.14% | 8.50% |
| Other Current Assets | 4.14% | 3.78% | 3.44% | 24.67% |
| Total Current Assets | 27.27% | 33.90% | 40.03% | 45.07% |
| Long-term Assets | 72.73% | 66.10% | 59.97% | 54.93% |
| Total Assets | 100.00% | 100.00% | 100.00% | 100.00% |
| Current Liabilities | 1.16% | 1.10% | 1.03% | 22.43% |
| Long-term Liabilities | 44.22% | 39.05% | 34.39% | 26.48% |
| Total Liabilities | 45.38% | 40.15% | 35.42% | 48.91% |
| Net Worth | 54.62% | 59.85% | 64.58% | 51.09% |
| Percent of Sales | ||||
| Sales | 100.00% | 100.00% | 100.00% | 100.00% |
| Gross Margin | 96.00% | 96.00% | 96.00% | 100.00% |
| Selling, General & Administrative Expenses | 74.93% | 73.98% | 72.50% | 71.18% |
| Advertising Expenses | 0.00% | 0.00% | 0.00% | 1.75% |
| Profit Before Interest and Taxes | 39.20% | 40.19% | 41.74% | 2.37% |
| Main Ratios | ||||
| Current | 23.57 | 30.87 | 38.87 | 1.48 |
| Quick | 23.43 | 30.73 | 38.73 | 0.91 |
| Total Debt to Total Assets | 45.38% | 40.15% | 35.42% | 54.67% |
| Pre-tax Return on Net Worth | 26.80% | 23.90% | 22.26% | 3.63% |
| Pre-tax Return on Assets | 14.64% | 14.31% | 14.38% | 8.00% |
| Additional Ratios | FY 2006 | FY 2007 | FY 2008 | |
| Net Profit Margin | 21.07% | 22.02% | 23.50% | n.a |
| Return on Equity | 18.76% | 16.73% | 15.58% | n.a |
| Activity Ratios | ||||
| Inventory Turnover | 8.86 | 12.12 | 12.17 | n.a |
| Accounts Payable Turnover | 11.90 | 12.17 | 12.17 | n.a |
| Payment Days | 30 | 29 | 30 | n.a |
| Total Asset Turnover | 0.49 | 0.45 | 0.43 | n.a |
| Debt Ratios | ||||
| Debt to Net Worth | 0.83 | 0.67 | 0.55 | n.a |
| Current Liab. to Liab. | 0.03 | 0.03 | 0.03 | n.a |
| Liquidity Ratios | ||||
| Net Working Capital | £441,624 | £608,069 | £793,669 | n.a |
| Interest Coverage | 4.31 | 4.60 | 5.11 | n.a |
| Additional Ratios | ||||
| Assets to Sales | 2.06 | 2.20 | 2.34 | n.a |
| Current Debt/Total Assets | 1% | 1% | 1% | n.a |
| Acid Test | 23.43 | 30.73 | 38.73 | n.a |
| Sales/Net Worth | 0.89 | 0.76 | 0.66 | n.a |
| Dividend Payout | 0.00 | 0.00 | 0.00 | n.a |
8.7 Financial Risks and Contingencies-2
Risks and Assumptions
The key risk with this website for Mad Keen Motors is that people will get information on their cars from other places. Since it is not typical for small garages to have this much content on their sites, Backwater Downs locals may not think to search for car and garage information on the Web. As cars and components become more specialized and car owners may tend to trust dealerships more, they will be less likely to use their local garage. This is a risk to the business as a whole, though we hope that the website will help to reduce Mad Keen Motors’ exposure to this risk.
If the site is not supported properly and people do not get quick answers to their questions, they may assume that service from the garage itself is lacking too. Therefore, emails must be answered promptly, the site must be updated regularly and the garage workers should also be aware of information and features on the website, and be educated about it when they speak to customers.
Contingency Plan
Since there will be minimal integration between the website and Mad Keen Motors’ core business, a contingency plan is not a huge concern. If use of the site falls well below forecasted levels and it proves not to be cost effective to continue the site in its current format, the site will be changed to essentially a business card site, where people can get information about the garage, location, hours, ownership information, etc.
Appendix
| Sales Forecast | |||||||||||||
| Feb | Mar | Apr | May | Jun | Jul | Aug | Sep | Oct | Nov | Dec | Jan | ||
| Sales | |||||||||||||
| Revenue from all Standard Streams | £67,000 | £67,000 | £67,000 | £67,000 | £67,000 | £67,000 | £67,000 | £67,000 | £67,000 | £67,000 | £67,000 | £67,000 | |
| Increased Sales through website | £660 | £1,000 | £1,400 | £1,700 | £1,350 | £1,350 | £1,350 | £1,700 | £2,050 | £2,400 | £1,700 | £1,700 | |
| Other | £0 | £0 | £0 | £0 | £0 | £0 | £0 | £0 | £0 | £0 | £0 | £0 | |
| Total Sales | £67,660 | £68,000 | £68,400 | £68,700 | £68,350 | £68,350 | £68,350 | £68,700 | £69,050 | £69,400 | £68,700 | £68,700 | |
| Direct Cost of Sales | Feb | Mar | Apr | May | Jun | Jul | Aug | Sep | Oct | Nov | Dec | Jan | |
| Direct Costs | £2,706 | £2,720 | £2,736 | £2,748 | £2,734 | £2,734 | £2,734 | £2,748 | £2,762 | £2,776 | £2,748 | £2,748 | |
| Other | £0 | £0 | £0 | £0 | £0 | £0 | £0 | £0 | £0 | £0 | £0 | £0 | |
| Subtotal Direct Cost of Sales | £2,706 | £2,720 | £2,736 | £2,748 | £2,734 | £2,734 | £2,734 | £2,748 | £2,762 | £2,776 | £2,748 | £2,748 | |
| Personnel Plan | |||||||||||||
| Feb | Mar | Apr | May | Jun | Jul | Aug | Sep | Oct | Nov | Dec | Jan | ||
| Mark Keen, Co-Owner | 0% | £2,000 | £2,000 | £2,000 | £2,000 | £2,000 | £2,000 | £2,000 | £2,000 | £2,000 | £2,000 | £2,000 | £2,000 |
| Barry Keen, Co-Owner | 0% | £1,500 | £1,500 | £1,500 | £1,500 | £1,500 | £1,500 | £1,500 | £1,500 | £1,500 | £1,500 | £1,500 | £1,500 |
| Mechanics | 0% | £20,000 | £20,000 | £20,000 | £20,000 | £20,000 | £20,000 | £20,000 | £20,000 | £20,000 | £20,000 | £20,000 | £20,000 |
| Other Staff | 0% | £8,500 | £8,500 | £8,500 | £8,500 | £8,500 | £8,500 | £8,500 | £8,500 | £8,500 | £8,500 | £8,500 | £8,500 |
| Elisabeth Keen, Admin | 0% | £1,500 | £1,500 | £1,500 | £1,500 | £1,500 | £1,500 | £1,500 | £1,500 | £1,500 | £1,500 | £1,500 | £1,500 |
| Total People | 17 | 17 | 17 | 17 | 17 | 17 | 17 | 17 | 17 | 17 | 17 | 17 | |
| Total Payroll | £33,500 | £33,500 | £33,500 | £33,500 | £33,500 | £33,500 | £33,500 | £33,500 | £33,500 | £33,500 | £33,500 | £33,500 | |
| Pro Forma Profit and Loss | |||||||||||||
| Feb | Mar | Apr | May | Jun | Jul | Aug | Sep | Oct | Nov | Dec | Jan | ||
| Sales | £67,660 | £68,000 | £68,400 | £68,700 | £68,350 | £68,350 | £68,350 | £68,700 | £69,050 | £69,400 | £68,700 | £68,700 | |
| Direct Cost of Sales | £2,706 | £2,720 | £2,736 | £2,748 | £2,734 | £2,734 | £2,734 | £2,748 | £2,762 | £2,776 | £2,748 | £2,748 | |
| Other Costs of Sales | £0 | £0 | £0 | £0 | £0 | £0 | £0 | £0 | £0 | £0 | £0 | £0 | |
| Total Cost of Sales | £2,706 | £2,720 | £2,736 | £2,748 | £2,734 | £2,734 | £2,734 | £2,748 | £2,762 | £2,776 | £2,748 | £2,748 | |
| Gross Margin | £64,954 | £65,280 | £65,664 | £65,952 | £65,616 | £65,616 | £65,616 | £65,952 | £66,288 | £66,624 | £65,952 | £65,952 | |
| Gross Margin % | 96.00% | 96.00% | 96.00% | 96.00% | 96.00% | 96.00% | 96.00% | 96.00% | 96.00% | 96.00% | 96.00% | 96.00% | |
| Expenses | |||||||||||||
| Payroll | £33,500 | £33,500 | £33,500 | £33,500 | £33,500 | £33,500 | £33,500 | £33,500 | £33,500 | £33,500 | £33,500 | £33,500 | |
| Other Expense Account Name | £0 | £0 | £0 | £0 | £0 | £0 | £0 | £0 | £0 | £0 | £0 | £0 | |
| Depreciation | £400 | £400 | £400 | £400 | £400 | £400 | £400 | £400 | £400 | £400 | £400 | £400 | |
| Standard Operating Expenses | £15,000 | £15,000 | £15,000 | £15,000 | £15,000 | £15,000 | £15,000 | £15,000 | £15,000 | £15,000 | £15,000 | £15,000 | |
| Website Infrastructure | £0 | £0 | £0 | £350 | £350 | £350 | £0 | £0 | £0 | £0 | £0 | £0 | |
| Website Development | £600 | £600 | £600 | £0 | £0 | £0 | £0 | £0 | £0 | £0 | £0 | £0 | |
| Website Maintenance | £0 | £0 | £0 | £150 | £150 | £150 | £150 | £150 | £150 | £150 | £150 | £150 | |
| Expensed Equipment | £2,000 | £0 | £0 | £0 | £0 | £0 | £0 | £0 | £0 | £0 | £0 | £0 | |
| Payroll Taxes (National Insurance, etc.) | 15% | £5,025 | £5,025 | £5,025 | £5,025 | £5,025 | £5,025 | £5,025 | £5,025 | £5,025 | £5,025 | £5,025 | £5,025 |
| Other | £0 | £0 | £0 | £0 | £0 | £0 | £0 | £0 | £0 | £0 | £0 | £0 | |
| Total Operating Expenses | £38,925 | £38,925 | £38,925 | £38,925 | £38,925 | £38,925 | £38,925 | £38,925 | £38,925 | £38,925 | £38,925 | £38,925 | |
| Profit Before Interest and Taxes | £26,029 | £26,355 | £26,739 | £27,027 | £26,691 | £26,691 | £26,691 | £27,027 | £27,363 | £27,699 | £27,027 | £27,027 | |
| EBITDA | £26,429 | £26,755 | £27,139 | £27,427 | £27,091 | £27,091 | £27,091 | £27,427 | £27,763 | £28,099 | £27,427 | £27,427 | |
| Interest Expense | £6,233 | £6,233 | £6,233 | £6,233 | £6,233 | £6,233 | £6,233 | £6,233 | £6,233 | £6,233 | £6,233 | £6,233 | |
| Taxes Incurred | £5,939 | £6,037 | £6,152 | £6,238 | £6,137 | £6,137 | £6,137 | £6,238 | £6,339 | £6,440 | £6,238 | £6,238 | |
| Net Profit | £13,857 | £14,085 | £14,354 | £14,556 | £14,320 | £14,320 | £14,320 | £14,556 | £14,791 | £15,026 | £14,556 | £14,556 | |
| Net Profit/Sales | 20.48% | 20.71% | 20.99% | 21.19% | 20.95% | 20.95% | 20.95% | 21.19% | 21.42% | 21.65% | 21.19% | 21.19% | |
| Pro Forma Cash Flow | |||||||||||||
| Feb | Mar | Apr | May | Jun | Jul | Aug | Sep | Oct | Nov | Dec | Jan | ||
| Cash Received | |||||||||||||
| Cash from Operations | |||||||||||||
| Cash Sales | £67,660 | £68,000 | £68,400 | £68,700 | £68,350 | £68,350 | £68,350 | £68,700 | £69,050 | £69,400 | £68,700 | £68,700 | |
| Subtotal Cash from Operations | £67,660 | £68,000 | £68,400 | £68,700 | £68,350 | £68,350 | £68,350 | £68,700 | £69,050 | £69,400 | £68,700 | £68,700 | |
| Additional Cash Received | |||||||||||||
| Sales Tax, VAT, HST/GST Received | 0.00% | £0 | £0 | £0 | £0 | £0 | £0 | £0 | £0 | £0 | £0 | £0 | £0 |
| New Current Borrowing | £0 | £0 | £0 | £0 | £0 | £0 | £0 | £0 | £0 | £0 | £0 | £0 | |
| New Other Liabilities (interest-free) | £0 | £0 | £0 | £0 | £0 | £0 | £0 | £0 | £0 | £0 | £0 | £0 | |
| New Long-term Liabilities | £0 | £0 | £0 | £0 | £0 | £0 | £0 | £0 | £0 | £0 | £0 | £0 | |
| Sales of Other Current Assets | £0 | £0 | £0 | £0 | £0 | £0 | £0 | £0 | £0 | £0 | £0 | £0 | |
| Sales of Long-term Assets | £0 | £0 | £0 | £0 | £0 | £0 | £0 | £0 | £0 | £0 | £0 | £0 | |
| New Investment Received | £0 | £0 | £0 | £0 | £0 | £0 | £0 | £0 | £0 | £0 | £0 | £0 | |
| Subtotal Cash Received | £67,660 | £68,000 | £68,400 | £68,700 | £68,350 | £68,350 | £68,350 | £68,700 | £69,050 | £69,400 | £68,700 | £68,700 | |
| Expenditures | Feb | Mar | Apr | May | Jun | Jul | Aug | Sep | Oct | Nov | Dec | Jan | |
| Expenditures from Operations | |||||||||||||
| Cash Spending | £33,500 | £33,500 | £33,500 | £33,500 | £33,500 | £33,500 | £33,500 | £33,500 | £33,500 | £33,500 | £33,500 | £33,500 | |
| Bill Payments | £20,573 | £17,200 | £17,299 | £17,467 | £19,148 | £20,116 | £20,130 | £20,134 | £20,262 | £20,377 | £20,479 | £20,217 | |
| Subtotal Spent on Operations | £54,073 | £50,700 | £50,799 | £50,967 | £52,648 | £53,616 | £53,630 | £53,634 | £53,762 | £53,877 | £53,979 | £53,717 | |
| Additional Cash Spent | |||||||||||||
| Sales Tax, VAT, HST/GST Paid Out | £0 | £0 | £0 | £0 | £0 | £0 | £0 | £0 | £0 | £0 | £0 | £0 | |
| Principal Repayment of Current Borrowing | £0 | £0 | £0 | £0 | £0 | £0 | £0 | £0 | £0 | £0 | £0 | £0 | |
| Other Liabilities Principal Repayment | £0 | £0 | £0 | £0 | £0 | £0 | £0 | £0 | £0 | £0 | £0 | £0 | |
| Long-term Liabilities Principal Repayment | £2,000 | £0 | £0 | £0 | £0 | £0 | £0 | £0 | £0 | £0 | £0 | £0 | |
| Purchase Other Current Assets | £0 | £0 | £0 | £0 | £0 | £0 | £0 | £0 | £0 | £0 | £0 | £0 | |
| Purchase Long-term Assets | £0 | £0 | £0 | £0 | £0 | £0 | £0 | £0 | £0 | £0 | £0 | £0 | |
| Dividends | £0 | £0 | £0 | £0 | £0 | £0 | £0 | £0 | £0 | £0 | £0 | £0 | |
| Subtotal Cash Spent | £56,073 | £50,700 | £50,799 | £50,967 | £52,648 | £53,616 | £53,630 | £53,634 | £53,762 | £53,877 | £53,979 | £53,717 | |
| Net Cash Flow | £11,587 | £17,300 | £17,601 | £17,733 | £15,702 | £14,734 | £14,720 | £15,066 | £15,288 | £15,523 | £14,721 | £14,983 | |
| Cash Balance | £215,075 | £232,375 | £249,976 | £267,709 | £283,411 | £298,145 | £312,865 | £327,931 | £343,219 | £358,742 | £373,463 | £388,446 | |
| Pro Forma Balance Sheet | |||||||||||||
| Feb | Mar | Apr | May | Jun | Jul | Aug | Sep | Oct | Nov | Dec | Jan | ||
| Assets | Starting Balances | ||||||||||||
| Current Assets | |||||||||||||
| Cash | £203,488 | £215,075 | £232,375 | £249,976 | £267,709 | £283,411 | £298,145 | £312,865 | £327,931 | £343,219 | £358,742 | £373,463 | £388,446 |
| Inventory | £12,040 | £9,334 | £6,614 | £3,878 | £2,748 | £2,734 | £2,734 | £2,734 | £2,748 | £2,762 | £2,776 | £2,748 | £2,748 |
| Other Current Assets | £70,000 | £70,000 | £70,000 | £70,000 | £70,000 | £70,000 | £70,000 | £70,000 | £70,000 | £70,000 | £70,000 | £70,000 | £70,000 |
| Total Current Assets | £285,528 | £294,408 | £308,988 | £323,854 | £340,457 | £356,145 | £370,879 | £385,599 | £400,679 | £415,981 | £431,518 | £446,211 | £461,194 |
| Long-term Assets | |||||||||||||
| Long-term Assets | £1,250,000 | £1,250,000 | £1,250,000 | £1,250,000 | £1,250,000 | £1,250,000 | £1,250,000 | £1,250,000 | £1,250,000 | £1,250,000 | £1,250,000 | £1,250,000 | £1,250,000 |
| Accumulated Depreciation | £15,000 | £15,400 | £15,800 | £16,200 | £16,600 | £17,000 | £17,400 | £17,800 | £18,200 | £18,600 | £19,000 | £19,400 | £19,800 |
| Total Long-term Assets | £1,235,000 | £1,234,600 | £1,234,200 | £1,233,800 | £1,233,400 | £1,233,000 | £1,232,600 | £1,232,200 | £1,231,800 | £1,231,400 | £1,231,000 | £1,230,600 | £1,230,200 |
| Total Assets | £1,520,528 | £1,529,008 | £1,543,188 | £1,557,654 | £1,573,857 | £1,589,145 | £1,603,479 | £1,617,799 | £1,632,479 | £1,647,381 | £1,662,518 | £1,676,811 | £1,691,394 |
| Liabilities and Capital | Feb | Mar | Apr | May | Jun | Jul | Aug | Sep | Oct | Nov | Dec | Jan | |
| Current Liabilities | |||||||||||||
| Accounts Payable | £20,000 | £16,624 | £16,718 | £16,830 | £18,478 | £19,445 | £19,459 | £19,459 | £19,583 | £19,694 | £19,805 | £19,543 | £19,570 |
| Current Borrowing | £0 | £0 | £0 | £0 | £0 | £0 | £0 | £0 | £0 | £0 | £0 | £0 | £0 |
| Other Current Liabilities | £0 | £0 | £0 | £0 | £0 | £0 | £0 | £0 | £0 | £0 | £0 | £0 | £0 |
| Subtotal Current Liabilities | £20,000 | £16,624 | £16,718 | £16,830 | £18,478 | £19,445 | £19,459 | £19,459 | £19,583 | £19,694 | £19,805 | £19,543 | £19,570 |
| Long-term Liabilities | £750,000 | £748,000 | £748,000 | £748,000 | £748,000 | £748,000 | £748,000 | £748,000 | £748,000 | £748,000 | £748,000 | £748,000 | £748,000 |
| Total Liabilities | £770,000 | £764,624 | £764,718 | £764,830 | £766,478 | £767,445 | £767,459 | £767,459 | £767,583 | £767,694 | £767,805 | £767,543 | £767,570 |
| Paid-in Capital | £400,000 | £400,000 | £400,000 | £400,000 | £400,000 | £400,000 | £400,000 | £400,000 | £400,000 | £400,000 | £400,000 | £400,000 | £400,000 |
| Retained Earnings | £314,488 | £350,528 | £350,528 | £350,528 | £350,528 | £350,528 | £350,528 | £350,528 | £350,528 | £350,528 | £350,528 | £350,528 | £350,528 |
| Earnings | £36,040 | £13,857 | £27,942 | £42,296 | £56,851 | £71,172 | £85,492 | £99,812 | £114,368 | £129,159 | £144,185 | £158,740 | £173,296 |
| Total Capital | £750,528 | £764,385 | £778,470 | £792,824 | £807,379 | £821,700 | £836,020 | £850,340 | £864,896 | £879,687 | £894,713 | £909,268 | £923,824 |
| Total Liabilities and Capital | £1,520,528 | £1,529,008 | £1,543,188 | £1,557,654 | £1,573,857 | £1,589,145 | £1,603,479 | £1,617,799 | £1,632,479 | £1,647,381 | £1,662,518 | £1,676,811 | £1,691,394 |
| Net Worth | £750,528 | £764,385 | £778,470 | £792,824 | £807,379 | £821,700 | £836,020 | £850,340 | £864,896 | £879,687 | £894,713 | £909,268 | £923,824 |


