
Marrowstone Advertising
Executive Summary
Introduction
It is the mission of Marrowstone Advertising Consultants to provide comprehensive marketing consultation and creation of advertising campaigns for the nonprofit industry. It is our long-term goal to become THE preferred advertising agency for nonprofit institutions nationwide. Our firm is not interested in simply producing a service for our clients. We believe in creating a long-term relationship with them so that the delivery of their message becomes a seemless, thought-provoking experience that engenders action.
The Company
Marrowstone Advertising Consultants will be a limited liability partnership registered in the state of Delaware for tax purposes. Its founder is Mr. Curtiss Cole, a former marketing executive with the Boy Scouts of America. Mr. Cole has brought together a highly respected group of marketing, development, and graphic art specialists who, combined, have a total of 35 years of experience with nonprofit organizations.
The company has a limited number of private investors and does not plan to go public. The company has its main offices in Reston, Virginia. The facilities include a design lab, conference rooms and office spaces. The company expects to begin offering its services in January.
The Services
The firm offers a complete, custom advertising campaign that covers all audio-visual and printed media. Examples include radio and television ads, billboards, building advertisements, brochures, direct mailing, business cards, etc. Management has designed a proven and effective seven step process to building a winning campaign.
The company’s main clients will be small and start-up nonprofit institutions and local governments. By focusing on institutions such as these that have special needs, we believe we will be able to better serve our clients and produce a superior service that is more effective that other advertising firms.
The Market
Marrowstone Advertising Consultants will be concentrating on three main types of nonprofits who operate in the environmental, youth development, and cultural awareness fields. This is because these types of organizations have the greatest needs and/or are the best capitalized in the nonprofit industry.
Profitability and growth in this untapped market is expected to be strong, as evidenced by the fact that over the past 15 years the U.S. has seen an explosion of nonprofits in new fields such as environmental awareness. Furthermore with the greater capitalization of such agencies, we are seeing a widening gap between these organizations needs and what conventional advertising companies can provide.
Financial Considerations
Start-up assets required are $122,300, which includes cash needed to support operations until revenues reach an acceptable level. Start-up expenses are $31,700. Most of the company’s liabilities will come from outside private investors and management investment, however, we have obtained $16,000 in current borrowing from Bank of America Commercial Investments, the principal to be paid off in two years. A long-term loan of $45,000 through Charter Bank of Richmond will be paid off in ten years.
The company expects to reach profitability in Year 2 and does not anticipate any serious cash flow problems. We conservatively believe that during the first three years, about three projects per month will guarantee a break-even point.

1.1 Objectives
The three year goals for Marrowstone Advertising are the following:
- Achieve break-even by Year 2.
- Establish a long-term contract with The Nature Conservancy.
- Establish a minimum of 95% customer satisfaction rate to establish long-term relationships with our clients and create word-of-mouth marketing.
1.2 Keys to Success
Marrowstone Advertising’s keys to long-term survivability and profitability are as follows:
- Differentiate our services to nonprofits so that our clients realize that we are able to better serve their needs than a more generic competitor.
- Keeping close contact with clients and establishing a well functioning long-term relationship with them to generate repeat business and a top notch reputation.
- Establish a comprehensive service experience for our clients that includes consultation, analysis of nonprofit’s goals and target markets. Creation of streamlined and custom advertising campaigns based on needs, total design work of all audio-visual advertising tools, implementation, and follow-up analysis.
1.3 Mission
It is the mission of Marrowstone Advertising Consultants to provide comprehensive marketing consultation and creation of advertising campaigns for the nonprofit industry. Our firm is not interested in simply producing a service for our clients. We believe in creating a long-term relationship with them so that the delivery of their message becomes a seemless, thought-provoking experience that engenders action. Marrowstone understands that nonprofit groups and institutions have special needs in delivering their information and messages to the public and creating inspiration to act on these messages.
Company Summary
Marrowstone Advertising Consultants will be a limited liability partnership registered in the state of Delaware for tax purposes. Its founder is Mr. Curtiss Cole, a former marketing executive with the Boy Scouts of America. Mr. Cole has brought together a highly respected group of marketing, development, and graphic art specialists who, combined, have a total of 35 years of experience with nonprofit organizations.
The company has a limited number of private investors and does not plan to go public. The company has its main offices in Reston, Virginia. The facilities include a design lab, conference rooms and office spaces. The company expects to begin offering its services in January.
The company’s main clients will be small and start-up nonprofit institutions and local governments. By focusing on institutions such as these that have special needs, we believe we will be able to better serve our clients and produce a superior service that is more effective that other advertising firms.
2.1 Start-up Summary
Start-up assets required are $122,300, which includes cash needed to support operations until revenues reach an acceptable level. Start-up expenses are $31,700. Most of the company’s liabilities will come from outside private investors and management investment, however, we have obtained $16,000 in current borrowing from Bank of America Commercial Investments, the principal to be paid off in two years. A long-term loan of $45,000 through Charter Bank of Richmond will be paid off in ten years.

| Start-up | |
| Requirements | |
| Start-up Expenses | |
| Legal | $2,000 |
| Insurance | $1,000 |
| Utilities | $200 |
| Rent | $2,000 |
| Accounting and bookkeeping fees | $2,000 |
| Expensed equipment | $10,000 |
| Advertising | $6,500 |
| Other | $8,000 |
| Total Start-up Expenses | $31,700 |
| Start-up Assets | |
| Cash Required | $117,300 |
| Other Current Assets | $5,000 |
| Long-term Assets | $10,000 |
| Total Assets | $132,300 |
| Total Requirements | $164,000 |
| Start-up Funding | |
| Start-up Expenses to Fund | $31,700 |
| Start-up Assets to Fund | $132,300 |
| Total Funding Required | $164,000 |
| Assets | |
| Non-cash Assets from Start-up | $15,000 |
| Cash Requirements from Start-up | $117,300 |
| Additional Cash Raised | $0 |
| Cash Balance on Starting Date | $117,300 |
| Total Assets | $132,300 |
| Liabilities and Capital | |
| Liabilities | |
| Current Borrowing | $16,000 |
| Long-term Liabilities | $45,000 |
| Accounts Payable (Outstanding Bills) | $3,000 |
| Other Current Liabilities (interest-free) | $0 |
| Total Liabilities | $64,000 |
| Capital | |
| Planned Investment | |
| Mr. Curtis Cole | $25,000 |
| Ms. Jennie Marks | $20,000 |
| Mr. David Danielson | $20,000 |
| Mr. Milo Winn | $8,000 |
| Others | $27,000 |
| Additional Investment Requirement | $0 |
| Total Planned Investment | $100,000 |
| Loss at Start-up (Start-up Expenses) | ($31,700) |
| Total Capital | $68,300 |
| Total Capital and Liabilities | $132,300 |
| Total Funding | $164,000 |
2.2 Company Ownership
The company will have a number of outside private investors who will own 27% of the company’s shares. The rest will be owned by the senior management including Mr. Curtis Cole, (25%), Ms. Jennie Marks (20%), Mr. David Danielson, (20%), and Mr. Milo Winn (8%). All other financing will come from loans.
Services
Marrowstone Advertising Consultants offers a complete, custom advertising campaign that covers all audio-visual and printed media. Examples include radio and television ads, billboards, building advertisements, brochures, direct mailing, business cards, etc. Our proven and effective seven step process to building a winning campaign incudes the following:
- Initial consultation.
- Analysis of nonprofit’s goals and target market demographics.
- Planning.
- Creation of streamlined and custom advertising campaigns based on needs.
- Total design work of all audio-visual/printed advertising tools.
- Implementation (usually through subcontractors).
- Follow-up analysis.
Each project is customized to our client and its scope, length, depth, reach, and cost are unique.
Brought to you by
Create a professional business plan
Using AI and step-by-step instructions
Create Your PlanSecure funding
Validate ideas
Build a strategy
Market Analysis Summary
Marrowstone Advertising Consultants will be concentrating on three main types of nonprofits who operate in the environmental, youth development, and cultural awareness fields. This is because these types of organizations have the greatest needs and/or are the best capitalized in the nonprofit industry.
Profitability and growth in this little tapped market is expected to be strong, as evidenced by the fact that over the past 15 years the U.S. has seen an explosion of nonprofits in new fields such as environmental awareness. Furthermore with the greater capitalization of such agencies, we are seeing a widening gap between these organizations needs and what conventional advertising companies can provide.
An analysis of the market using the five forces of profitability indicates that there will be a short time where growth of market share and profitability will be extremely high while demand outstrips supply. As new entrants move into the market this opportunity will disappear. This is the time for Marrowstone to create its reputation and niche in the industry.
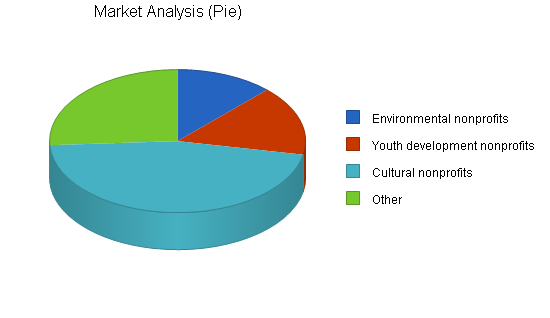
4.1 Market Segmentation
There are various nonprofit institutions nationwide that concentrate on various public issues. Marrowstone will be focusing on the following groups of clients:
- Environmental nonprofit institutions.
- Youth development nonprofit institutions.
- Cultural nonprofit institutions.
- Other.
We are concentrating on these specific market segments for a variety of reasons. The environmental segment which includes organizations such as the Sierra Club and the Nature Conservancy is the fastest growing segment at the moment, and Marrowstone’s management concludes that in the near future, they will also include some of the largest nonprofits in the nation. Youth development nonprofits such as the Boy Scouts, Camp Fire girls, 4-F, and The Boys and Girls Club includes some of the largest and most well capitalized nonprofit organizations in the country. Finally, although they tend to be small in size, there are a huge number of cultural nonprofits such as museums.
The market analysis table and graph which follows shows the number of each type of organization in the greater Washington D.C. area. This will be our initial geographical focus for the first three to four years of our company’s existance. Later, as we expand to a nationwide scope, our future business plans will include all our potential clients across the country.
| Market Analysis | |||||||
| Year 1 | Year 2 | Year 3 | Year 4 | Year 5 | |||
| Potential Customers | Growth | CAGR | |||||
| Environmental nonprofits | 8% | 34 | 37 | 40 | 43 | 46 | 7.85% |
| Youth development nonprofits | 4% | 44 | 46 | 48 | 50 | 52 | 4.26% |
| Cultural nonprofits | 4% | 128 | 133 | 138 | 144 | 150 | 4.04% |
| Other | 5% | 72 | 76 | 80 | 84 | 88 | 5.14% |
| Total | 4.85% | 278 | 292 | 306 | 321 | 336 | 4.85% |
4.2 Service Business Analysis
The advertising industry for nonprofits is at the moment, an unfulfilled market with demand greater than supply. Many nonprofit organizations have found that only the largest and most expensive advertising agencies will enter into contracts with nonprofits and this leaves a great void which must be filled by in-house advertising.
Marrowstone believes that the greatest threat at the moment is in new entrants to the market who will also perceive this opportunity. The most likely entrants will be pre-existing advertising agencies wishing to horizontally integrate and enter new sub-markets. However, the one major disadvantage to new entrants is that all firms engaged in contracting to advertising agencies face significant switching costs when bringing on a new advertising partner. Furthermore, Marrowstone understands that in this industry there is a significant learning curve that creates declining “unit” costs as a firm gains more cumulative experience in the field itself and with long-term clients specifically.
Rivalry among different advertising agencies as stated before is quite intense. The advertising market as a whole is mature with low growth. Most of the largest agencies are mutually dependent when it comes to jockeying for position and market share. The fact that there are so many diverse and seemingly “generic” or general advertising agencies makes this a cutthroat industry.
The threat of clients backwardly integrating so as to have all their advertising done in-house is one of the major factors that buyers use to indirectly control price in this industry, and increase competition among firms. This must always be foremost in the minds of Marrowstone’s management when offering services and setting prices.
4.2.1 Competition and Buying Patterns
Competition
Competition includes all potential advertising agencies that are willing to accept nonprofit contracts and nonprofit organizations that handle all their advertising in-house. Practically speaking, this means the largest advertising agencies such as Werner & Voss, Price, Waterhouse, & Cooper, and other large, nationwide agencies that hold significant market share. The advertising agency industry is highly fragmented, with a large number of small companies that mainly cater to small firms and a few large companies that seek the largest contracts from companies such as McDonald’s, GM, etc. This makes competition within the industry very intense. Through our niche strategy we intend to avoid such a debilitating environment and avoid its drawbacks such as price wars, etc.
Buying patterns and needs
Companies usually enter into contracts with advertising agencies based on their reputation of professionalism and effective campaigns in the past. This reputation is difficult to obtain by new advertising firms unless its personnel bring it with them from previous firms such as ours. Price and scope are also important reasons for accepting contracts, especially if the company is small.
nonprofit organizations have very different needs that other firms. Companies offering a product or service need to inform the public about the benefits of their product/service and then inspire them to purchase by leading them through an implicit or explicit cost-benefit analysis. On the other hand, nonprofits must appeal to a person’s higher sense of community duty in order to obtain contributions. Advertisements must be a thought-provoking experience that engenders action. This is a far more difficult task to achieve than ordinary marketing and usually requires more resources and time than product/service marketing. Many advertising agencies do not desire to accept these types of contracts and leave it to the nonprofit organizations to create their own marketing. This leads to higher costs, more emphasis on obtaining contributions, and less effective management of the organization’s goals.
Strategy and Implementation Summary
Marrowstone Advertising Consultants’ business strategy is to enter into a focused or niche market where it can offer a higher standard of quality to its specialized clients. This will allow us to charge a higher profit margin to our clients for these differentiated services. This will also require average project times to be somewhat longer, and therefore we expect initial profitability levels to be lower than average.
5.1 Marketing Strategy
In order to attract clients, Marrowstone will begin to contact promising organizations and offer free consultations, and an initial contract at reduced prices. These promotions will allow us to begin to make our reputation. In addition, Mr. Cole and Mrs. Marks will be traveling to six conventions across the Eastern part of the country during the first year of operations where we will have booths to advertise our services. Finally we will be setting up cold calls to potential clients and have half and full page advertisements in various publications catering to nonprofit organization’s needs.
5.2 Sales Strategy
Marrowstone’s management will be focusing on leveraging its extensive contacts in the nonprofit industry to generate contracts. In October of 2002 the Nature Conservancy announced it was accepting bids for a new long-term advertising contract. Marrowstone’s founder Mr. Curtis Cole has been aggressively pursuing this contact and based on recent events, it is likely that Marrowstone will win the bid, to be announced in February 2003. This will generate both much needed revenue, and if successful, will generate the reputation Marrowstone needs for further contracts. In addition, Mr. Danielson will be pursuing a number of other open-ended contracts through his contacts with youth organizations. At the current time, the Holson Foundation has entered into negotiations with Marrowstone for its disadvantaged youth drive. Finally, our company has bid with the city of Fredrick, Maryland to create a stop smoking campaign for its public offices.
Brought to you by
Create a professional business plan
Using AI and step-by-step instructions
Create Your PlanSecure funding
Validate ideas
Build a strategy
5.2.1 Sales Forecast
Sales are based on the various contract projects we anticipate acquiring in the various market segments. Revenues are based on average costs per project based on estimated time and complexity of project plus and undisclosed profit margin. The company does not have any significant direct costs of sales.

| Sales Forecast | |||
| Year 1 | Year 2 | Year 3 | |
| Sales | |||
| Environmental nonprofits | $93,000 | $145,000 | $224,000 |
| Youth development nonprofits | $33,000 | $56,000 | $98,000 |
| Cultural nonprofits | $69,000 | $110,000 | $93,000 |
| Other | $36,000 | $45,000 | $45,000 |
| Total Sales | $231,000 | $356,000 | $460,000 |
| Direct Cost of Sales | Year 1 | Year 2 | Year 3 |
| Row 1 | $0 | $0 | $0 |
| Other | $0 | $0 | $0 |
| Subtotal Direct Cost of Sales | $0 | $0 | $0 |
Management Summary
The company will have four officers including our president, Mr. Curtiss Cole. Our head of operations will be Mr. David Danielson, plus two advertising consultants, and a graphic artist. Mr. Winn will handle all of our audio-visual design work and he will eventually have a staff of graphic artists working under him. Finances and general admin will be handled by Mrs. Marks.
The company plans to hire additional advertising consultants, graphic artists and administrative personnel as we begin to get large numbers of contracts.
6.1 Personnel
Marrowstone’s management brings to the company strong capabilities in creative flair, research, and a unique combination of skills drawn from other businesses.
Mr. Curtis Cole is a former marketing executive with the Land Trust Alliance and has many years of experience working with nonprofits in the environmental field. Previous companies Mr. Cole has worked for include the Sierra Club and the Audubon Society. Mr. Cole has successfully launched numerous advertising and public awareness campaigns with these organizations including efforts to preserve the orca population in the Puget Sound region and to reduce the pollution levels in Denver, CO. Mr. Cole has an MBA in marketing and a BS in international relations.
Mr. David Danielson graduated from Penn State University with a bachelors degree in marketing in 1975. From 1978-1988 Mr. Danielson worked for Ford Motor Company as an advertising executive. In 1989 he went to work for Anderson Consulting in their marketing and advertising division. Four years later, Mr. Danielson went to work as the Boy Scouts of America’s chief marketing executive.
| Personnel Plan | |||
| Year 1 | Year 2 | Year 3 | |
| Mr. Curtis Cole- president | $36,000 | $36,000 | $60,000 |
| Mrs. Jennie Marks – CFO | $36,000 | $36,000 | $60,000 |
| Mr. David Danielson – projects manager | $36,000 | $36,000 | $45,000 |
| Mr. Milo Winn – audio-visual director | $36,000 | $36,000 | $36,000 |
| Advertising consultant | $36,000 | $36,000 | $36,000 |
| Advertising consultant | $0 | $36,000 | $36,000 |
| Graphic artist | $0 | $0 | $21,000 |
| Total People | 5 | 6 | 7 |
| Total Payroll | $180,000 | $216,000 | $294,000 |
Financial Plan
Our financial plan anticipates one year of negative profits as we gain sales volume. We have budgeted enough investment to cover these losses and have an additional credit line of $60,000 available if sales do not match predictions.
7.1 Important Assumptions
We are assuming approximately 75% sales on credit and average interest rates of 10%. These are considered to be conservative in case our predictions are erroneous.
| General Assumptions | |||
| Year 1 | Year 2 | Year 3 | |
| Plan Month | 1 | 2 | 3 |
| Current Interest Rate | 10.00% | 10.00% | 10.00% |
| Long-term Interest Rate | 10.00% | 10.00% | 10.00% |
| Tax Rate | 30.00% | 30.00% | 30.00% |
| Other | 0 | 0 | 0 |
7.2 Break-even Analysis
Our Break-even Analysis is based on the assumptions that our gross margin is 100%. In other words, we will have insignificant direct cost of sales. Since each project will be of different scope, length, and complexity, it is difficult to assign an average per unit revenue figure. However, it is conservatively believed that during the first three years, about three projects per month will guarantee a break-even point. This is because we will be dealing with smaller companies at first that have smaller projects.

| Break-even Analysis | |
| Monthly Revenue Break-even | $22,583 |
| Assumptions: | |
| Average Percent Variable Cost | 0% |
| Estimated Monthly Fixed Cost | $22,583 |
7.3 Projected Cash Flow
The following is our Cash Flow table and chart. We do not expect to have any short-term cash flow problems even though we will be operating at a loss for the first year. Our short-term loan of $16,000 will be repaid in two equal payments in 2004-2005. Our $45,000 long-term loan will be paid off in ten years.

| Pro Forma Cash Flow | |||
| Year 1 | Year 2 | Year 3 | |
| Cash Received | |||
| Cash from Operations | |||
| Cash Sales | $57,750 | $89,000 | $115,000 |
| Cash from Receivables | $121,425 | $238,956 | $321,668 |
| Subtotal Cash from Operations | $179,175 | $327,956 | $436,668 |
| Additional Cash Received | |||
| Sales Tax, VAT, HST/GST Received | $0 | $0 | $0 |
| New Current Borrowing | $5,000 | $0 | $0 |
| New Other Liabilities (interest-free) | $0 | $0 | $0 |
| New Long-term Liabilities | $0 | $0 | $0 |
| Sales of Other Current Assets | $0 | $0 | $0 |
| Sales of Long-term Assets | $0 | $0 | $0 |
| New Investment Received | $3,000 | $0 | $0 |
| Subtotal Cash Received | $187,175 | $327,956 | $436,668 |
| Expenditures | Year 1 | Year 2 | Year 3 |
| Expenditures from Operations | |||
| Cash Spending | $180,000 | $216,000 | $294,000 |
| Bill Payments | $95,653 | $116,295 | $131,741 |
| Subtotal Spent on Operations | $275,653 | $332,295 | $425,741 |
| Additional Cash Spent | |||
| Sales Tax, VAT, HST/GST Paid Out | $0 | $0 | $0 |
| Principal Repayment of Current Borrowing | $7,992 | $3,000 | $3,000 |
| Other Liabilities Principal Repayment | $0 | $0 | $0 |
| Long-term Liabilities Principal Repayment | $0 | $4,000 | $4,000 |
| Purchase Other Current Assets | $0 | $0 | $0 |
| Purchase Long-term Assets | $0 | $0 | $0 |
| Dividends | $0 | $0 | $0 |
| Subtotal Cash Spent | $283,645 | $339,295 | $432,741 |
| Net Cash Flow | ($96,470) | ($11,339) | $3,926 |
| Cash Balance | $20,830 | $9,491 | $13,418 |
7.4 Projected Profit and Loss
The following table itemizes our revenues and associated costs. We expect to be paying higher costs in marketing and advertising than other companies as we attempt to build sales volume. As the reader can see, we expect monthly profits to begin in August 2003 and yearly profits to occur in 2004. The charts following the table give a visual representation.


| Pro Forma Profit and Loss | |||
| Year 1 | Year 2 | Year 3 | |
| Sales | $231,000 | $356,000 | $460,000 |
| Direct Cost of Sales | $0 | $0 | $0 |
| Other Costs of Sales | $7,000 | $7,000 | $7,000 |
| Total Cost of Sales | $7,000 | $7,000 | $7,000 |
| Gross Margin | $224,000 | $349,000 | $453,000 |
| Gross Margin % | 96.97% | 98.03% | 98.48% |
| Expenses | |||
| Payroll | $180,000 | $216,000 | $294,000 |
| Sales and Marketing and Other Expenses | $12,000 | $24,000 | $24,000 |
| Depreciation | $2,000 | $2,000 | $2,000 |
| Rent | $12,000 | $12,000 | $13,000 |
| Utilities | $3,600 | $3,600 | $4,000 |
| Insurance | $3,000 | $3,000 | $3,000 |
| Payroll Taxes | $27,000 | $32,400 | $44,100 |
| Travel | $24,200 | $12,000 | $10,000 |
| Other | $7,200 | $8,000 | $10,000 |
| Total Operating Expenses | $271,000 | $313,000 | $404,100 |
| Profit Before Interest and Taxes | ($47,000) | $36,000 | $48,900 |
| EBITDA | ($45,000) | $38,000 | $50,900 |
| Interest Expense | $5,917 | $5,451 | $4,751 |
| Taxes Incurred | $0 | $9,165 | $13,245 |
| Net Profit | ($52,917) | $21,384 | $30,904 |
| Net Profit/Sales | -22.91% | 6.01% | 6.72% |
7.5 Projected Balance Sheet
The following table shows the Project Balance Sheet for Marrowstone Advertising.
| Pro Forma Balance Sheet | |||
| Year 1 | Year 2 | Year 3 | |
| Assets | |||
| Current Assets | |||
| Cash | $20,830 | $9,491 | $13,418 |
| Accounts Receivable | $51,825 | $79,869 | $103,201 |
| Other Current Assets | $5,000 | $5,000 | $5,000 |
| Total Current Assets | $77,655 | $94,360 | $121,619 |
| Long-term Assets | |||
| Long-term Assets | $10,000 | $10,000 | $10,000 |
| Accumulated Depreciation | $2,000 | $4,000 | $6,000 |
| Total Long-term Assets | $8,000 | $6,000 | $4,000 |
| Total Assets | $85,655 | $100,360 | $125,619 |
| Liabilities and Capital | Year 1 | Year 2 | Year 3 |
| Current Liabilities | |||
| Accounts Payable | $9,264 | $9,585 | $10,939 |
| Current Borrowing | $13,008 | $10,008 | $7,008 |
| Other Current Liabilities | $0 | $0 | $0 |
| Subtotal Current Liabilities | $22,272 | $19,593 | $17,947 |
| Long-term Liabilities | $45,000 | $41,000 | $37,000 |
| Total Liabilities | $67,272 | $60,593 | $54,947 |
| Paid-in Capital | $103,000 | $103,000 | $103,000 |
| Retained Earnings | ($31,700) | ($84,617) | ($63,233) |
| Earnings | ($52,917) | $21,384 | $30,904 |
| Total Capital | $18,383 | $39,767 | $70,672 |
| Total Liabilities and Capital | $85,655 | $100,360 | $125,619 |
| Net Worth | $18,383 | $39,767 | $70,672 |
7.6 Business Ratios
We have included industry standard ratios from the advertising consultant industry to compare with ours. As this is a new sub-market of the overall industry, we expect some significant differences especially in sales growth, financing ratios, long-term asset investments and net worth. However, our projections indicate a healthy company that will be able to obtain and retain long-term profitability.
| Ratio Analysis | ||||
| Year 1 | Year 2 | Year 3 | Industry Profile | |
| Sales Growth | 0.00% | 54.11% | 29.21% | 7.51% |
| Percent of Total Assets | ||||
| Accounts Receivable | 60.50% | 79.58% | 82.15% | 39.92% |
| Other Current Assets | 5.84% | 4.98% | 3.98% | 39.01% |
| Total Current Assets | 90.66% | 94.02% | 96.82% | 82.32% |
| Long-term Assets | 9.34% | 5.98% | 3.18% | 17.68% |
| Total Assets | 100.00% | 100.00% | 100.00% | 100.00% |
| Current Liabilities | 26.00% | 19.52% | 14.29% | 39.13% |
| Long-term Liabilities | 52.54% | 40.85% | 29.45% | 10.54% |
| Total Liabilities | 78.54% | 60.38% | 43.74% | 49.67% |
| Net Worth | 21.46% | 39.62% | 56.26% | 50.33% |
| Percent of Sales | ||||
| Sales | 100.00% | 100.00% | 100.00% | 100.00% |
| Gross Margin | 96.97% | 98.03% | 98.48% | 100.00% |
| Selling, General & Administrative Expenses | 119.88% | 92.03% | 91.76% | 84.13% |
| Advertising Expenses | 0.00% | 0.00% | 0.00% | 3.06% |
| Profit Before Interest and Taxes | -20.35% | 10.11% | 10.63% | 2.36% |
| Main Ratios | ||||
| Current | 3.49 | 4.82 | 6.78 | 1.76 |
| Quick | 3.49 | 4.82 | 6.78 | 1.49 |
| Total Debt to Total Assets | 78.54% | 60.38% | 43.74% | 5.71% |
| Pre-tax Return on Net Worth | -287.86% | 76.82% | 62.47% | 55.31% |
| Pre-tax Return on Assets | -61.78% | 30.44% | 35.15% | 12.78% |
| Additional Ratios | Year 1 | Year 2 | Year 3 | |
| Net Profit Margin | -22.91% | 6.01% | 6.72% | n.a |
| Return on Equity | -287.86% | 53.77% | 43.73% | n.a |
| Activity Ratios | ||||
| Accounts Receivable Turnover | 3.34 | 3.34 | 3.34 | n.a |
| Collection Days | 54 | 90 | 97 | n.a |
| Accounts Payable Turnover | 11.00 | 12.17 | 12.17 | n.a |
| Payment Days | 28 | 29 | 28 | n.a |
| Total Asset Turnover | 2.70 | 3.55 | 3.66 | n.a |
| Debt Ratios | ||||
| Debt to Net Worth | 3.66 | 1.52 | 0.78 | n.a |
| Current Liab. to Liab. | 0.33 | 0.32 | 0.33 | n.a |
| Liquidity Ratios | ||||
| Net Working Capital | $55,383 | $74,767 | $103,672 | n.a |
| Interest Coverage | -7.94 | 6.60 | 10.29 | n.a |
| Additional Ratios | ||||
| Assets to Sales | 0.37 | 0.28 | 0.27 | n.a |
| Current Debt/Total Assets | 26% | 20% | 14% | n.a |
| Acid Test | 1.16 | 0.74 | 1.03 | n.a |
| Sales/Net Worth | 12.57 | 8.95 | 6.51 | n.a |
| Dividend Payout | 0.00 | 0.00 | 0.00 | n.a |
Appendix
| Sales Forecast | |||||||||||||
| Month 1 | Month 2 | Month 3 | Month 4 | Month 5 | Month 6 | Month 7 | Month 8 | Month 9 | Month 10 | Month 11 | Month 12 | ||
| Sales | |||||||||||||
| Environmental nonprofits | 0% | $6,000 | $6,000 | $6,000 | $6,000 | $6,000 | $6,000 | $6,000 | $6,000 | $6,000 | $6,000 | $9,000 | $24,000 |
| Youth development nonprofits | 0% | $0 | $0 | $0 | $0 | $0 | $2,000 | $4,000 | $4,000 | $5,000 | $5,000 | $6,000 | $7,000 |
| Cultural nonprofits | 0% | $0 | $0 | $0 | $0 | $7,000 | $5,000 | $3,000 | $26,000 | $4,000 | $7,000 | $10,000 | $7,000 |
| Other | 0% | $0 | $0 | $0 | $0 | $0 | $0 | $7,000 | $5,000 | $12,000 | $5,000 | $2,000 | $5,000 |
| Total Sales | $6,000 | $6,000 | $6,000 | $6,000 | $13,000 | $13,000 | $20,000 | $41,000 | $27,000 | $23,000 | $27,000 | $43,000 | |
| Direct Cost of Sales | Month 1 | Month 2 | Month 3 | Month 4 | Month 5 | Month 6 | Month 7 | Month 8 | Month 9 | Month 10 | Month 11 | Month 12 | |
| Row 1 | $0 | $0 | $0 | $0 | $0 | $0 | $0 | $0 | $0 | $0 | $0 | $0 | |
| Other | $0 | $0 | $0 | $0 | $0 | $0 | $0 | $0 | $0 | $0 | $0 | $0 | |
| Subtotal Direct Cost of Sales | $0 | $0 | $0 | $0 | $0 | $0 | $0 | $0 | $0 | $0 | $0 | $0 | |
| Personnel Plan | |||||||||||||
| Month 1 | Month 2 | Month 3 | Month 4 | Month 5 | Month 6 | Month 7 | Month 8 | Month 9 | Month 10 | Month 11 | Month 12 | ||
| Mr. Curtis Cole- president | 0% | $3,000 | $3,000 | $3,000 | $3,000 | $3,000 | $3,000 | $3,000 | $3,000 | $3,000 | $3,000 | $3,000 | $3,000 |
| Mrs. Jennie Marks – CFO | 0% | $3,000 | $3,000 | $3,000 | $3,000 | $3,000 | $3,000 | $3,000 | $3,000 | $3,000 | $3,000 | $3,000 | $3,000 |
| Mr. David Danielson – projects manager | 0% | $3,000 | $3,000 | $3,000 | $3,000 | $3,000 | $3,000 | $3,000 | $3,000 | $3,000 | $3,000 | $3,000 | $3,000 |
| Mr. Milo Winn – audio-visual director | 0% | $3,000 | $3,000 | $3,000 | $3,000 | $3,000 | $3,000 | $3,000 | $3,000 | $3,000 | $3,000 | $3,000 | $3,000 |
| Advertising consultant | 0% | $3,000 | $3,000 | $3,000 | $3,000 | $3,000 | $3,000 | $3,000 | $3,000 | $3,000 | $3,000 | $3,000 | $3,000 |
| Advertising consultant | 0% | $0 | $0 | $0 | $0 | $0 | $0 | $0 | $0 | $0 | $0 | $0 | $0 |
| Graphic artist | 0% | $0 | $0 | $0 | $0 | $0 | $0 | $0 | $0 | $0 | $0 | $0 | $0 |
| Total People | 500% | 5 | 5 | 5 | 5 | 5 | 5 | 5 | 5 | 5 | 5 | 5 | 5 |
| Total Payroll | $15,000 | $15,000 | $15,000 | $15,000 | $15,000 | $15,000 | $15,000 | $15,000 | $15,000 | $15,000 | $15,000 | $15,000 | |
Brought to you by
Create a professional business plan
Using AI and step-by-step instructions
Create Your PlanSecure funding
Validate ideas
Build a strategy
| General Assumptions | |||||||||||||
| Month 1 | Month 2 | Month 3 | Month 4 | Month 5 | Month 6 | Month 7 | Month 8 | Month 9 | Month 10 | Month 11 | Month 12 | ||
| Plan Month | 1 | 2 | 3 | 4 | 5 | 6 | 7 | 8 | 9 | 10 | 11 | 12 | |
| Current Interest Rate | 10.00% | 10.00% | 10.00% | 10.00% | 10.00% | 10.00% | 10.00% | 10.00% | 10.00% | 10.00% | 10.00% | 10.00% | |
| Long-term Interest Rate | 10.00% | 10.00% | 10.00% | 10.00% | 10.00% | 10.00% | 10.00% | 10.00% | 10.00% | 10.00% | 10.00% | 10.00% | |
| Tax Rate | 30.00% | 30.00% | 30.00% | 30.00% | 30.00% | 30.00% | 30.00% | 30.00% | 30.00% | 30.00% | 30.00% | 30.00% | |
| Other | 0 | 0 | 0 | 0 | 0 | 0 | 0 | 0 | 0 | 0 | 0 | 0 | |
| Pro Forma Profit and Loss | |||||||||||||
| Month 1 | Month 2 | Month 3 | Month 4 | Month 5 | Month 6 | Month 7 | Month 8 | Month 9 | Month 10 | Month 11 | Month 12 | ||
| Sales | $6,000 | $6,000 | $6,000 | $6,000 | $13,000 | $13,000 | $20,000 | $41,000 | $27,000 | $23,000 | $27,000 | $43,000 | |
| Direct Cost of Sales | $0 | $0 | $0 | $0 | $0 | $0 | $0 | $0 | $0 | $0 | $0 | $0 | |
| Other Costs of Sales | $500 | $500 | $500 | $500 | $500 | $500 | $500 | $700 | $700 | $700 | $700 | $700 | |
| Total Cost of Sales | $500 | $500 | $500 | $500 | $500 | $500 | $500 | $700 | $700 | $700 | $700 | $700 | |
| Gross Margin | $5,500 | $5,500 | $5,500 | $5,500 | $12,500 | $12,500 | $19,500 | $40,300 | $26,300 | $22,300 | $26,300 | $42,300 | |
| Gross Margin % | 91.67% | 91.67% | 91.67% | 91.67% | 96.15% | 96.15% | 97.50% | 98.29% | 97.41% | 96.96% | 97.41% | 98.37% | |
| Expenses | |||||||||||||
| Payroll | $15,000 | $15,000 | $15,000 | $15,000 | $15,000 | $15,000 | $15,000 | $15,000 | $15,000 | $15,000 | $15,000 | $15,000 | |
| Sales and Marketing and Other Expenses | $1,000 | $1,000 | $1,000 | $1,000 | $1,000 | $1,000 | $1,000 | $1,000 | $1,000 | $1,000 | $1,000 | $1,000 | |
| Depreciation | $166 | $166 | $166 | $166 | $166 | $166 | $166 | $166 | $166 | $166 | $166 | $174 | |
| Rent | $1,000 | $1,000 | $1,000 | $1,000 | $1,000 | $1,000 | $1,000 | $1,000 | $1,000 | $1,000 | $1,000 | $1,000 | |
| Utilities | $300 | $300 | $300 | $300 | $300 | $300 | $300 | $300 | $300 | $300 | $300 | $300 | |
| Insurance | $250 | $250 | $250 | $250 | $250 | $250 | $250 | $250 | $250 | $250 | $250 | $250 | |
| Payroll Taxes | 15% | $2,250 | $2,250 | $2,250 | $2,250 | $2,250 | $2,250 | $2,250 | $2,250 | $2,250 | $2,250 | $2,250 | $2,250 |
| Travel | 15% | $1,200 | $3,000 | $1,000 | $2,000 | $2,000 | $3,000 | $2,000 | $1,000 | $2,000 | $3,000 | $1,000 | $3,000 |
| Other | $600 | $600 | $600 | $600 | $600 | $600 | $600 | $600 | $600 | $600 | $600 | $600 | |
| Total Operating Expenses | $21,766 | $23,566 | $21,566 | $22,566 | $22,566 | $23,566 | $22,566 | $21,566 | $22,566 | $23,566 | $21,566 | $23,574 | |
| Profit Before Interest and Taxes | ($16,266) | ($18,066) | ($16,066) | ($17,066) | ($10,066) | ($11,066) | ($3,066) | $18,734 | $3,734 | ($1,266) | $4,734 | $18,726 | |
| EBITDA | ($16,100) | ($17,900) | ($15,900) | ($16,900) | ($9,900) | ($10,900) | ($2,900) | $18,900 | $3,900 | ($1,100) | $4,900 | $18,900 | |
| Interest Expense | $503 | $497 | $492 | $486 | $481 | $475 | $511 | $506 | $500 | $495 | $489 | $483 | |
| Taxes Incurred | $0 | $0 | $0 | $0 | $0 | $0 | $0 | $0 | $0 | $0 | $0 | $0 | |
| Net Profit | ($16,769) | ($18,563) | ($16,558) | ($17,552) | ($10,547) | ($11,541) | ($3,577) | $18,228 | $3,234 | ($1,761) | $4,245 | $18,243 | |
| Net Profit/Sales | -279.48% | -309.39% | -275.96% | -292.54% | -81.13% | -88.78% | -17.89% | 44.46% | 11.98% | -7.65% | 15.72% | 42.42% | |
| Pro Forma Cash Flow | |||||||||||||
| Month 1 | Month 2 | Month 3 | Month 4 | Month 5 | Month 6 | Month 7 | Month 8 | Month 9 | Month 10 | Month 11 | Month 12 | ||
| Cash Received | |||||||||||||
| Cash from Operations | |||||||||||||
| Cash Sales | $1,500 | $1,500 | $1,500 | $1,500 | $3,250 | $3,250 | $5,000 | $10,250 | $6,750 | $5,750 | $6,750 | $10,750 | |
| Cash from Receivables | $0 | $150 | $4,500 | $4,500 | $4,500 | $4,675 | $9,750 | $9,925 | $15,525 | $30,400 | $20,150 | $17,350 | |
| Subtotal Cash from Operations | $1,500 | $1,650 | $6,000 | $6,000 | $7,750 | $7,925 | $14,750 | $20,175 | $22,275 | $36,150 | $26,900 | $28,100 | |
| Additional Cash Received | |||||||||||||
| Sales Tax, VAT, HST/GST Received | 0.00% | $0 | $0 | $0 | $0 | $0 | $0 | $0 | $0 | $0 | $0 | $0 | $0 |
| New Current Borrowing | $0 | $0 | $0 | $0 | $0 | $0 | $5,000 | $0 | $0 | $0 | $0 | $0 | |
| New Other Liabilities (interest-free) | $0 | $0 | $0 | $0 | $0 | $0 | $0 | $0 | $0 | $0 | $0 | $0 | |
| New Long-term Liabilities | $0 | $0 | $0 | $0 | $0 | $0 | $0 | $0 | $0 | $0 | $0 | $0 | |
| Sales of Other Current Assets | $0 | $0 | $0 | $0 | $0 | $0 | $0 | $0 | $0 | $0 | $0 | $0 | |
| Sales of Long-term Assets | $0 | $0 | $0 | $0 | $0 | $0 | $0 | $0 | $0 | $0 | $0 | $0 | |
| New Investment Received | $0 | $0 | $0 | $0 | $0 | $0 | $1,500 | $1,500 | $0 | $0 | $0 | $0 | |
| Subtotal Cash Received | $1,500 | $1,650 | $6,000 | $6,000 | $7,750 | $7,925 | $21,250 | $21,675 | $22,275 | $36,150 | $26,900 | $28,100 | |
| Expenditures | Month 1 | Month 2 | Month 3 | Month 4 | Month 5 | Month 6 | Month 7 | Month 8 | Month 9 | Month 10 | Month 11 | Month 12 | |
| Expenditures from Operations | |||||||||||||
| Cash Spending | $15,000 | $15,000 | $15,000 | $15,000 | $15,000 | $15,000 | $15,000 | $15,000 | $15,000 | $15,000 | $15,000 | $15,000 | |
| Bill Payments | $3,253 | $7,663 | $9,330 | $7,425 | $8,386 | $8,414 | $9,343 | $8,384 | $7,639 | $8,633 | $9,528 | $7,655 | |
| Subtotal Spent on Operations | $18,253 | $22,663 | $24,330 | $22,425 | $23,386 | $23,414 | $24,343 | $23,384 | $22,639 | $23,633 | $24,528 | $22,655 | |
| Additional Cash Spent | |||||||||||||
| Sales Tax, VAT, HST/GST Paid Out | $0 | $0 | $0 | $0 | $0 | $0 | $0 | $0 | $0 | $0 | $0 | $0 | |
| Principal Repayment of Current Borrowing | $666 | $666 | $666 | $666 | $666 | $666 | $666 | $666 | $666 | $666 | $666 | $666 | |
| Other Liabilities Principal Repayment | $0 | $0 | $0 | $0 | $0 | $0 | $0 | $0 | $0 | $0 | $0 | $0 | |
| Long-term Liabilities Principal Repayment | $0 | $0 | $0 | $0 | $0 | $0 | $0 | $0 | $0 | $0 | $0 | $0 | |
| Purchase Other Current Assets | $0 | $0 | $0 | $0 | $0 | $0 | $0 | $0 | $0 | $0 | $0 | $0 | |
| Purchase Long-term Assets | $0 | $0 | $0 | $0 | $0 | $0 | $0 | $0 | $0 | $0 | $0 | $0 | |
| Dividends | $0 | $0 | $0 | $0 | $0 | $0 | $0 | $0 | $0 | $0 | $0 | $0 | |
| Subtotal Cash Spent | $18,919 | $23,329 | $24,996 | $23,091 | $24,052 | $24,080 | $25,009 | $24,050 | $23,305 | $24,299 | $25,194 | $23,321 | |
| Net Cash Flow | ($17,419) | ($21,679) | ($18,996) | ($17,091) | ($16,302) | ($16,155) | ($3,759) | ($2,375) | ($1,030) | $11,851 | $1,706 | $4,779 | |
| Cash Balance | $99,881 | $78,202 | $59,206 | $42,115 | $25,813 | $9,658 | $5,899 | $3,524 | $2,494 | $14,345 | $16,051 | $20,830 | |
| Pro Forma Balance Sheet | |||||||||||||
| Month 1 | Month 2 | Month 3 | Month 4 | Month 5 | Month 6 | Month 7 | Month 8 | Month 9 | Month 10 | Month 11 | Month 12 | ||
| Assets | Starting Balances | ||||||||||||
| Current Assets | |||||||||||||
| Cash | $117,300 | $99,881 | $78,202 | $59,206 | $42,115 | $25,813 | $9,658 | $5,899 | $3,524 | $2,494 | $14,345 | $16,051 | $20,830 |
| Accounts Receivable | $0 | $4,500 | $8,850 | $8,850 | $8,850 | $14,100 | $19,175 | $24,425 | $45,250 | $49,975 | $36,825 | $36,925 | $51,825 |
| Other Current Assets | $5,000 | $5,000 | $5,000 | $5,000 | $5,000 | $5,000 | $5,000 | $5,000 | $5,000 | $5,000 | $5,000 | $5,000 | $5,000 |
| Total Current Assets | $122,300 | $109,381 | $92,052 | $73,056 | $55,965 | $44,913 | $33,833 | $35,324 | $53,774 | $57,469 | $56,170 | $57,976 | $77,655 |
| Long-term Assets | |||||||||||||
| Long-term Assets | $10,000 | $10,000 | $10,000 | $10,000 | $10,000 | $10,000 | $10,000 | $10,000 | $10,000 | $10,000 | $10,000 | $10,000 | $10,000 |
| Accumulated Depreciation | $0 | $166 | $332 | $498 | $664 | $830 | $996 | $1,162 | $1,328 | $1,494 | $1,660 | $1,826 | $2,000 |
| Total Long-term Assets | $10,000 | $9,834 | $9,668 | $9,502 | $9,336 | $9,170 | $9,004 | $8,838 | $8,672 | $8,506 | $8,340 | $8,174 | $8,000 |
| Total Assets | $132,300 | $119,215 | $101,720 | $82,558 | $65,301 | $54,083 | $42,837 | $44,162 | $62,446 | $65,975 | $64,510 | $66,150 | $85,655 |
| Liabilities and Capital | Month 1 | Month 2 | Month 3 | Month 4 | Month 5 | Month 6 | Month 7 | Month 8 | Month 9 | Month 10 | Month 11 | Month 12 | |
| Current Liabilities | |||||||||||||
| Accounts Payable | $3,000 | $7,349 | $9,084 | $7,145 | $8,107 | $8,101 | $9,063 | $8,131 | $7,352 | $8,313 | $9,275 | $7,336 | $9,264 |
| Current Borrowing | $16,000 | $15,334 | $14,668 | $14,002 | $13,336 | $12,670 | $12,004 | $16,338 | $15,672 | $15,006 | $14,340 | $13,674 | $13,008 |
| Other Current Liabilities | $0 | $0 | $0 | $0 | $0 | $0 | $0 | $0 | $0 | $0 | $0 | $0 | $0 |
| Subtotal Current Liabilities | $19,000 | $22,683 | $23,752 | $21,147 | $21,443 | $20,771 | $21,067 | $24,469 | $23,024 | $23,319 | $23,615 | $21,010 | $22,272 |
| Long-term Liabilities | $45,000 | $45,000 | $45,000 | $45,000 | $45,000 | $45,000 | $45,000 | $45,000 | $45,000 | $45,000 | $45,000 | $45,000 | $45,000 |
| Total Liabilities | $64,000 | $67,683 | $68,752 | $66,147 | $66,443 | $65,771 | $66,067 | $69,469 | $68,024 | $68,319 | $68,615 | $66,010 | $67,272 |
| Paid-in Capital | $100,000 | $100,000 | $100,000 | $100,000 | $100,000 | $100,000 | $100,000 | $101,500 | $103,000 | $103,000 | $103,000 | $103,000 | $103,000 |
| Retained Earnings | ($31,700) | ($31,700) | ($31,700) | ($31,700) | ($31,700) | ($31,700) | ($31,700) | ($31,700) | ($31,700) | ($31,700) | ($31,700) | ($31,700) | ($31,700) |
| Earnings | $0 | ($16,769) | ($35,332) | ($51,890) | ($69,442) | ($79,988) | ($91,529) | ($95,107) | ($76,878) | ($73,644) | ($75,405) | ($71,160) | ($52,917) |
| Total Capital | $68,300 | $51,531 | $32,968 | $16,410 | ($1,142) | ($11,688) | ($23,229) | ($25,307) | ($5,578) | ($2,344) | ($4,105) | $140 | $18,383 |
| Total Liabilities and Capital | $132,300 | $119,215 | $101,720 | $82,558 | $65,301 | $54,083 | $42,837 | $44,162 | $62,446 | $65,975 | $64,510 | $66,150 | $85,655 |
| Net Worth | $68,300 | $51,531 | $32,968 | $16,410 | ($1,142) | ($11,688) | ($23,229) | ($25,307) | ($5,578) | ($2,344) | ($4,105) | $140 | $18,383 |


