
Brushy Mountain Retreat
Executive Summary
Brushy Mountain Retreat began in one summer when founder Judith Cabot took over an empty dorm at Connecticut’s Johnson Mountain College. There she began telling women that diets don’t work. She began a series of intensive one-week workshops introducing women to the fundamentals of a building a long-term weight management program and healthy lifestyle. The first workshops were limited to four participants each. Brushy Mountain Retreat operated as a summer program through its first years, but as its popularity grew by word of mouth, the program evolved, and quickly became year round.
Over the next nine years, Brushy Mountain Retreat expanded its program into a series of four sequential one-week workshops that can either be taken separately or in blocks. The program now has hundreds of alumnae. The program session enrollment limit has risen to 20. Most importantly, the retreat now has a six month waiting list.
In response to the program’s growth, Brushy Mountain Retreat will move into a new facility. The new home is a former corporate retreat on a hill overlooking Johnson Ridge and the Johnson Valley Golf Course, premier winter and summer resort areas in Connecticut. Set on 16 wooded acres, the lodge offers informal classrooms, well-equipped physical activity rooms, a spacious dining room, and a comfortable common room.
The program workshop enrollment will double in the new facility. Up to 40 women can be accommodated in single and double rooms.
The lease on the new facility is $80,000 annually.
The move to a new facility will be funded by Judith Cabot’s personal financial investment and a short-term loan.
1.1 Mission
The mission of Brushy Mountain Retreat is to offer a practical, livable healthy lifestyle approach where women can discover the personal power to lose weight and keep it off.
1.2 Keys to Success
The keys to success for the Brushy Mountain Retreat are the following:
- Change how women relate to food.
- Change how women feel through regular exercise.
- Change the way women look at themselves.
Company Summary
Set in Connecticut’s beautiful Brushy Mountains, Brushy Mountain Retreat’s new site sits among 16 wooded acres overlooking Johnson Ridge. The retreat offers women programs that lead to permanent solutions to struggles with weight, eating, body image and fitness, as well as programs for successful management of adult-onset or Type II diabetes.
More than just another weight loss spa, health resort or diet program, Brushy Mountain Retreat offers a practical, livable healthy lifestyle approach where women have discovered how to lose weight and keep it off.
2.1 Company History
Brushy Mountain Retreat began one summer when founder Judith Cabot took over an empty dorm at Connecticut’s Johnson Mountain College. Brushy Mountain Retreat operated as a summer program through its first years, but as its popularity grew by word of mouth, the program evolved and became year round. The retreat offered a series of intensive one-week workshops introducing women to the fundamentals of a building a long-term weight management and healthy lifestyle. Enrollment was limited to eight women during a workshop period.
Since then, Brushy Mountain Retreat has expanded rapidly into a program of four sequential one-week workshops. These workshops can either be taken separately or in blocks. The program session enrollment limit has more than doubled during this time period. Most importantly, the retreat now has a six month waiting list.

| Past Performance | |||
| 1999 | 2000 | 2001 | |
| Sales | $960,000 | $1,104,000 | $1,200,600 |
| Gross Margin | $912,000 | $1,048,800 | $1,140,570 |
| Gross Margin % | 95.00% | 95.00% | 95.00% |
| Operating Expenses | $500,000 | $600,000 | $700,000 |
| Balance Sheet | |||
| 1999 | 2000 | 2001 | |
| Current Assets | |||
| Cash | $40,000 | $60,000 | $80,000 |
| Other Current Assets | $10,000 | $30,000 | $50,000 |
| Total Current Assets | $50,000 | $90,000 | $130,000 |
| Long-term Assets | |||
| Long-term Assets | $80,000 | $150,000 | $200,000 |
| Accumulated Depreciation | $10,000 | $20,000 | $30,000 |
| Total Long-term Assets | $70,000 | $130,000 | $170,000 |
| Total Assets | $120,000 | $220,000 | $300,000 |
| Current Liabilities | |||
| Accounts Payable | $40,000 | $60,000 | $60,000 |
| Current Borrowing | $0 | $0 | $0 |
| Other Current Liabilities (interest free) | $0 | $0 | $0 |
| Total Current Liabilities | $40,000 | $60,000 | $60,000 |
| Long-term Liabilities | $50,000 | $80,000 | $150,000 |
| Total Liabilities | $90,000 | $140,000 | $210,000 |
| Paid-in Capital | $0 | $0 | $0 |
| Retained Earnings | $30,000 | $80,000 | $90,000 |
| Earnings | $0 | $0 | $0 |
| Total Capital | $30,000 | $80,000 | $90,000 |
| Total Capital and Liabilities | $120,000 | $220,000 | $300,000 |
| Other Inputs | |||
| Payment Days | 0 | 0 | 0 |
2.2 Company Ownership
Brushy Mountain Retreat is owned by Judith Cabot.
Services
Program
Our program is designed for the active woman who wants a focused, comprehensive approach to health and weight management. We offer intensive educational programs of either one, two, three, four or more weeks, and limit our enrollment to no more than 40 women.
The curriculum is based on a four-week core concept that can be taken as four, three, two or one week(s) at a time. The workshops offered throughout the four-week sessions are linked to move the participants through a process of exploration and development.
INTRODUCTORY ONE-WEEK PROGRAM
“The Beginning”
This intensive one-week experience introduces the fundamentals of building a long-term weight management and healthy lifestyle program. Participants will start with a fitness program that is safe, comfortable and geared toward weight, age and physical capabilities. Each participant will create a ‘take-home’ fitness and exercise program that is livable, including resistance training and cardiovascular (aerobic) fitness.
THE TWO-WEEK PROGRAM
“Out of the Past”
The two-week program builds on the accomplishments and successes gained in the first week experience. Eating/behavioral workshops will focus on issues such as dealing with high risk foods and situations that may trigger overeating, bingeing, compulsive eating or emotional eating. The fitness program continues to offer a wide variety of classes, all of which are taught by our exercise physiologists/fitness specialists and modified according to fitness level and abilities.
THREE & FOUR WEEK PROGRAMS
“Into Your Future”
The three and four-week programs represent the core curriculum from which all of the other program experiences have been developed. These programs offer the greatest opportunity for learning and practicing the Brushy Mountain approach.
This is the most comprehensive program, featuring the full set of core workshops in nutrition, fitness/exercise physiology emotional eating, binge eating and body image.
There is greater opportunity for one-on-one sessions with key senior staff members, while planning and personalizing a program. More time is available for in-depth discussions and focus on high risk and problem situations.
The four-week program has been evaluated for its long-term results. Published in the peer reviewed scientific literature, the five year success rate of the program was documented in a study conducted by researchers at State University. It showed a success rate over 15 times greater than other previously published results from commercial or hospital-based programs.
| Prices per: | Singles | Doubles |
| One Week | $1,245 | $975 |
| Two Weeks | $2,130 | $1,635 |
| Three Weeks | $3,360 | $2,650 |
| Four Weeks | $4,340 | $3,490 |
Costs include: Room, all meals, seminars, fitness evaluations, workshop materials, individual nutrition and fitness consults, plus taxes and gratuities.
Extra Services
Massage services will be offered at $50/hr.
Personal trainers will also be available at $50/hr.
Market Analysis Summary
The dieting “Body Wars” are great for the economy, as the majority of discontented dieters repeatedly invest their resources in shedding pounds. Figures from the late 1990s showed that Americans spent $50 billion annually on diet products. This exceeds the projections for the entire Federal education, training, employment and social services budgets by five to ten billion dollars. In fact, this figure is the equivalent of the gross national product of Ireland. An estimated 50 million Americans will go on diets this year. And while some will succeed in taking the weight off, very few–perhaps five percent–will manage to keep all of it off in the long run.
Brought to you by
Create a professional business plan
Using AI and step-by-step instructions
Create Your PlanSecure funding
Validate ideas
Build a strategy
Approximately eight million Americans a year enroll in some kind of structured weight-loss program involving liquid diets, special diet regimens, or medical or other supervision. Approximately 70% are women. In 1991, about 8,500 commercial diet centers were in operation across the country, many of them owned by well-known national companies.
Against this backdrop, Brushy Mountain Retreat is a uniquely effective experience for professional women who are fed up with the false promises of commercial diet centers. In addition, those women facing adult-onset or Type II diabetes find few effective programs that can make the diet and lifestyle changes that truly impact the quality of their lives.
4.1 Market Segmentation
Brushy Mountain Retreat is focused on two target customer groups:
- Professional women who chronically overweight: A general characteristic of this group is their history with numerous diet programs that have left them no better off than when they started. They are knowledgeable of most of the popular diet plans and are seeking a program that will have a long-range impact on their weight gain. As a group they are highly motivated to find a solution but have experienced a sense of isolation. They are craving a community approach to their weight problem. They want a system that will sustain them after they leave the treatment facility.
- Professional women who are facing adult-onset or Type II diabetes: This group is highly motivated to make the lifestyle changes that will improve the quality of their lives. They are looking for a program that will tailor the fitness regimen around their health concerns but won’t sacrifice results. The program’s medical model is pivotal to their decision to attend one program over another. They want qualified health professionals on staff and available 24 hours a day, seven days a week.
Both groups have incomes that exceed $70,000 a year and are college educated.
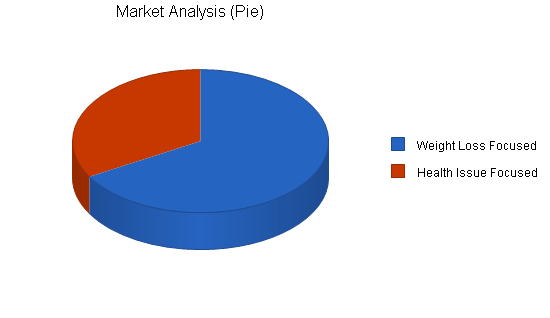
| Market Analysis | |||||||
| 2002 | 2003 | 2004 | 2005 | 2006 | |||
| Potential Customers | Growth | CAGR | |||||
| Weight Loss Focused | 20% | 1,000,000 | 1,200,000 | 1,440,000 | 1,728,000 | 2,073,600 | 20.00% |
| Health Issue Focused | 10% | 500,000 | 550,000 | 605,000 | 665,500 | 732,050 | 10.00% |
| Total | 16.95% | 1,500,000 | 1,750,000 | 2,045,000 | 2,393,500 | 2,805,650 | 16.95% |
Strategy and Implementation Summary
Brushy Mountain Retreat will move into a new facility. The retreat’s new home is a former ski and corporate retreat on a hill overlooking Johnson Mountain and the Johnson Valley Golf Course, premier winter and summer resort areas in Connecticut. The program workshop enrollment capacity will almost double in the new facility. Up to 40 women will be accommodated in single and double rooms. The retreat staff will increase to better serve the additional customers.
5.1 Sales Strategy
Currently, there is a six month waiting list to attend the retreat’s workshops. This list will be used to fill enrollment goal in the new facility. Customer satisfaction will increase due to the elimination of the attendance waiting list. The strength of the Brushy Mountain Retreat has always been word of mouth. Increased enrollment will result in increased referrals from the programs alumni as well as clients returning to take additional workshops.
5.1.1 Sales Forecast
The following is the sales forecast for three years. The first year monthly figures are included in the appendices.

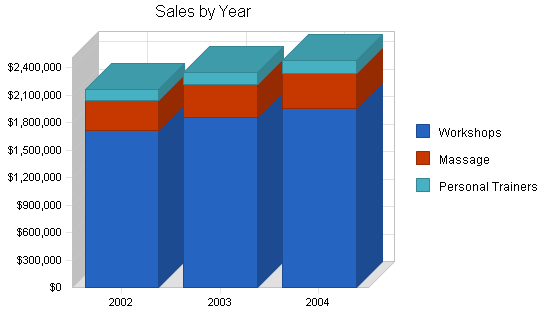
| Sales Forecast | |||
| 2002 | 2003 | 2004 | |
| Sales | |||
| Workshops | $1,710,000 | $1,860,000 | $1,950,000 |
| Massage | $336,000 | $360,000 | $390,000 |
| Personal Trainers | $114,000 | $130,000 | $140,000 |
| Total Sales | $2,160,000 | $2,350,000 | $2,480,000 |
| Direct Cost of Sales | 2002 | 2003 | 2004 |
| Workshops | $179,000 | $197,000 | $215,000 |
| Massage | $214,000 | $240,000 | $260,000 |
| Personal Trainers | $81,000 | $91,000 | $98,000 |
| Subtotal Direct Cost of Sales | $474,000 | $528,000 | $573,000 |
Management Summary
A pioneering woman who started her own business, Judith, MS, RD, founded Brushy Mountain Retreat at the age of 50 after an illustrious and prolific career as a nutritionist, teacher and author. Prior to Brushy Mountain, Judith was a nationally recognized fitness educator. She has assembled an excellent staff that has created a strong loyal support base with women who have attended the workshops.
6.1 Personnel Plan
The personnel plan of Brushy Mountain Retreat is as follows:
- Executive director
- Nutrition director
- Fitness director
- Medical consultant
- Dietitian
- Exercise physiologists (4)
- Counselors (6)
- Food service staff (4)
- Cleaning staff (4)
| Personnel Plan | |||
| 2002 | 2003 | 2004 | |
| Executive Director | $60,000 | $63,000 | $66,000 |
| Nutrition Director | $48,000 | $50,000 | $52,000 |
| Fitness Director | $48,000 | $50,000 | $52,000 |
| Medical Consultant | $36,000 | $36,000 | $36,000 |
| Behavioral Health Therapist | $48,000 | $50,000 | $52,000 |
| Dietitian | $36,000 | $38,000 | $40,000 |
| Exercise Physiologists | $168,000 | $178,000 | $188,000 |
| Counselors | $252,000 | $264,000 | $276,000 |
| Cleaning Staff | $69,600 | $71,000 | $73,000 |
| Chef | $42,000 | $44,000 | $46,000 |
| Food Service Staff | $74,400 | $76,000 | $78,000 |
| Total People | 25 | 25 | 25 |
| Total Payroll | $882,000 | $920,000 | $959,000 |
Financial Plan
The following is the financial plan for Brushy Mountain Retreat.
7.1 Break-even Analysis
The monthly break-even point is shown in the table and chart below.

| Break-even Analysis | |
| Monthly Revenue Break-even | $148,858 |
| Assumptions: | |
| Average Percent Variable Cost | 22% |
| Estimated Monthly Fixed Cost | $116,192 |
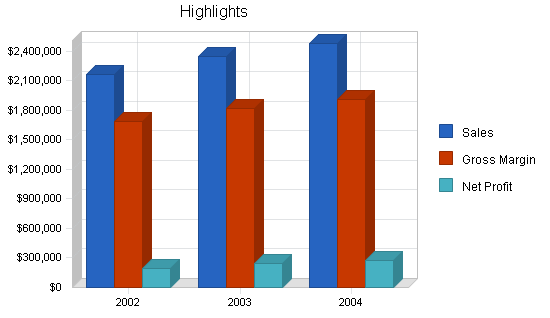
7.2 Projected Profit and Loss
The following table and charts are the projected profit and loss for three years.


| Pro Forma Profit and Loss | |||
| 2002 | 2003 | 2004 | |
| Sales | $2,160,000 | $2,350,000 | $2,480,000 |
| Direct Cost of Sales | $474,000 | $528,000 | $573,000 |
| Other Production Expenses | $0 | $0 | $0 |
| Total Cost of Sales | $474,000 | $528,000 | $573,000 |
| Gross Margin | $1,686,000 | $1,822,000 | $1,907,000 |
| Gross Margin % | 78.06% | 77.53% | 76.90% |
| Expenses | |||
| Payroll | $882,000 | $920,000 | $959,000 |
| Sales and Marketing and Other Expenses | $180,000 | $200,000 | $200,000 |
| Depreciation | $48,000 | $48,000 | $48,000 |
| Leased Equipment | $60,000 | $60,000 | $60,000 |
| Utilities | $12,000 | $12,000 | $12,000 |
| Insurance | $0 | $0 | $0 |
| Rent | $80,000 | $80,000 | $80,000 |
| Payroll Taxes | $132,300 | $138,000 | $143,850 |
| Other | $0 | $0 | $0 |
| Total Operating Expenses | $1,394,300 | $1,458,000 | $1,502,850 |
| Profit Before Interest and Taxes | $291,700 | $364,000 | $404,150 |
| EBITDA | $339,700 | $412,000 | $452,150 |
| Interest Expense | $13,645 | $11,249 | $8,748 |
| Taxes Incurred | $83,416 | $105,825 | $118,621 |
| Net Profit | $194,638 | $246,926 | $276,781 |
| Net Profit/Sales | 9.01% | 10.51% | 11.16% |
7.3 Projected Cash Flow
The following table and chart are the projected cash flow for three years.

| Pro Forma Cash Flow | |||
| 2002 | 2003 | 2004 | |
| Cash Received | |||
| Cash from Operations | |||
| Cash Sales | $2,160,000 | $2,350,000 | $2,480,000 |
| Subtotal Cash from Operations | $2,160,000 | $2,350,000 | $2,480,000 |
| Additional Cash Received | |||
| Sales Tax, VAT, HST/GST Received | $0 | $0 | $0 |
| New Current Borrowing | $0 | $0 | $0 |
| New Other Liabilities (interest-free) | $0 | $0 | $0 |
| New Long-term Liabilities | $0 | $0 | $0 |
| Sales of Other Current Assets | $0 | $0 | $0 |
| Sales of Long-term Assets | $0 | $0 | $0 |
| New Investment Received | $0 | $0 | $0 |
| Subtotal Cash Received | $2,160,000 | $2,350,000 | $2,480,000 |
| Expenditures | 2002 | 2003 | 2004 |
| Expenditures from Operations | |||
| Cash Spending | $882,000 | $920,000 | $959,000 |
| Bill Payments | $1,007,426 | $1,129,717 | $1,191,193 |
| Subtotal Spent on Operations | $1,889,426 | $2,049,717 | $2,150,193 |
| Additional Cash Spent | |||
| Sales Tax, VAT, HST/GST Paid Out | $0 | $0 | $0 |
| Principal Repayment of Current Borrowing | $0 | $0 | $0 |
| Other Liabilities Principal Repayment | $0 | $0 | $0 |
| Long-term Liabilities Principal Repayment | $25,008 | $25,008 | $25,008 |
| Purchase Other Current Assets | $0 | $0 | $0 |
| Purchase Long-term Assets | $60,000 | $60,000 | $60,000 |
| Dividends | $0 | $0 | $0 |
| Subtotal Cash Spent | $1,974,434 | $2,134,725 | $2,235,201 |
| Net Cash Flow | $185,566 | $215,275 | $244,799 |
| Cash Balance | $265,566 | $480,842 | $725,641 |
7.4 Projected Balance Sheet
The following table is the projected balance sheet for three years.
| Pro Forma Balance Sheet | |||
| 2002 | 2003 | 2004 | |
| Assets | |||
| Current Assets | |||
| Cash | $265,566 | $480,842 | $725,641 |
| Other Current Assets | $50,000 | $50,000 | $50,000 |
| Total Current Assets | $315,566 | $530,842 | $775,641 |
| Long-term Assets | |||
| Long-term Assets | $260,000 | $320,000 | $380,000 |
| Accumulated Depreciation | $78,000 | $126,000 | $174,000 |
| Total Long-term Assets | $182,000 | $194,000 | $206,000 |
| Total Assets | $497,566 | $724,842 | $981,641 |
| Liabilities and Capital | 2002 | 2003 | 2004 |
| Current Liabilities | |||
| Accounts Payable | $87,936 | $93,294 | $98,319 |
| Current Borrowing | $0 | $0 | $0 |
| Other Current Liabilities | $0 | $0 | $0 |
| Subtotal Current Liabilities | $87,936 | $93,294 | $98,319 |
| Long-term Liabilities | $124,992 | $99,984 | $74,976 |
| Total Liabilities | $212,928 | $193,278 | $173,295 |
| Paid-in Capital | $0 | $0 | $0 |
| Retained Earnings | $90,000 | $284,638 | $531,564 |
| Earnings | $194,638 | $246,926 | $276,781 |
| Total Capital | $284,638 | $531,564 | $808,345 |
| Total Liabilities and Capital | $497,566 | $724,842 | $981,641 |
| Net Worth | $284,638 | $531,564 | $808,345 |
7.5 Business Ratios
Business ratios for the years of this plan are shown below. Industry profile ratios based on the Standard Industrial Classification (SIC) code 7032, Sporting and Recreation Camps, are shown for comparison.
| Ratio Analysis | ||||
| 2002 | 2003 | 2004 | Industry Profile | |
| Sales Growth | 79.91% | 8.80% | 5.53% | 7.50% |
| Percent of Total Assets | ||||
| Other Current Assets | 10.05% | 6.90% | 5.09% | 26.90% |
| Total Current Assets | 63.42% | 73.24% | 79.01% | 33.40% |
| Long-term Assets | 36.58% | 26.76% | 20.99% | 66.60% |
| Total Assets | 100.00% | 100.00% | 100.00% | 100.00% |
| Current Liabilities | 17.67% | 12.87% | 10.02% | 16.30% |
| Long-term Liabilities | 25.12% | 13.79% | 7.64% | 38.40% |
| Total Liabilities | 42.79% | 26.66% | 17.65% | 54.70% |
| Net Worth | 57.21% | 73.34% | 82.35% | 45.30% |
| Percent of Sales | ||||
| Sales | 100.00% | 100.00% | 100.00% | 100.00% |
| Gross Margin | 78.06% | 77.53% | 76.90% | 0.00% |
| Selling, General & Administrative Expenses | 69.04% | 67.02% | 65.73% | 70.30% |
| Advertising Expenses | 8.33% | 8.51% | 8.06% | 5.10% |
| Profit Before Interest and Taxes | 13.50% | 15.49% | 16.30% | 4.20% |
| Main Ratios | ||||
| Current | 3.59 | 5.69 | 7.89 | 1.75 |
| Quick | 3.59 | 5.69 | 7.89 | 1.24 |
| Total Debt to Total Assets | 42.79% | 26.66% | 17.65% | 54.70% |
| Pre-tax Return on Net Worth | 97.69% | 66.36% | 48.91% | 2.70% |
| Pre-tax Return on Assets | 55.88% | 48.67% | 40.28% | 5.90% |
| Additional Ratios | 2002 | 2003 | 2004 | |
| Net Profit Margin | 9.01% | 10.51% | 11.16% | n.a |
| Return on Equity | 68.38% | 46.45% | 34.24% | n.a |
| Activity Ratios | ||||
| Accounts Payable Turnover | 11.77 | 12.17 | 12.17 | n.a |
| Payment Days | 29 | 29 | 29 | n.a |
| Total Asset Turnover | 4.34 | 3.24 | 2.53 | n.a |
| Debt Ratios | ||||
| Debt to Net Worth | 0.75 | 0.36 | 0.21 | n.a |
| Current Liab. to Liab. | 0.41 | 0.48 | 0.57 | n.a |
| Liquidity Ratios | ||||
| Net Working Capital | $227,630 | $437,548 | $677,321 | n.a |
| Interest Coverage | 21.38 | 32.36 | 46.20 | n.a |
| Additional Ratios | ||||
| Assets to Sales | 0.23 | 0.31 | 0.40 | n.a |
| Current Debt/Total Assets | 18% | 13% | 10% | n.a |
| Acid Test | 3.59 | 5.69 | 7.89 | n.a |
| Sales/Net Worth | 7.59 | 4.42 | 3.07 | n.a |
| Dividend Payout | 0.00 | 0.00 | 0.00 | n.a |
Appendix
| Sales Forecast | |||||||||||||
| Jan | Feb | Mar | Apr | May | Jun | Jul | Aug | Sep | Oct | Nov | Dec | ||
| Sales | |||||||||||||
| Workshops | 0% | $100,000 | $125,000 | $145,000 | $150,000 | $160,000 | $160,000 | $160,000 | $150,000 | $140,000 | $140,000 | $130,000 | $150,000 |
| Massage | 0% | $15,000 | $20,000 | $25,000 | $30,000 | $34,000 | $36,000 | $36,000 | $30,000 | $28,000 | $27,000 | $25,000 | $30,000 |
| Personal Trainers | 0% | $8,000 | $8,000 | $8,000 | $10,000 | $10,000 | $10,000 | $10,000 | $10,000 | $10,000 | $10,000 | $10,000 | $10,000 |
| Total Sales | $123,000 | $153,000 | $178,000 | $190,000 | $204,000 | $206,000 | $206,000 | $190,000 | $178,000 | $177,000 | $165,000 | $190,000 | |
| Direct Cost of Sales | Jan | Feb | Mar | Apr | May | Jun | Jul | Aug | Sep | Oct | Nov | Dec | |
| Workshops | $10,000 | $12,000 | $14,000 | $15,000 | $20,000 | $20,000 | $20,000 | $15,000 | $13,000 | $13,000 | $12,000 | $15,000 | |
| Massage | $10,000 | $14,000 | $9,000 | $20,000 | $22,000 | $24,000 | $24,000 | $20,000 | $18,000 | $17,000 | $16,000 | $20,000 | |
| Personal Trainers | $6,000 | $6,000 | $6,000 | $7,000 | $7,000 | $7,000 | $7,000 | $7,000 | $7,000 | $7,000 | $7,000 | $7,000 | |
| Subtotal Direct Cost of Sales | $26,000 | $32,000 | $29,000 | $42,000 | $49,000 | $51,000 | $51,000 | $42,000 | $38,000 | $37,000 | $35,000 | $42,000 | |
Brought to you by
Create a professional business plan
Using AI and step-by-step instructions
Create Your PlanSecure funding
Validate ideas
Build a strategy
| Personnel Plan | |||||||||||||
| Jan | Feb | Mar | Apr | May | Jun | Jul | Aug | Sep | Oct | Nov | Dec | ||
| Executive Director | 0% | $5,000 | $5,000 | $5,000 | $5,000 | $5,000 | $5,000 | $5,000 | $5,000 | $5,000 | $5,000 | $5,000 | $5,000 |
| Nutrition Director | 0% | $4,000 | $4,000 | $4,000 | $4,000 | $4,000 | $4,000 | $4,000 | $4,000 | $4,000 | $4,000 | $4,000 | $4,000 |
| Fitness Director | 0% | $4,000 | $4,000 | $4,000 | $4,000 | $4,000 | $4,000 | $4,000 | $4,000 | $4,000 | $4,000 | $4,000 | $4,000 |
| Medical Consultant | 0% | $3,000 | $3,000 | $3,000 | $3,000 | $3,000 | $3,000 | $3,000 | $3,000 | $3,000 | $3,000 | $3,000 | $3,000 |
| Behavioral Health Therapist | 0% | $4,000 | $4,000 | $4,000 | $4,000 | $4,000 | $4,000 | $4,000 | $4,000 | $4,000 | $4,000 | $4,000 | $4,000 |
| Dietitian | 0% | $3,000 | $3,000 | $3,000 | $3,000 | $3,000 | $3,000 | $3,000 | $3,000 | $3,000 | $3,000 | $3,000 | $3,000 |
| Exercise Physiologists | 0% | $14,000 | $14,000 | $14,000 | $14,000 | $14,000 | $14,000 | $14,000 | $14,000 | $14,000 | $14,000 | $14,000 | $14,000 |
| Counselors | 0% | $21,000 | $21,000 | $21,000 | $21,000 | $21,000 | $21,000 | $21,000 | $21,000 | $21,000 | $21,000 | $21,000 | $21,000 |
| Cleaning Staff | 0% | $5,800 | $5,800 | $5,800 | $5,800 | $5,800 | $5,800 | $5,800 | $5,800 | $5,800 | $5,800 | $5,800 | $5,800 |
| Chef | 0% | $3,500 | $3,500 | $3,500 | $3,500 | $3,500 | $3,500 | $3,500 | $3,500 | $3,500 | $3,500 | $3,500 | $3,500 |
| Food Service Staff | 0% | $6,200 | $6,200 | $6,200 | $6,200 | $6,200 | $6,200 | $6,200 | $6,200 | $6,200 | $6,200 | $6,200 | $6,200 |
| Total People | 25 | 25 | 25 | 25 | 25 | 25 | 25 | 25 | 25 | 25 | 25 | 25 | |
| Total Payroll | $73,500 | $73,500 | $73,500 | $73,500 | $73,500 | $73,500 | $73,500 | $73,500 | $73,500 | $73,500 | $73,500 | $73,500 | |
| General Assumptions | |||||||||||||
| Jan | Feb | Mar | Apr | May | Jun | Jul | Aug | Sep | Oct | Nov | Dec | ||
| Plan Month | 1 | 2 | 3 | 4 | 5 | 6 | 7 | 8 | 9 | 10 | 11 | 12 | |
| Current Interest Rate | 10.00% | 10.00% | 10.00% | 10.00% | 10.00% | 10.00% | 10.00% | 10.00% | 10.00% | 10.00% | 10.00% | 10.00% | |
| Long-term Interest Rate | 10.00% | 10.00% | 10.00% | 10.00% | 10.00% | 10.00% | 10.00% | 10.00% | 10.00% | 10.00% | 10.00% | 10.00% | |
| Tax Rate | 30.00% | 30.00% | 30.00% | 30.00% | 30.00% | 30.00% | 30.00% | 30.00% | 30.00% | 30.00% | 30.00% | 30.00% | |
| Other | 0 | 0 | 0 | 0 | 0 | 0 | 0 | 0 | 0 | 0 | 0 | 0 | |
| Pro Forma Profit and Loss | |||||||||||||
| Jan | Feb | Mar | Apr | May | Jun | Jul | Aug | Sep | Oct | Nov | Dec | ||
| Sales | $123,000 | $153,000 | $178,000 | $190,000 | $204,000 | $206,000 | $206,000 | $190,000 | $178,000 | $177,000 | $165,000 | $190,000 | |
| Direct Cost of Sales | $26,000 | $32,000 | $29,000 | $42,000 | $49,000 | $51,000 | $51,000 | $42,000 | $38,000 | $37,000 | $35,000 | $42,000 | |
| Other Production Expenses | $0 | $0 | $0 | $0 | $0 | $0 | $0 | $0 | $0 | $0 | $0 | $0 | |
| Total Cost of Sales | $26,000 | $32,000 | $29,000 | $42,000 | $49,000 | $51,000 | $51,000 | $42,000 | $38,000 | $37,000 | $35,000 | $42,000 | |
| Gross Margin | $97,000 | $121,000 | $149,000 | $148,000 | $155,000 | $155,000 | $155,000 | $148,000 | $140,000 | $140,000 | $130,000 | $148,000 | |
| Gross Margin % | 78.86% | 79.08% | 83.71% | 77.89% | 75.98% | 75.24% | 75.24% | 77.89% | 78.65% | 79.10% | 78.79% | 77.89% | |
| Expenses | |||||||||||||
| Payroll | $73,500 | $73,500 | $73,500 | $73,500 | $73,500 | $73,500 | $73,500 | $73,500 | $73,500 | $73,500 | $73,500 | $73,500 | |
| Sales and Marketing and Other Expenses | $15,000 | $15,000 | $15,000 | $15,000 | $15,000 | $15,000 | $15,000 | $15,000 | $15,000 | $15,000 | $15,000 | $15,000 | |
| Depreciation | $4,000 | $4,000 | $4,000 | $4,000 | $4,000 | $4,000 | $4,000 | $4,000 | $4,000 | $4,000 | $4,000 | $4,000 | |
| Leased Equipment | $5,000 | $5,000 | $5,000 | $5,000 | $5,000 | $5,000 | $5,000 | $5,000 | $5,000 | $5,000 | $5,000 | $5,000 | |
| Utilities | $1,000 | $1,000 | $1,000 | $1,000 | $1,000 | $1,000 | $1,000 | $1,000 | $1,000 | $1,000 | $1,000 | $1,000 | |
| Insurance | $0 | $0 | $0 | $0 | $0 | $0 | $0 | $0 | $0 | $0 | $0 | $0 | |
| Rent | $6,666 | $6,666 | $6,666 | $6,666 | $6,666 | $6,666 | $6,666 | $6,666 | $6,666 | $6,666 | $6,666 | $6,674 | |
| Payroll Taxes | 15% | $11,025 | $11,025 | $11,025 | $11,025 | $11,025 | $11,025 | $11,025 | $11,025 | $11,025 | $11,025 | $11,025 | $11,025 |
| Other | $0 | $0 | $0 | $0 | $0 | $0 | $0 | $0 | $0 | $0 | $0 | $0 | |
| Total Operating Expenses | $116,191 | $116,191 | $116,191 | $116,191 | $116,191 | $116,191 | $116,191 | $116,191 | $116,191 | $116,191 | $116,191 | $116,199 | |
| Profit Before Interest and Taxes | ($19,191) | $4,809 | $32,809 | $31,809 | $38,809 | $38,809 | $38,809 | $31,809 | $23,809 | $23,809 | $13,809 | $31,801 | |
| EBITDA | ($15,191) | $8,809 | $36,809 | $35,809 | $42,809 | $42,809 | $42,809 | $35,809 | $27,809 | $27,809 | $17,809 | $35,801 | |
| Interest Expense | $1,233 | $1,215 | $1,198 | $1,181 | $1,163 | $1,146 | $1,128 | $1,111 | $1,094 | $1,076 | $1,059 | $1,042 | |
| Taxes Incurred | ($6,127) | $1,078 | $9,483 | $9,189 | $11,294 | $11,299 | $11,304 | $9,209 | $6,815 | $6,820 | $3,825 | $9,228 | |
| Net Profit | ($14,297) | $2,516 | $22,128 | $21,440 | $26,352 | $26,364 | $26,376 | $21,489 | $15,901 | $15,913 | $8,925 | $21,532 | |
| Net Profit/Sales | -11.62% | 1.64% | 12.43% | 11.28% | 12.92% | 12.80% | 12.80% | 11.31% | 8.93% | 8.99% | 5.41% | 11.33% | |
| Pro Forma Cash Flow | |||||||||||||
| Jan | Feb | Mar | Apr | May | Jun | Jul | Aug | Sep | Oct | Nov | Dec | ||
| Cash Received | |||||||||||||
| Cash from Operations | |||||||||||||
| Cash Sales | $123,000 | $153,000 | $178,000 | $190,000 | $204,000 | $206,000 | $206,000 | $190,000 | $178,000 | $177,000 | $165,000 | $190,000 | |
| Subtotal Cash from Operations | $123,000 | $153,000 | $178,000 | $190,000 | $204,000 | $206,000 | $206,000 | $190,000 | $178,000 | $177,000 | $165,000 | $190,000 | |
| Additional Cash Received | |||||||||||||
| Sales Tax, VAT, HST/GST Received | 0.00% | $0 | $0 | $0 | $0 | $0 | $0 | $0 | $0 | $0 | $0 | $0 | $0 |
| New Current Borrowing | $0 | $0 | $0 | $0 | $0 | $0 | $0 | $0 | $0 | $0 | $0 | $0 | |
| New Other Liabilities (interest-free) | $0 | $0 | $0 | $0 | $0 | $0 | $0 | $0 | $0 | $0 | $0 | $0 | |
| New Long-term Liabilities | $0 | $0 | $0 | $0 | $0 | $0 | $0 | $0 | $0 | $0 | $0 | $0 | |
| Sales of Other Current Assets | $0 | $0 | $0 | $0 | $0 | $0 | $0 | $0 | $0 | $0 | $0 | $0 | |
| Sales of Long-term Assets | $0 | $0 | $0 | $0 | $0 | $0 | $0 | $0 | $0 | $0 | $0 | $0 | |
| New Investment Received | $0 | $0 | $0 | $0 | $0 | $0 | $0 | $0 | $0 | $0 | $0 | $0 | |
| Subtotal Cash Received | $123,000 | $153,000 | $178,000 | $190,000 | $204,000 | $206,000 | $206,000 | $190,000 | $178,000 | $177,000 | $165,000 | $190,000 | |
| Expenditures | Jan | Feb | Mar | Apr | May | Jun | Jul | Aug | Sep | Oct | Nov | Dec | |
| Expenditures from Operations | |||||||||||||
| Cash Spending | $73,500 | $73,500 | $73,500 | $73,500 | $73,500 | $73,500 | $73,500 | $73,500 | $73,500 | $73,500 | $73,500 | $73,500 | |
| Bill Payments | $61,993 | $60,236 | $73,164 | $78,795 | $91,363 | $100,214 | $102,135 | $101,753 | $90,798 | $84,566 | $83,420 | $78,988 | |
| Subtotal Spent on Operations | $135,493 | $133,736 | $146,664 | $152,295 | $164,863 | $173,714 | $175,635 | $175,253 | $164,298 | $158,066 | $156,920 | $152,488 | |
| Additional Cash Spent | |||||||||||||
| Sales Tax, VAT, HST/GST Paid Out | $0 | $0 | $0 | $0 | $0 | $0 | $0 | $0 | $0 | $0 | $0 | $0 | |
| Principal Repayment of Current Borrowing | $0 | $0 | $0 | $0 | $0 | $0 | $0 | $0 | $0 | $0 | $0 | $0 | |
| Other Liabilities Principal Repayment | $0 | $0 | $0 | $0 | $0 | $0 | $0 | $0 | $0 | $0 | $0 | $0 | |
| Long-term Liabilities Principal Repayment | $2,084 | $2,084 | $2,084 | $2,084 | $2,084 | $2,084 | $2,084 | $2,084 | $2,084 | $2,084 | $2,084 | $2,084 | |
| Purchase Other Current Assets | $0 | $0 | $0 | $0 | $0 | $0 | $0 | $0 | $0 | $0 | $0 | $0 | |
| Purchase Long-term Assets | $5,000 | $5,000 | $5,000 | $5,000 | $5,000 | $5,000 | $5,000 | $5,000 | $5,000 | $5,000 | $5,000 | $5,000 | |
| Dividends | $0 | $0 | $0 | $0 | $0 | $0 | $0 | $0 | $0 | $0 | $0 | $0 | |
| Subtotal Cash Spent | $142,577 | $140,820 | $153,748 | $159,379 | $171,947 | $180,798 | $182,719 | $182,337 | $171,382 | $165,150 | $164,004 | $159,572 | |
| Net Cash Flow | ($19,577) | $12,180 | $24,252 | $30,621 | $32,053 | $25,202 | $23,281 | $7,663 | $6,618 | $11,850 | $996 | $30,428 | |
| Cash Balance | $60,423 | $72,603 | $96,855 | $127,476 | $159,529 | $184,730 | $208,011 | $215,674 | $222,292 | $234,143 | $235,138 | $265,566 | |
| Pro Forma Balance Sheet | |||||||||||||
| Jan | Feb | Mar | Apr | May | Jun | Jul | Aug | Sep | Oct | Nov | Dec | ||
| Assets | Starting Balances | ||||||||||||
| Current Assets | |||||||||||||
| Cash | $80,000 | $60,423 | $72,603 | $96,855 | $127,476 | $159,529 | $184,730 | $208,011 | $215,674 | $222,292 | $234,143 | $235,138 | $265,566 |
| Other Current Assets | $50,000 | $50,000 | $50,000 | $50,000 | $50,000 | $50,000 | $50,000 | $50,000 | $50,000 | $50,000 | $50,000 | $50,000 | $50,000 |
| Total Current Assets | $130,000 | $110,423 | $122,603 | $146,855 | $177,476 | $209,529 | $234,730 | $258,011 | $265,674 | $272,292 | $284,143 | $285,138 | $315,566 |
| Long-term Assets | |||||||||||||
| Long-term Assets | $200,000 | $205,000 | $210,000 | $215,000 | $220,000 | $225,000 | $230,000 | $235,000 | $240,000 | $245,000 | $250,000 | $255,000 | $260,000 |
| Accumulated Depreciation | $30,000 | $34,000 | $38,000 | $42,000 | $46,000 | $50,000 | $54,000 | $58,000 | $62,000 | $66,000 | $70,000 | $74,000 | $78,000 |
| Total Long-term Assets | $170,000 | $171,000 | $172,000 | $173,000 | $174,000 | $175,000 | $176,000 | $177,000 | $178,000 | $179,000 | $180,000 | $181,000 | $182,000 |
| Total Assets | $300,000 | $281,423 | $294,603 | $319,855 | $351,476 | $384,529 | $410,730 | $435,011 | $443,674 | $451,292 | $464,143 | $466,138 | $497,566 |
| Liabilities and Capital | Jan | Feb | Mar | Apr | May | Jun | Jul | Aug | Sep | Oct | Nov | Dec | |
| Current Liabilities | |||||||||||||
| Accounts Payable | $60,000 | $57,803 | $70,552 | $75,760 | $88,025 | $96,810 | $98,731 | $98,719 | $87,978 | $81,779 | $80,801 | $75,956 | $87,936 |
| Current Borrowing | $0 | $0 | $0 | $0 | $0 | $0 | $0 | $0 | $0 | $0 | $0 | $0 | $0 |
| Other Current Liabilities | $0 | $0 | $0 | $0 | $0 | $0 | $0 | $0 | $0 | $0 | $0 | $0 | $0 |
| Subtotal Current Liabilities | $60,000 | $57,803 | $70,552 | $75,760 | $88,025 | $96,810 | $98,731 | $98,719 | $87,978 | $81,779 | $80,801 | $75,956 | $87,936 |
| Long-term Liabilities | $150,000 | $147,916 | $145,832 | $143,748 | $141,664 | $139,580 | $137,496 | $135,412 | $133,328 | $131,244 | $129,160 | $127,076 | $124,992 |
| Total Liabilities | $210,000 | $205,719 | $216,384 | $219,508 | $229,689 | $236,390 | $236,227 | $234,131 | $221,306 | $213,023 | $209,961 | $203,032 | $212,928 |
| Paid-in Capital | $0 | $0 | $0 | $0 | $0 | $0 | $0 | $0 | $0 | $0 | $0 | $0 | $0 |
| Retained Earnings | $90,000 | $90,000 | $90,000 | $90,000 | $90,000 | $90,000 | $90,000 | $90,000 | $90,000 | $90,000 | $90,000 | $90,000 | $90,000 |
| Earnings | $0 | ($14,297) | ($11,781) | $10,347 | $31,787 | $58,139 | $84,503 | $110,879 | $132,368 | $148,269 | $164,182 | $173,107 | $194,638 |
| Total Capital | $90,000 | $75,703 | $78,219 | $100,347 | $121,787 | $148,139 | $174,503 | $200,879 | $222,368 | $238,269 | $254,182 | $263,107 | $284,638 |
| Total Liabilities and Capital | $300,000 | $281,423 | $294,603 | $319,855 | $351,476 | $384,529 | $410,730 | $435,011 | $443,674 | $451,292 | $464,143 | $466,138 | $497,566 |
| Net Worth | $90,000 | $75,703 | $78,219 | $100,347 | $121,787 | $148,139 | $174,503 | $200,879 | $222,368 | $238,269 | $254,182 | $263,107 | $284,638 |


