
TLC Wedding Consultants
Executive Summary
TLC Wedding Consultants is a full service company that provides complete consulting services for weddings, holy unions and anniversaries. Our consultants are experienced and dedicated professionals with many years of event planning experience. TLC is unique in that we give our clients our undivided attention. We listen to their needs and work with them to create the event of their dreams. Our clients’ wishes become our commands. So whether our client wants a Western, Tropical, Las Vegas or more traditional wedding, we can help. Our services include weddings, honeymoons, receptions, anniversary consultations, budget planning, answers to etiquette questions, as well as full-service referrals to florists, hair stylists, entertainers, musicians, etc.
1.1 Mission
TLC Wedding Consultants is a full service company that provides complete consulting services for weddings, holy unions and anniversaries. Our consultants are experienced and dedicated professionals with many years of event planning experience. TLC is unique in that we give our clients our undivided attention. We listen to their needs and work with them to create the event of their dreams. Our clients’ wishes become our commands. So whether our client wants a Western, Tropical, Las Vegas or more traditional wedding or anniversary party, we can help. Our services include weddings, honeymoons, receptions, anniversary consultations, budget planning, answers to etiquette questions, as well as full-service referrals to florists, hair stylists, entertainers, musicians, etc.
1.2 Objectives
Whether this is our client’s first wedding, a renewal of their vows or their anniversary, we want every detail of their event to be both a pleasurable and a memorable experience. Therefore we offer a host of packages and services specifically tailored to the needs of each couple. We are confident that this business venture will be a success and we estimate that our net income will increase modestly by the second year.
1.3 Keys to Success
The keys to our success are as follows:
- Service our clients’ needs promptly and efficiently.
- Maintain an excellent working relationships with vendors such as florists, hair salons and bridal shops.
- Maintain a professional image at all times.
Company Summary
TLC Wedding Consultants is a start-up company that provides wedding, holy union, and anniversary consulting services to brides, grooms and other family members. We are a full-service bridal consulting group and our goal is to put the “fun” back into planning a wedding, holy union or anniversary party. Too many people become overly stressed and frustrated when planning these wonderful events. We are experienced and professional consultants and will use our expertise to help create memorable and stress free events for our customers. By doing this, our clients can sit back and enjoy their event. The result? We create events suited to the couple’s unique style–a true expression of their relationship and individuality as a couple.
2.1 Company Ownership
This business will start out as a simple proprietorship, owned by its founders, Darla and Micah Johnson. As the operation grows, the owners will consider re-registering as a limited liability company or as a corporation, whichever will better suite the future business needs.
2.2 Start-up Summary
The company founders, Darla and Micah Johnson, will handle day-to-day operations of the plan and will work collaboratively to ensure that this business venture is a success.
We estimate that our start-up costs will be $3,000 (including legal costs, logo design, advertising, direct mail, and related expenses). An additional $5,000 will be required in the bank account as an operating capital for the first two months of operation. The start-up costs are to be financed in equal portions by the owners’ personal funds (i.e., Darla and Micah Johnson are investing $4,000 each).

| Start-up | |
| Requirements | |
| Start-up Expenses | |
| Legal | $200 |
| Stationery etc. | $450 |
| Brochures | $450 |
| Insurance | $300 |
| Research and development | $200 |
| Expensed equipment | $900 |
| Other | $500 |
| Total Start-up Expenses | $3,000 |
| Start-up Assets | |
| Cash Required | $5,000 |
| Other Current Assets | $0 |
| Long-term Assets | $0 |
| Total Assets | $5,000 |
| Total Requirements | $8,000 |
| Start-up Funding | |
| Start-up Expenses to Fund | $3,000 |
| Start-up Assets to Fund | $5,000 |
| Total Funding Required | $8,000 |
| Assets | |
| Non-cash Assets from Start-up | $0 |
| Cash Requirements from Start-up | $5,000 |
| Additional Cash Raised | $0 |
| Cash Balance on Starting Date | $5,000 |
| Total Assets | $5,000 |
| Liabilities and Capital | |
| Liabilities | |
| Current Borrowing | $0 |
| Long-term Liabilities | $0 |
| Accounts Payable (Outstanding Bills) | $0 |
| Other Current Liabilities (interest-free) | $0 |
| Total Liabilities | $0 |
| Capital | |
| Planned Investment | |
| Darla Johnson | $4,000 |
| Micah Johnson | $4,000 |
| Additional Investment Requirement | $0 |
| Total Planned Investment | $8,000 |
| Loss at Start-up (Start-up Expenses) | ($3,000) |
| Total Capital | $5,000 |
| Total Capital and Liabilities | $5,000 |
| Total Funding | $8,000 |
2.3 Company Locations and Facilities
Initially this will be a home-based business; however, by Year 5, we intend to expand our facilities into a well-equipped and operational office.
Services
We are a full-service wedding consultant group and provide the following services: etiquette advice, event scheduling, discounted invitations and products, vendor confirmation, rehearsal attendance, supervision of both ceremony and reception setup and budget planning.
Market Analysis Summary
Nearly $35 billion are spent every year on weddings and receptions. Therefore, professional wedding consultants are a commodity, not a calamity. TLC Wedding Consultants are full-service wedding consultants that offer a variety of services to our clients. We pride ourselves on being professional and courteous at all times and we have packages to suit everyone’s needs.
As previously stated, marriage is a billion dollar industry, therefore, just about everyone we meet is a potential client. However, we mostly advertise to brides, grooms, and family members.
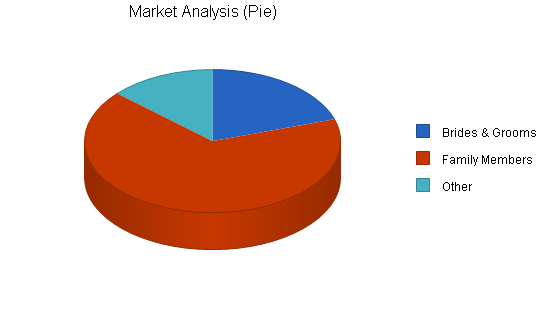
4.1 Market Segmentation
Although the flash and excitement of impending nuptials can be intoxicating, it can also be overwhelming. Therefore, we primarily market our services to the people who need them most–brides and grooms. In 1997, 2.4 million marriages took place in the United States. According to the Encarta Encyclopedia, the current US marriage rate of nine marriages per 1,000 people is still the highest rate among the industrialized countries. This marriage rate is expected to remain at the same level in the near future. In the Eugene, OR area where TLC Wedding Consultants plans to operate their business, over 1,500 marriages are registered each year, which creates a sizable market potential for this line of business.
Another customer segment is represented by the numerous family members and guests attending weddings, anniversaries, and similar events. This segment requires event preparation services like gift ideas, etiquette tips, etc.
Besides the wedding arrangements, which TLC Wedding Consultants believe to be their major client assignments, other events the company will provide services to include corporate retreats, etiquette training, etc. This customer segment is estimated to have the annual volume of 1,000 orders in the Eugene, OR area.
| Market Analysis | |||||||
| Year 1 | Year 2 | Year 3 | Year 4 | Year 5 | |||
| Potential Customers | Growth | CAGR | |||||
| Brides & Grooms | 5% | 1,500 | 1,575 | 1,654 | 1,737 | 1,824 | 5.01% |
| Family Members | 5% | 5,000 | 5,250 | 5,513 | 5,789 | 6,078 | 5.00% |
| Other | 5% | 1,000 | 1,050 | 1,103 | 1,158 | 1,216 | 5.01% |
| Total | 5.00% | 7,500 | 7,875 | 8,270 | 8,684 | 9,118 | 5.00% |
4.2 Target Market Segment Strategy
TLC Wedding Consultants will offer its services mostly to the brides and grooms, as well as to the family members. The company will position itself as an experienced provider of wedding planning services. Unlike most of its competitors, TLC will be offering a full range of services and thus provide the convenience of one-stop shopping for its clients. This will significantly reduce the customers’ time and efforts preparing for such an important event as a wedding. Moreover, by utilizing numerous supplier contacts that the company owners have established and economies of scale, TLC Wedding Consultants will be able to pass on to its customers sizable cost savings.
4.2.1 Market Needs
The market needs for wedding planning services are strongly shaped by the customers’ desire to have a perfectly planned and executed wedding ceremony. Although both major customer segments, brides and grooms and family members, plan and budget for the wedding ceremony as far as a year or more in advance, they often realize that they cannot make all the necessary preparations by themselves in a cost effective manner. Strongly affected by the established social values, such customers seek professional advice to ensure that all the important aspects of the wedding ceremony meet or exceed perceived expectations.
Brought to you by
Create a professional business plan
Using AI and step-by-step instructions
Create Your PlanSecure funding
Validate ideas
Build a strategy
4.3 Service Business Analysis
The wedding services market is fragmented with the overwhelming majority of the incumbents offering only a limited line of services. There are numerous florists, hair stylists, and caterers to choose from. However, there are almost no companies that will provide the full range of services associated with the wedding planning and execution.
4.3.1 Competition and Buying Patterns
Competitive analysis conducted by the company owners has shown that there are 20 companies currently offering some sort of wedding planning services in the Eugene area. However, the majority of the incumbent competitors offer only a limited line of services like catering, flower arrangements or gifts. In fact, of these 25 competitors only three offered a range of services comparable with what TLC Wedding Consultants plan to offer to its customers. The following is the list of the major competitors with a brief description of their services:
- Rent-An-Action offers ceremony preparation, rehearsing and execution services.
- Cross & Reeves provide flower and catering arrangements and wedding consulting services.
- Lafayette Wedding offers its clients entertaining, catering, floral design and hair styling services.
The market research has also shown that customers anticipate the complete wedding consulting services to be expensive and they budget accordingly. In fact, lower prices are very often associated with poor service quality. By aggregating a complete range of wedding services under one roof, TLC Wedding Consultants will offer its customers the ease of one-stop shopping.
Strategy and Implementation Summary
Our strategy is simple: we intend to provide our customers with a wide range of services custom tailored to their individual needs. Therefore, whether they require a complete package, or simply consulting on a particular service, we can help.
5.1 Competitive Edge
By aggregating a complete range of wedding services under one roof, TLC Wedding Consultants will offer its customers the ease of one-stop shopping. The company will leverage its owners’ expertise in planning such events to competitively position itself as a premier provider of wedding services. Both owners have very strong communication skills that will help develop the ‘buzz’ about the high quality of the services offered by TLC Wedding Consultants.
5.2 Sales Strategy
The company’s sales strategy will be based on the following elements:
- Advertising in the Yellow Pages – two inch by three inch ads describing the services will be placed in the local Yellow Pages.
- Placing advertisements in the local press, including The Register Guard, Eugene Weekly, The Oregon Daily Emerald.
- Developing affiliate relationships with other service providers (florists, hair stylists, caterers) that would receive a percentage of sales to the referred customers.
- Word of mouth referrals – generating sales leads in the local community through customer referrals.


| Sales Forecast | |||
| Year 1 | Year 2 | Year 3 | |
| Sales | |||
| Brides & Grooms | $54,200 | $65,040 | $71,544 |
| Family Members | $25,800 | $30,960 | $34,056 |
| Other | $15,300 | $18,360 | $20,196 |
| Total Sales | $95,300 | $114,360 | $125,796 |
| Direct Cost of Sales | Year 1 | Year 2 | Year 3 |
| Row 1 | $0 | $0 | $0 |
| Row 1 | $0 | $0 | $0 |
| Other | $0 | $0 | $0 |
| Subtotal Direct Cost of Sales | $0 | $0 | $0 |
Management Summary
Our wedding consultants are Darla and Micah Johnson. Collaboratively they have planned and serviced over 150 weddings and receptions. They are knowledgeable about all areas of planning, decorating, as well as budgeting. Darla has a BS in Communications and a minor in Interior Decorating. She has been a wedding consultant for five years and became interested in providing consultant services when she successfully planned her first five weddings for family and friends. Since then, Darla has received extensive training in wedding planning and her certification from the National Association of Wedding Consultants and Professional Wedding Planners. Micah has an Associates Degree in Fashion Design, and, like Darla, she became interested in becoming a consultant when she successfully planned her first three weddings. Micah received her certification from the National Association of Wedding Consultants and has been a wedding planner for three years. Micah enjoys all aspects of planning traditional and nontraditional weddings.
6.1 Personnel Plan
Initially, TLC Wedding Consultants’ personnel will include only the two owners, both of whom will be working full time. As the personnel plan shows, we expect to hire an additional wedding consultant in the next year This person will work full time, but will not be included in the management decisions.
| Personnel Plan | |||
| Year 1 | Year 2 | Year 3 | |
| Owner | $53,100 | $76,200 | $85,800 |
| Other | $0 | $0 | $0 |
| Total People | 0 | 0 | 0 |
| Total Payroll | $53,100 | $76,200 | $85,800 |
Financial Plan
The following subtopics represent the financial plan of TLC Wedding Consultants.
7.1 Break-even Analysis
The following table and chart summarize our break-even analysis.

| Break-even Analysis | |
| Monthly Revenue Break-even | $4,804 |
| Assumptions: | |
| Average Percent Variable Cost | 0% |
| Estimated Monthly Fixed Cost | $4,804 |
7.2 Projected Profit and Loss
Our projected profit and loss is shown in the following table.


| Pro Forma Profit and Loss | |||
| Year 1 | Year 2 | Year 3 | |
| Sales | $95,300 | $114,360 | $125,796 |
| Direct Cost of Sales | $0 | $0 | $0 |
| Other | $0 | $0 | $0 |
| Total Cost of Sales | $0 | $0 | $0 |
| Gross Margin | $95,300 | $114,360 | $125,796 |
| Gross Margin % | 100.00% | 100.00% | 100.00% |
| Expenses | |||
| Payroll | $53,100 | $76,200 | $85,800 |
| Sales and Marketing and Other Expenses | $4,550 | $1,000 | $2,000 |
| Depreciation | $0 | $0 | $0 |
| Leased Equipment | $0 | $0 | $0 |
| Utilities | $0 | $0 | $0 |
| Insurance | $0 | $0 | $0 |
| Rent | $0 | $0 | $0 |
| Payroll Taxes | $0 | $0 | $0 |
| Other | $0 | $0 | $0 |
| Total Operating Expenses | $57,650 | $77,200 | $87,800 |
| Profit Before Interest and Taxes | $37,650 | $37,160 | $37,996 |
| EBITDA | $37,650 | $37,160 | $37,996 |
| Interest Expense | $0 | $0 | $0 |
| Taxes Incurred | $9,443 | $9,290 | $9,657 |
| Net Profit | $28,208 | $27,870 | $28,339 |
| Net Profit/Sales | 29.60% | 24.37% | 22.53% |
7.3 Projected Cash Flow
The following chart and table show our cash flow projections.

| Pro Forma Cash Flow | |||
| Year 1 | Year 2 | Year 3 | |
| Cash Received | |||
| Cash from Operations | |||
| Cash Sales | $38,120 | $45,744 | $50,318 |
| Cash from Receivables | $45,494 | $66,279 | $74,075 |
| Subtotal Cash from Operations | $83,614 | $112,023 | $124,394 |
| Additional Cash Received | |||
| Sales Tax, VAT, HST/GST Received | $0 | $0 | $0 |
| New Current Borrowing | $0 | $0 | $0 |
| New Other Liabilities (interest-free) | $0 | $0 | $0 |
| New Long-term Liabilities | $0 | $0 | $0 |
| Sales of Other Current Assets | $0 | $0 | $0 |
| Sales of Long-term Assets | $0 | $0 | $0 |
| New Investment Received | $0 | $0 | $0 |
| Subtotal Cash Received | $83,614 | $112,023 | $124,394 |
| Expenditures | Year 1 | Year 2 | Year 3 |
| Expenditures from Operations | |||
| Cash Spending | $53,100 | $76,200 | $85,800 |
| Bill Payments | $12,748 | $10,689 | $11,545 |
| Subtotal Spent on Operations | $65,848 | $86,889 | $97,345 |
| Additional Cash Spent | |||
| Sales Tax, VAT, HST/GST Paid Out | $0 | $0 | $0 |
| Principal Repayment of Current Borrowing | $0 | $0 | $0 |
| Other Liabilities Principal Repayment | $0 | $0 | $0 |
| Long-term Liabilities Principal Repayment | $0 | $0 | $0 |
| Purchase Other Current Assets | $0 | $0 | $0 |
| Purchase Long-term Assets | $0 | $0 | $0 |
| Dividends | $0 | $0 | $0 |
| Subtotal Cash Spent | $65,848 | $86,889 | $97,345 |
| Net Cash Flow | $17,766 | $25,134 | $27,049 |
| Cash Balance | $22,766 | $47,900 | $74,949 |
| General Assumptions | |||
| Year 1 | Year 2 | Year 3 | |
| Plan Month | 1 | 2 | 3 |
| Current Interest Rate | 10.00% | 10.00% | 10.00% |
| Long-term Interest Rate | 10.00% | 10.00% | 10.00% |
| Tax Rate | 25.42% | 25.00% | 25.42% |
| Other | 0 | 0 | 0 |
7.4 Projected Balance Sheet
Three years of annual totals are presented in the Projected Balance Sheet below. First year monthly figures are included in the appendix.
| Pro Forma Balance Sheet | |||
| Year 1 | Year 2 | Year 3 | |
| Assets | |||
| Current Assets | |||
| Cash | $22,766 | $47,900 | $74,949 |
| Accounts Receivable | $11,686 | $14,023 | $15,426 |
| Other Current Assets | $0 | $0 | $0 |
| Total Current Assets | $34,452 | $61,923 | $90,374 |
| Long-term Assets | |||
| Long-term Assets | $0 | $0 | $0 |
| Accumulated Depreciation | $0 | $0 | $0 |
| Total Long-term Assets | $0 | $0 | $0 |
| Total Assets | $34,452 | $61,923 | $90,374 |
| Liabilities and Capital | Year 1 | Year 2 | Year 3 |
| Current Liabilities | |||
| Accounts Payable | $1,245 | $846 | $958 |
| Current Borrowing | $0 | $0 | $0 |
| Other Current Liabilities | $0 | $0 | $0 |
| Subtotal Current Liabilities | $1,245 | $846 | $958 |
| Long-term Liabilities | $0 | $0 | $0 |
| Total Liabilities | $1,245 | $846 | $958 |
| Paid-in Capital | $8,000 | $8,000 | $8,000 |
| Retained Earnings | ($3,000) | $25,208 | $53,078 |
| Earnings | $28,208 | $27,870 | $28,339 |
| Total Capital | $33,208 | $61,078 | $89,416 |
| Total Liabilities and Capital | $34,452 | $61,923 | $90,374 |
| Net Worth | $33,207 | $61,078 | $89,416 |
7.5 Business Ratios
The following table outlines some of the more important ratios from the Personal Services industry. The final column, Industry Profile, details specific ratios based on the industry as it is classified by the Standard Industry Classification (SIC) code, 7299.
| Ratio Analysis | ||||
| Year 1 | Year 2 | Year 3 | Industry Profile | |
| Sales Growth | 0.00% | 20.00% | 10.00% | 17.90% |
| Percent of Total Assets | ||||
| Accounts Receivable | 33.92% | 22.65% | 17.07% | 11.10% |
| Other Current Assets | 0.00% | 0.00% | 0.00% | 37.10% |
| Total Current Assets | 100.00% | 100.00% | 100.00% | 52.80% |
| Long-term Assets | 0.00% | 0.00% | 0.00% | 47.20% |
| Total Assets | 100.00% | 100.00% | 100.00% | 100.00% |
| Current Liabilities | 3.61% | 1.37% | 1.06% | 33.90% |
| Long-term Liabilities | 0.00% | 0.00% | 0.00% | 28.00% |
| Total Liabilities | 3.61% | 1.37% | 1.06% | 61.90% |
| Net Worth | 96.39% | 98.63% | 98.94% | 38.10% |
| Percent of Sales | ||||
| Sales | 100.00% | 100.00% | 100.00% | 100.00% |
| Gross Margin | 100.00% | 100.00% | 100.00% | 0.00% |
| Selling, General & Administrative Expenses | 70.37% | 75.63% | 77.35% | 72.70% |
| Advertising Expenses | 3.52% | 0.87% | 1.59% | 2.20% |
| Profit Before Interest and Taxes | 39.51% | 32.49% | 30.20% | 4.00% |
| Main Ratios | ||||
| Current | 27.68 | 73.22 | 94.32 | 1.81 |
| Quick | 27.68 | 73.22 | 94.32 | 1.33 |
| Total Debt to Total Assets | 3.61% | 1.37% | 1.06% | 61.90% |
| Pre-tax Return on Net Worth | 113.38% | 60.84% | 42.49% | 6.30% |
| Pre-tax Return on Assets | 109.28% | 60.01% | 42.04% | 16.60% |
| Additional Ratios | Year 1 | Year 2 | Year 3 | |
| Net Profit Margin | 29.60% | 24.37% | 22.53% | n.a |
| Return on Equity | 84.94% | 45.63% | 31.69% | n.a |
| Activity Ratios | ||||
| Accounts Receivable Turnover | 4.89 | 4.89 | 4.89 | n.a |
| Collection Days | 57 | 68 | 71 | n.a |
| Accounts Payable Turnover | 11.24 | 12.17 | 12.17 | n.a |
| Payment Days | 27 | 37 | 28 | n.a |
| Total Asset Turnover | 2.77 | 1.85 | 1.39 | n.a |
| Debt Ratios | ||||
| Debt to Net Worth | 0.04 | 0.01 | 0.01 | n.a |
| Current Liab. to Liab. | 1.00 | 1.00 | 1.00 | n.a |
| Liquidity Ratios | ||||
| Net Working Capital | $33,207 | $61,078 | $89,416 | n.a |
| Interest Coverage | 0.00 | 0.00 | 0.00 | n.a |
| Additional Ratios | ||||
| Assets to Sales | 0.36 | 0.54 | 0.72 | n.a |
| Current Debt/Total Assets | 4% | 1% | 1% | n.a |
| Acid Test | 18.29 | 56.64 | 78.22 | n.a |
| Sales/Net Worth | 2.87 | 1.87 | 1.41 | n.a |
| Dividend Payout | 0.00 | 0.00 | 0.00 | n.a |
Brought to you by
Create a professional business plan
Using AI and step-by-step instructions
Create Your PlanSecure funding
Validate ideas
Build a strategy
Appendix
| Sales Forecast | |||||||||||||
| Month 1 | Month 2 | Month 3 | Month 4 | Month 5 | Month 6 | Month 7 | Month 8 | Month 9 | Month 10 | Month 11 | Month 12 | ||
| Sales | |||||||||||||
| Brides & Grooms | 0% | $2,900 | $3,100 | $3,300 | $3,500 | $4,000 | $5,400 | $4,600 | $5,000 | $5,200 | $5,500 | $5,700 | $6,000 |
| Family Members | 0% | $1,600 | $1,700 | $1,800 | $1,900 | $2,000 | $2,100 | $2,200 | $2,300 | $2,400 | $2,500 | $2,600 | $2,700 |
| Other | 0% | $1,200 | $1,200 | $1,200 | $1,200 | $1,200 | $1,300 | $1,300 | $1,300 | $1,300 | $1,300 | $1,400 | $1,400 |
| Total Sales | $5,700 | $6,000 | $6,300 | $6,600 | $7,200 | $8,800 | $8,100 | $8,600 | $8,900 | $9,300 | $9,700 | $10,100 | |
| Direct Cost of Sales | Month 1 | Month 2 | Month 3 | Month 4 | Month 5 | Month 6 | Month 7 | Month 8 | Month 9 | Month 10 | Month 11 | Month 12 | |
| Row 1 | $0 | $0 | $0 | $0 | $0 | $0 | $0 | $0 | $0 | $0 | $0 | $0 | |
| Row 1 | $0 | $0 | $0 | $0 | $0 | $0 | $0 | $0 | $0 | $0 | $0 | $0 | |
| Other | $0 | $0 | $0 | $0 | $0 | $0 | $0 | $0 | $0 | $0 | $0 | $0 | |
| Subtotal Direct Cost of Sales | $0 | $0 | $0 | $0 | $0 | $0 | $0 | $0 | $0 | $0 | $0 | $0 | |
| Personnel Plan | |||||||||||||
| Month 1 | Month 2 | Month 3 | Month 4 | Month 5 | Month 6 | Month 7 | Month 8 | Month 9 | Month 10 | Month 11 | Month 12 | ||
| Owner | 0% | $4,000 | $4,000 | $4,000 | $4,000 | $4,000 | $4,000 | $4,000 | $4,000 | $4,000 | $5,700 | $5,700 | $5,700 |
| Other | 0% | $0 | $0 | $0 | $0 | $0 | $0 | $0 | $0 | $0 | $0 | $0 | $0 |
| Total People | 0 | 0 | 0 | 0 | 0 | 0 | 0 | 0 | 0 | 0 | 0 | 0 | |
| Total Payroll | $4,000 | $4,000 | $4,000 | $4,000 | $4,000 | $4,000 | $4,000 | $4,000 | $4,000 | $5,700 | $5,700 | $5,700 | |
| General Assumptions | |||||||||||||
| Month 1 | Month 2 | Month 3 | Month 4 | Month 5 | Month 6 | Month 7 | Month 8 | Month 9 | Month 10 | Month 11 | Month 12 | ||
| Plan Month | 1 | 2 | 3 | 4 | 5 | 6 | 7 | 8 | 9 | 10 | 11 | 12 | |
| Current Interest Rate | 10.00% | 10.00% | 10.00% | 10.00% | 10.00% | 10.00% | 10.00% | 10.00% | 10.00% | 10.00% | 10.00% | 10.00% | |
| Long-term Interest Rate | 10.00% | 10.00% | 10.00% | 10.00% | 10.00% | 10.00% | 10.00% | 10.00% | 10.00% | 10.00% | 10.00% | 10.00% | |
| Tax Rate | 30.00% | 25.00% | 25.00% | 25.00% | 25.00% | 25.00% | 25.00% | 25.00% | 25.00% | 25.00% | 25.00% | 25.00% | |
| Other | 0 | 0 | 0 | 0 | 0 | 0 | 0 | 0 | 0 | 0 | 0 | 0 | |
| Pro Forma Profit and Loss | |||||||||||||
| Month 1 | Month 2 | Month 3 | Month 4 | Month 5 | Month 6 | Month 7 | Month 8 | Month 9 | Month 10 | Month 11 | Month 12 | ||
| Sales | $5,700 | $6,000 | $6,300 | $6,600 | $7,200 | $8,800 | $8,100 | $8,600 | $8,900 | $9,300 | $9,700 | $10,100 | |
| Direct Cost of Sales | $0 | $0 | $0 | $0 | $0 | $0 | $0 | $0 | $0 | $0 | $0 | $0 | |
| Other | $0 | $0 | $0 | $0 | $0 | $0 | $0 | $0 | $0 | $0 | $0 | $0 | |
| Total Cost of Sales | $0 | $0 | $0 | $0 | $0 | $0 | $0 | $0 | $0 | $0 | $0 | $0 | |
| Gross Margin | $5,700 | $6,000 | $6,300 | $6,600 | $7,200 | $8,800 | $8,100 | $8,600 | $8,900 | $9,300 | $9,700 | $10,100 | |
| Gross Margin % | 100.00% | 100.00% | 100.00% | 100.00% | 100.00% | 100.00% | 100.00% | 100.00% | 100.00% | 100.00% | 100.00% | 100.00% | |
| Expenses | |||||||||||||
| Payroll | $4,000 | $4,000 | $4,000 | $4,000 | $4,000 | $4,000 | $4,000 | $4,000 | $4,000 | $5,700 | $5,700 | $5,700 | |
| Sales and Marketing and Other Expenses | $1,100 | $250 | $250 | $250 | $600 | $250 | $250 | $250 | $600 | $250 | $250 | $250 | |
| Depreciation | $0 | $0 | $0 | $0 | $0 | $0 | $0 | $0 | $0 | $0 | $0 | $0 | |
| Leased Equipment | $0 | $0 | $0 | $0 | $0 | $0 | $0 | $0 | $0 | $0 | $0 | $0 | |
| Utilities | $0 | $0 | $0 | $0 | $0 | $0 | $0 | $0 | $0 | $0 | $0 | $0 | |
| Insurance | $0 | $0 | $0 | $0 | $0 | $0 | $0 | $0 | $0 | $0 | $0 | $0 | |
| Rent | $0 | $0 | $0 | $0 | $0 | $0 | $0 | $0 | $0 | $0 | $0 | $0 | |
| Payroll Taxes | 15% | $0 | $0 | $0 | $0 | $0 | $0 | $0 | $0 | $0 | $0 | $0 | $0 |
| Other | $0 | $0 | $0 | $0 | $0 | $0 | $0 | $0 | $0 | $0 | $0 | $0 | |
| Total Operating Expenses | $5,100 | $4,250 | $4,250 | $4,250 | $4,600 | $4,250 | $4,250 | $4,250 | $4,600 | $5,950 | $5,950 | $5,950 | |
| Profit Before Interest and Taxes | $600 | $1,750 | $2,050 | $2,350 | $2,600 | $4,550 | $3,850 | $4,350 | $4,300 | $3,350 | $3,750 | $4,150 | |
| EBITDA | $600 | $1,750 | $2,050 | $2,350 | $2,600 | $4,550 | $3,850 | $4,350 | $4,300 | $3,350 | $3,750 | $4,150 | |
| Interest Expense | $0 | $0 | $0 | $0 | $0 | $0 | $0 | $0 | $0 | $0 | $0 | $0 | |
| Taxes Incurred | $180 | $438 | $513 | $588 | $650 | $1,138 | $963 | $1,088 | $1,075 | $838 | $938 | $1,038 | |
| Net Profit | $420 | $1,313 | $1,538 | $1,763 | $1,950 | $3,413 | $2,888 | $3,263 | $3,225 | $2,513 | $2,813 | $3,113 | |
| Net Profit/Sales | 7.37% | 21.88% | 24.40% | 26.70% | 27.08% | 38.78% | 35.65% | 37.94% | 36.24% | 27.02% | 28.99% | 30.82% | |
| Pro Forma Cash Flow | |||||||||||||
| Month 1 | Month 2 | Month 3 | Month 4 | Month 5 | Month 6 | Month 7 | Month 8 | Month 9 | Month 10 | Month 11 | Month 12 | ||
| Cash Received | |||||||||||||
| Cash from Operations | |||||||||||||
| Cash Sales | $2,280 | $2,400 | $2,520 | $2,640 | $2,880 | $3,520 | $3,240 | $3,440 | $3,560 | $3,720 | $3,880 | $4,040 | |
| Cash from Receivables | $0 | $114 | $3,426 | $3,606 | $3,786 | $3,972 | $4,352 | $5,266 | $4,870 | $5,166 | $5,348 | $5,588 | |
| Subtotal Cash from Operations | $2,280 | $2,514 | $5,946 | $6,246 | $6,666 | $7,492 | $7,592 | $8,706 | $8,430 | $8,886 | $9,228 | $9,628 | |
| Additional Cash Received | |||||||||||||
| Sales Tax, VAT, HST/GST Received | 0.00% | $0 | $0 | $0 | $0 | $0 | $0 | $0 | $0 | $0 | $0 | $0 | $0 |
| New Current Borrowing | $0 | $0 | $0 | $0 | $0 | $0 | $0 | $0 | $0 | $0 | $0 | $0 | |
| New Other Liabilities (interest-free) | $0 | $0 | $0 | $0 | $0 | $0 | $0 | $0 | $0 | $0 | $0 | $0 | |
| New Long-term Liabilities | $0 | $0 | $0 | $0 | $0 | $0 | $0 | $0 | $0 | $0 | $0 | $0 | |
| Sales of Other Current Assets | $0 | $0 | $0 | $0 | $0 | $0 | $0 | $0 | $0 | $0 | $0 | $0 | |
| Sales of Long-term Assets | $0 | $0 | $0 | $0 | $0 | $0 | $0 | $0 | $0 | $0 | $0 | $0 | |
| New Investment Received | $0 | $0 | $0 | $0 | $0 | $0 | $0 | $0 | $0 | $0 | $0 | $0 | |
| Subtotal Cash Received | $2,280 | $2,514 | $5,946 | $6,246 | $6,666 | $7,492 | $7,592 | $8,706 | $8,430 | $8,886 | $9,228 | $9,628 | |
| Expenditures | Month 1 | Month 2 | Month 3 | Month 4 | Month 5 | Month 6 | Month 7 | Month 8 | Month 9 | Month 10 | Month 11 | Month 12 | |
| Expenditures from Operations | |||||||||||||
| Cash Spending | $4,000 | $4,000 | $4,000 | $4,000 | $4,000 | $4,000 | $4,000 | $4,000 | $4,000 | $5,700 | $5,700 | $5,700 | |
| Bill Payments | $43 | $1,260 | $690 | $765 | $851 | $1,255 | $1,382 | $1,217 | $1,349 | $1,655 | $1,091 | $1,191 | |
| Subtotal Spent on Operations | $4,043 | $5,260 | $4,690 | $4,765 | $4,851 | $5,255 | $5,382 | $5,217 | $5,349 | $7,355 | $6,791 | $6,891 | |
| Additional Cash Spent | |||||||||||||
| Sales Tax, VAT, HST/GST Paid Out | $0 | $0 | $0 | $0 | $0 | $0 | $0 | $0 | $0 | $0 | $0 | $0 | |
| Principal Repayment of Current Borrowing | $0 | $0 | $0 | $0 | $0 | $0 | $0 | $0 | $0 | $0 | $0 | $0 | |
| Other Liabilities Principal Repayment | $0 | $0 | $0 | $0 | $0 | $0 | $0 | $0 | $0 | $0 | $0 | $0 | |
| Long-term Liabilities Principal Repayment | $0 | $0 | $0 | $0 | $0 | $0 | $0 | $0 | $0 | $0 | $0 | $0 | |
| Purchase Other Current Assets | $0 | $0 | $0 | $0 | $0 | $0 | $0 | $0 | $0 | $0 | $0 | $0 | |
| Purchase Long-term Assets | $0 | $0 | $0 | $0 | $0 | $0 | $0 | $0 | $0 | $0 | $0 | $0 | |
| Dividends | $0 | $0 | $0 | $0 | $0 | $0 | $0 | $0 | $0 | $0 | $0 | $0 | |
| Subtotal Cash Spent | $4,043 | $5,260 | $4,690 | $4,765 | $4,851 | $5,255 | $5,382 | $5,217 | $5,349 | $7,355 | $6,791 | $6,891 | |
| Net Cash Flow | ($1,763) | ($2,746) | $1,256 | $1,481 | $1,815 | $2,237 | $2,210 | $3,489 | $3,081 | $1,531 | $2,437 | $2,737 | |
| Cash Balance | $3,237 | $491 | $1,747 | $3,228 | $5,043 | $7,280 | $9,491 | $12,980 | $16,061 | $17,592 | $20,029 | $22,766 | |
| Pro Forma Balance Sheet | |||||||||||||
| Month 1 | Month 2 | Month 3 | Month 4 | Month 5 | Month 6 | Month 7 | Month 8 | Month 9 | Month 10 | Month 11 | Month 12 | ||
| Assets | Starting Balances | ||||||||||||
| Current Assets | |||||||||||||
| Cash | $5,000 | $3,237 | $491 | $1,747 | $3,228 | $5,043 | $7,280 | $9,491 | $12,980 | $16,061 | $17,592 | $20,029 | $22,766 |
| Accounts Receivable | $0 | $3,420 | $6,906 | $7,260 | $7,614 | $8,148 | $9,456 | $9,964 | $9,858 | $10,328 | $10,742 | $11,214 | $11,686 |
| Other Current Assets | $0 | $0 | $0 | $0 | $0 | $0 | $0 | $0 | $0 | $0 | $0 | $0 | $0 |
| Total Current Assets | $5,000 | $6,657 | $7,397 | $9,007 | $10,842 | $13,191 | $16,736 | $19,455 | $22,838 | $26,389 | $28,334 | $31,243 | $34,452 |
| Long-term Assets | |||||||||||||
| Long-term Assets | $0 | $0 | $0 | $0 | $0 | $0 | $0 | $0 | $0 | $0 | $0 | $0 | $0 |
| Accumulated Depreciation | $0 | $0 | $0 | $0 | $0 | $0 | $0 | $0 | $0 | $0 | $0 | $0 | $0 |
| Total Long-term Assets | $0 | $0 | $0 | $0 | $0 | $0 | $0 | $0 | $0 | $0 | $0 | $0 | $0 |
| Total Assets | $5,000 | $6,657 | $7,397 | $9,007 | $10,842 | $13,191 | $16,736 | $19,455 | $22,838 | $26,389 | $28,334 | $31,243 | $34,452 |
| Liabilities and Capital | Month 1 | Month 2 | Month 3 | Month 4 | Month 5 | Month 6 | Month 7 | Month 8 | Month 9 | Month 10 | Month 11 | Month 12 | |
| Current Liabilities | |||||||||||||
| Accounts Payable | $0 | $1,237 | $665 | $737 | $810 | $1,208 | $1,341 | $1,172 | $1,293 | $1,619 | $1,051 | $1,148 | $1,245 |
| Current Borrowing | $0 | $0 | $0 | $0 | $0 | $0 | $0 | $0 | $0 | $0 | $0 | $0 | $0 |
| Other Current Liabilities | $0 | $0 | $0 | $0 | $0 | $0 | $0 | $0 | $0 | $0 | $0 | $0 | $0 |
| Subtotal Current Liabilities | $0 | $1,237 | $665 | $737 | $810 | $1,208 | $1,341 | $1,172 | $1,293 | $1,619 | $1,051 | $1,148 | $1,245 |
| Long-term Liabilities | $0 | $0 | $0 | $0 | $0 | $0 | $0 | $0 | $0 | $0 | $0 | $0 | $0 |
| Total Liabilities | $0 | $1,237 | $665 | $737 | $810 | $1,208 | $1,341 | $1,172 | $1,293 | $1,619 | $1,051 | $1,148 | $1,245 |
| Paid-in Capital | $8,000 | $8,000 | $8,000 | $8,000 | $8,000 | $8,000 | $8,000 | $8,000 | $8,000 | $8,000 | $8,000 | $8,000 | $8,000 |
| Retained Earnings | ($3,000) | ($3,000) | ($3,000) | ($3,000) | ($3,000) | ($3,000) | ($3,000) | ($3,000) | ($3,000) | ($3,000) | ($3,000) | ($3,000) | ($3,000) |
| Earnings | $0 | $420 | $1,733 | $3,270 | $5,033 | $6,983 | $10,395 | $13,283 | $16,545 | $19,770 | $22,283 | $25,095 | $28,208 |
| Total Capital | $5,000 | $5,420 | $6,733 | $8,270 | $10,033 | $11,983 | $15,395 | $18,283 | $21,545 | $24,770 | $27,283 | $30,095 | $33,208 |
| Total Liabilities and Capital | $5,000 | $6,657 | $7,397 | $9,007 | $10,842 | $13,191 | $16,736 | $19,455 | $22,838 | $26,389 | $28,334 | $31,243 | $34,452 |
| Net Worth | $5,000 | $5,420 | $6,733 | $8,270 | $10,033 | $11,983 | $15,395 | $18,283 | $21,545 | $24,770 | $27,282 | $30,095 | $33,207 |


