
Puddle Jumpers Airline
Executive Summary
Puddle Jumpers Airlines, Inc. is a new consumer airline in its formative stages. It is being organized to take advantage of a specific gap in the short-haul domestic travel market. The gap exists in low cost service out of Anytown, U.S.A. The gap in the availability of low cost service in and out of the Anytown hub coupled with the demand for passenger travel on selected routes from Anytown indicates that a new entrant airline could be expected to capture a significant portion of current air travel business at that hub.
The management of Puddle Jumpers is experienced in airline start-ups. Previously management grew Private Jet Airlines from a single Boeing 727 to a fleet of 16 MD80 series aircraft. Revenues grew to $130 million in a two year period four years ago.
Our research and projections indicate that air travel to and from Anytown is sufficient to provide a new carrier with excellent revenues in its first full year of operations, utilizing six aircraft and selected short-haul routes. These sales figures are based upon load factors of only 55% in year one. Second year revenues are expected to more than doublewith additional aircraft and expanded routes. Load factors for year two are 62%. The Puddle Jumpers plan has the potential for a more rapid ramp-up than was the case with Private Jet due to the nature of the routes and the demand for travel currently in the targeted markets served. In short, the frequency of flights needed to serve Puddle Jumpers’s target market exceeds the demand that dictated Private Jet’s growth.
These sales levels will produce respectable net profit in the first operational year and exponential growth in flight-year two. Profits in year one will be a modest percent of sales and will improve steadily with the economies gained in year two. The over-all operational long term profit target will be 16% of sales as net profit in years four and five. The company’s long term plan is part of the due diligence package. The first operational year is actually fiscal year two in this plan.
The first year of formative operations will burn cash until revenue can commence. This is due to the organizational and regulatory obligations of a new air carrier. Investment activity is needed to handle the expenses of this phase of the business.
The following chart illustrates the over-all highlights of our business plan over the first three years. Gross Margin here is quite high since the only costs included in this calculation are travel agent commissions, credit card discounts, and federal excise taxes. Travel agent commissions are calculated on 30% of sales even though management feels the actual number will not exceed 10% of sales.
NOTE: For display purposes in this sample plan, numerical values in tables and charts are shown in thousands (000’s).

1.1 Objectives
The Company has the following objectives:
- To obtain required D.O.T. and F.A.A. certifications on or before month eight.
- To commence revenue service on or before the end of year one.
- To raise sufficient “seed” and “bridge” capital in a timely fashion to financially enable these objectives.
- To commence operations with two McDonnell-Douglas MD-80 series aircraft in month one, four by end of month four, and six by end of month six of flight operations.
- To add one aircraft per month during year two for a total of 18 at year two end.
1.2 Mission
Puddle Jumpers International Airlines, Inc. has a mission to provide safe, efficient, low-cost consumer air travel service. Our service will emphasize safety as its highest priority. We will operate the newest and best maintained aircraft available. We will never skimp on maintenance in any fashion whatsoever. We will strive to operate our flights on time. We will provide friendly and courteous “no frill” service.
1.3 Keys to Success
The keys to success are:
- Obtaining the required governmental approvals.
- Securing financing.
- Experienced management. (Already in place).
- Marketing; either dealing with channel problems and barriers to entry; or solving problems with major advertising and promotion budgets. Targeted market share must be achieved even amidst expected competition.
- Product quality. Always with safety foremost.
- Services delivered on time, costs controlled, marketing budgets managed. There is a temptation to fix on growth at the expense of profits. Also, rapid growth will be curtailed in order to keep maintenance standards both strict and measurable.
- Cost control. The over-all cost per ASM (available seat mile) is pegged at 7.0 cents or less in 1996 dollars. This ASM factor places Puddle Jumpers in a grouping of the lowest four in the airline industry within the short-haul market. (US Air, the dominate carrier in the Anytown market, averages 12.0 cents per ASM by comparison). The only three airlines with lower operating costs also operate older and less reliable equipment, and even then the lowest short-haul cost in the airline industry is currently Southwest at 6.43 cents per ASM.
Company Summary
Puddle Jumpers International Airlines is being formed in July, 1996 as a South State Corporation. Its offices will be in Anytown. The founder of Puddle Jumpers is Kenneth D. Smith. Mr. Smith has extensive experience in consumer aviation. His bio as well as the backgrounds of all the members of Puddle Jumpers’s management team are enclosed herein.*
*Confidential and Proprietary information has been removed from this sample plan.
2.1 Company Ownership
Puddle Jumpers International Airlines, Inc. will authorize 20,000,000 shares of common stock. 1,000,000 shares are to be set aside as founder’s stock to be divided among key management personnel. It is also expected that management stock options will be made available to key management personnel after operations commence. It is expected that founders stock plus option stock will not total more than 15% of authorized shares.
Initial “seed” capital is to be attracted via a convertible debenture sold by Private Placement. This round of funding will have premium conversion privileges vs. later rounds and “bridge” capital. The company has plans to proceed to a public offering prior to initiating revenue service. The expected proceeds from the Private Placement are expected to be $300,000 at “seed” stage, $3.5 million in “bridge” funding and $10 million in I.P.O. proceeds (projected at $6 per share). Management cannot assure that an I.P.O. will be available at the time desired and at the price sought.
A sample of the offering proposed for “seed” investment is included with this plan.
2.2 Start-up Summary
In the second year of operations, Puddle Jumpers will expand revenue by adding flights to the most demanded and popular routes in current operation. This will serve to make our schedule the most convenient to these destinations, improving further our competitive advantage. The routes expected to be expanded first include Chicago, New York, and Anytown. Second level expansions would included Philadelphia, Dallas, Washington DC, Orlando and Detroit.
NOTE: For display purposes in this sample plan, numerical values in tables and charts are shown in thousands (000’s).
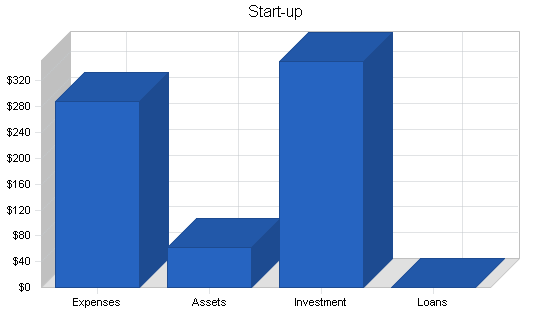
| Start-up | |
| Requirements | |
| Start-up Expenses | |
| Legal | $40 |
| Stationery, etc. | $3 |
| Business Plans | $3 |
| Placement Memorandums | $3 |
| Investment Banking Retainer | $25 |
| Underwriting Consultant | $30 |
| Offering Publicity | $60 |
| Rent | $6 |
| Government Compliance | $20 |
| CEO Salary (6 mos.) | $48 |
| Company Indentity & Marketing | $40 |
| Expensed Equipment | $10 |
| Other | $0 |
| Total Start-up Expenses | $288 |
| Start-up Assets | |
| Cash Required | $40 |
| Other Current Assets | $0 |
| Long-term Assets | $22 |
| Total Assets | $62 |
| Total Requirements | $350 |
| Start-up Funding | |
| Start-up Expenses to Fund | $288 |
| Start-up Assets to Fund | $62 |
| Total Funding Required | $350 |
| Assets | |
| Non-cash Assets from Start-up | $22 |
| Cash Requirements from Start-up | $40 |
| Additional Cash Raised | $0 |
| Cash Balance on Starting Date | $40 |
| Total Assets | $62 |
| Liabilities and Capital | |
| Liabilities | |
| Current Borrowing | $0 |
| Long-term Liabilities | $0 |
| Accounts Payable (Outstanding Bills) | $0 |
| Other Current Liabilities (interest-free) | $0 |
| Total Liabilities | $0 |
| Capital | |
| Planned Investment | |
| Owner | $0 |
| Investor | $0 |
| Additional Investment Requirement | $350 |
| Total Planned Investment | $350 |
| Loss at Start-up (Start-up Expenses) | ($288) |
| Total Capital | $62 |
| Total Capital and Liabilities | $62 |
| Total Funding | $350 |
Brought to you by
Create a professional business plan
Using AI and step-by-step instructions
Create Your PlanSecure funding
Validate ideas
Build a strategy
2.3 Company Locations and Facilities
Management plans to lease a small office in suburban Anytown immediately upon closing “seed” funding.
Services
The following sections describe the description of service, competitive comparison, technology, fulfillment, and future services.
3.1 Service Description
Puddle Jumpers is in the business of providing low-cost, “discount” air travel to selected destinations from the Anytown, U.S.A. hub. The service approach is “no frills” with emphasis on safe, courteous handling of domestic regional passenger travel.
All consumer surveys still indicate that the air travel customer’s preference is for “low fares.” However, he or she is not willing to compromise on issues of safety or on-time performance. Customers will however, settle for lower levels of in-flight service in order to reduce the cost of travel.
Puddle Jumpers provides precisely the level of service today’s air travel passenger demands.
3.2 Competitive Comparison
The primary competition in the Anytown market is US Air. US Air accounts for 86% of the air travel volume in this market. This is as high a single market dominance that exists in any US market. Also, this results in the highest fares in the nation for travel in-and-out of Anytown. 0% of air travel is at discount fares in Anytown.
Puddle Jumpers feels that we can obtain a significant portion of this business. Our costs will be lower than US Air (7 cents per ASM vs. 12 cents per ASM). US Air is already in financial difficulty due to “sins of the past.” Our costs will be significantly lower than “major” carriers such as Delta. This identifies a gap for only a “hub-based” short haul carrier in the Anytown market.
Operation of a single type of aircraft will have significant cost, maintenance, and training expense reduction.
Our aircraft will operate out of this single hub with high utilization based on price advantage. We will have an over-all competitive advantage since we don’t have aircraft or operations outside of our limited focus. Other airlines must maintain “system-wide” load factors and utilization, while Puddle Jumpers will operate profitably within our “niche” market. This will serve as a barrier to entry from other competitors once we are entrenched. It is unlikely that larger airlines will be able to compete with our low fares nor will they have the desire as they focus on more profitable “long-haul” routes with larger airplanes.
Puddle Jumpers will achieve its target of 7 cents or less per available seat mile by a combination of cost saving measures. Savings will come in the areas of labor costs and from operational economies. Puddle Jumpers will utilize its flight crews significantly more than its competition. Flight crew utilization will be 60% above industry average. Both pilots and flight attendants will be deployed an average of 85 hours per month vs. an industry average of 50-60 hours. The company will realize additional savings in the insurance and benefits areas by virtue of having fewer crew members.
Eliminating meal service in-flight will save approximately $3.00 per seat per flight. This will also increase airplane utilization due to no need for catering service while in port. It is Puddle Jumpers’s goal to utilize its fleet an average of 11 hours per day, 7 days per week.
All aircraft will be configured to a single coach seating capacity of 165 seats. This will maximize revenue on short-haul flights. MD-80 series will be the only aircraft operated by the company. We will eliminate the need to cross-train employees. We will also reduce the requirements for parts inventories.
Our state-of-the-art reservations system will save time, allow us to employ fewer reservationists, and save training costs for new reservation personnel. The reservations system is discussed further in the “Technology” section of this plan.
3.3 Sales Literature
All company literature is yet to be developed. This includes basic corporate identity material as well as advertising executions. First year projections include an expense item for this necessary development work.
3.4 Fulfillment
Aircraft will be obtained on a “dry lease” basis (without fuel) from one of several aircraft lessors at an approximate cost of $165,000 per month. Puddle Jumpers management has already been in contact with GE Capital Aviation Services. It is expected that GE Capital will have 80 MD 80 and/or MD 81 aircraft available for lease from Swiss Air over the next several years. Lease deposits, requirements and terms are as follows:
Generally, first and last month’s lease payments are required in advance. Lease is usually a five-year operating lease and most often qualifies as an expense item to the lessee. Terms of renewal are negotiable and no buy-out provision is included. There may or may not be an additional deposit required by the lessor as a maintenance reserve. Puddle Jumpers management feels that this will not be a requirement but is prepared to make such a deposit if it becomes required to obtain necessary aircraft for operations.
It is expected that up to 80 airplanes will be available over the next two years with an average of 120 days lead time required.
The advantages of utilizing McDonnell-Douglas MD 80 series aircraft, in addition to management’s knowledge and prior successful experience with the same aircraft at Private Jet, are outlined in the “Technology” section of this plan.
Our reservations system will be obtained from CMS at a cost of $200,000 for the software license and approximately $1,000 each for 50 reservation stations (including modem and monitor). The advantages of this system are outlined in the “Technology” section of this plan.
Outsourcing of services are as follows:
Maintenance:
All regular “A” and “B” maintenance will be performed by Puddle Jumpers personnel at our own leased facilities at each airport served. We will also have tools and parts inventory at each site. Puddle Jumpers management feels that it is both necessary and prudent in today’s regulatory environment to perform this regular and routine maintenance “in house”. Periodic “C” and “D” overhauls and major maintenance will be outsourced to Aero Corp. in Lake City, Florida. Labor costs are budgeted at $32 per hour. It is common for many carriers in the aviation industry (including some quite large ones) to “sub-out” “C” and “D” scheduled maintenance. Thus, it is not viewed as a competitive or regulatory disadvantage to Puddle Jumpers to do likewise.
Ground Handling:
Airplane parking services, baggage loading and unloading, and baggage and freight handling services will be outsourced at all airports other than the Anytown hub where these services will be performed by Puddle Jumpers personnel.
Food Service:
All condiments and beverages served on Puddle Jumpers flights will be purchased from in-flight food service providers.
3.5 Technology
All equipment and systems that will be utilized by Puddle Jumpers have been carefully and diligently evaluated. Management feels that it is an advantage to be starting an airline today vs. using many of the systems that burden even the largest domestic carriers with extra cost due to outmoded technology. The technological advantages to management’s choices are outlined below:
Airplane advantages:
The MD-80 series aircraft are both newer and more reliable that the DC 9’s used by Value Jet, for example. Many of Value Jet’s problems have been caused by using aircraft that often are more than 20 years old. Such aircraft, while they may be cheaply leased, are more expensive to maintain. Or, often are “maintained” on-the-fly with resulting service delays, customer dissatisfaction, and increased associated costs. It is the position of Puddle Jumpers management that the cheapest “over-all” operational costs are achieved by optimized “in air time”. This becomes both a reliability and service standard for the operation of our airline. Puddle Jumpers’s air travel customers will both feel safe flying Puddle Jumpers and will arrive at their destination on time.
Brought to you by
Create a professional business plan
Using AI and step-by-step instructions
Create Your PlanSecure funding
Validate ideas
Build a strategy
In addition, the utilization of MD-80 series aircraft will avoid additional FAA compliance requirements mandated by the “Aging Fleet Program”. These requirements apply to aircraft 20 years older or more. Since most aircraft to be used by Puddle Jumpers were built in the 1982 to 1985 time frame they will not be subject to these mandates during the full initial five year term of their respective leases. Many Value Jet airplanes, by contrast, were built in the early 1970’s.
Since these aircraft were built in the 1980’s parts are still being manufactured and are readily available. Older aircraft often dictate that parts that are no longer manufactured are “cannibalized” from one aircraft to another or that old parts are “remanufactured” since new ones are non-existent. The safety risks are evident. Puddle Jumpers will be able to maintain an inventory of new replacement parts.
Perhaps most importantly, the MD-80 series aircraft is already “Stage 3” noise compliant. New FAA guidelines mandate that 50% of an airline’s fleet meet new noise emission standards by Dec. 31, 1996. Another 25% must qualify by Dec. 31, 1998 and the entire fleet must be in noise standards compliance by Dec. 31, 2000. Several domestic air carriers are already protesting that they can’t reasonably meet these standards but the FAA has demonstrated a past history of not bending on similar issues. Puddle Jumpers’s fleet will not be effected by these requirements since it will comply as soon as it begins flying. There will be no cost to upgrade or retro-fit required. Again, this fits Puddle Jumpers’s philosophy that the cheapest way to maintain aircraft is to adopt a “preventative” overview. All of the cost savings associated with the utilization of this superior aircraft are reflected in management’s projections.
Finally, management is well acquainted with all facets of operation of the MD-80 from prior experience at Private Jet. Such experience was completely satisfactory.
Reservations advantages:
The predominate reservations systems in the airline industry today, “Sabre” and “Apollo” are outmoded and obsolete. The major carriers are slow to change because of the huge capital requirement to “roll over” their entire reservations system at one time. Hence, they keep going with the old and outdated.
The CMS reservations system that Puddle Jumpers will use has three main advantages that all contribute to cost savings: 1) Speed, 2) Learning Curve, and 3) Integration. Since today’s PC’s operate so much faster than earlier versions Puddle Jumpers’s reservationists will be able to complete a typical reservation procedure up to 75% faster than industry averages. Most reservations will be completed in two minutes or less (as opposed to the frequent 8 to 10 minutes that almost everyone has experienced from time to time). The system simply searches and retrieves data so much faster. The result is not only higher levels of customer satisfaction but also substantial savings in communications cost to Puddle Jumpers.
Training costs are also reduced exponentially. There is characteristically high turnover among airline reservationists. “Sabre” and “Apollo” take two weeks to learn and master. Puddle Jumpers’s use of CMS will enable a basic computer literate employee to learn the system in only one day.
The CMS system also seamlessly integrates with other management information systems used by Puddle Jumpers. It is also designed to operate in a “ticketless” environment, something the other systems have difficulty accomplishing.
Operational advantages:
Over-all operations will be seamless from area-to-area of Puddle Jumpers’s management information systems as a whole. Most systems utilized by the major carriers today were put in place more than 20 years ago. Thus, there is a constant need for each operational area to “talk” or “re-transmit” essential data to one and other. Not only will Puddle Jumpers’s information systems operate “seamlessly” but they will also greatly enhance the ability to conform to all FAA compliance requirements. The biggest and toughest compliance issue facing carriers today is “record keeping.” It is not enough to comply, but one must be able to PROVE compliance as well as have full and clearly defined and documented internal accountability.
3.6 Future Services
Service will be one-class with all aircraft configured for a seating capacity of 165. Travel will be ticketless. Reservations will be handled predominately by our own reservation system (even though we’ve budgeted travel agent commissions on 30% of sales). In-flight service will be on a pay-on-demand basis. Paid service will be for alcoholic beverages only. No meals will be served on these short-haul flights. A snack of soft drinks and peanuts will be included in the fare structure. Seating will be open with no reserved seats. No frequent flyer or travel incentives will be offered.
Market Analysis Summary
Anytown, U.S.A. is the best place in the continental United States to start an airline. Puddle Jumpers’s management decision to do just that is based upon extensive research compiled from The Department of Transportation O & D report data. This data provides a reliable source (based upon a compilation of actual airline arrivals and departures) of origination and destination demand by passenger, by day. The key measure of demand between any two given points in the grid is called “PDEW.” That is “passengers departed each way.” The PDEW compiles a total number of passengers on all carriers between two points, on average, each day. This total is irrespective of final destination.
The other keys factors that resulted in the choice of Anytown as a hub derive from management’s experience and knowledge in commercial aviation. Principal to the decision is an airline industry insider’s understanding of the problems that face US Air, the dominate carrier in the Anytown market. Also, the lack of availability of a true “discount” fare option to the Anytown traveler is pivotal.
Management is making the judgment that not only is the Anytown market vulnerable to a new carrier, but also that the ability of US Air to retaliate will be limited. Further, the likelihood of a major carrier to respond is unlikely. The only real threat would be another new entry. So the opportunity may best be described as one ready and waiting for the first entrant who arrives with a well conceived plan, sufficient industry experience, and with the required capitalization.
4.1 Market Segmentation
The airline industry is dominated by the major carriers. It is an industry characterized by merger, acquisition, and consolidation. Like so many other industries it has quickly evolved into an industry that has room only for major players and smaller “specialty” or “niche” participants. There are two specialty segments that have characteristically been exploited by new entrants. One is the “price” niche and the other is the “route” niche. One focuses on charging less, the other on providing either the only service between two given points (the “commuter” or “feeder” concept) or else superior or more convenient or less costly service between two heavily traveled destinations.
In today’s marketplace the “price” positioning, in and of itself, is no longer a sufficient concept on which to build an airline. Since de-regulation the flying public has been inundated with low fares. Low fares have become an expectation, not a promise. Thus, the true market segment opportunities today have become a COMBINATION of service mix, price, and route selection. The more critical decision has become one of deciding on service mix and price in conjunction with LENGTH of route. The specialty carrier is now relegated to either “short-haul” or “long-haul” concentration. There is room for a long-haul carrier who efficiently serves limited routes with only the equipment designed to serve those routes and, conversely, there is room for a short-haul carrier to take advantage of similar economies available with new technology and the proper equipment. Puddle Jumpers feels that the likelihood of competition from major carriers is less likely in the short-haul segment.
Brought to you by
Create a professional business plan
Using AI and step-by-step instructions
Create Your PlanSecure funding
Validate ideas
Build a strategy
Short-haul carriers also may operate efficiently out of a single hub. This enables consolidation of services and economies of down-sized scale. At the same time, the revenues available from short hauls are comparatively higher than long hauls on a per-passenger-mile basis.
Short haul revenues are simultaneously high enough to build a substantial business in the hundred million dollar multiple range.
Thus Puddle Jumpers may be said to target the short-haul, single hub, discount fare market segment. This is a new segment defined by the demands of today’s traveler.
NOTE: For display purposes in this sample plan, numerical values in tables and charts are shown in thousands (000’s).
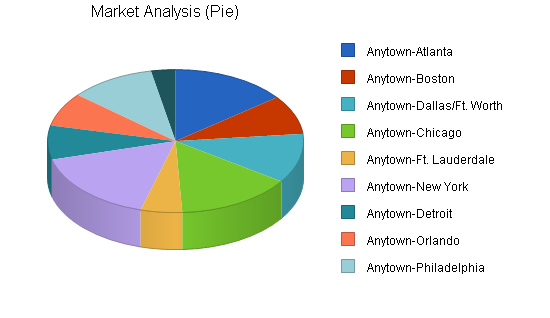
| Market Analysis | |||||||
| Year 1 | Year 2 | Year 3 | Year 4 | Year 5 | |||
| Potential Customers | Growth | CAGR | |||||
| Anytown-Atlanta | 3% | 245 | 252 | 260 | 268 | 276 | 3.02% |
| Anytown-Boston | 3% | 150 | 155 | 160 | 165 | 170 | 3.18% |
| Anytown-Dallas/Ft. Worth | 3% | 190 | 196 | 202 | 208 | 214 | 3.02% |
| Anytown-Chicago | 3% | 247 | 254 | 262 | 270 | 278 | 3.00% |
| Anytown-Ft. Lauderdale | 3% | 88 | 91 | 94 | 97 | 100 | 3.25% |
| Anytown-New York | 3% | 278 | 286 | 295 | 304 | 313 | 3.01% |
| Anytown-Detroit | 3% | 131 | 135 | 139 | 143 | 147 | 2.92% |
| Anytown-Orlando | 3% | 130 | 134 | 138 | 142 | 146 | 2.94% |
| Anytown-Philadelphia | 3% | 181 | 186 | 192 | 198 | 204 | 3.04% |
| Anytown-Washington, DC | 3% | 52 | 54 | 56 | 58 | 60 | 3.64% |
| Other | 0% | 0 | 0 | 0 | 0 | 0 | 0.00% |
| Total | 3.05% | 1,692 | 1,743 | 1,798 | 1,853 | 1,908 | 3.05% |
4.2 Service Business Analysis
The Federal Government de-regulated the airline industry in 1978. Prior to that time the government virtually guaranteed the profitability of the airline industry, at the expense of the consumer. Routes were restricted. Fares were fixed. Costs got out of control. Today some of the major carriers still continue to operate at less than optimum efficiency. This has spawned the success of various “discount” carriers, most notably Southwest, ValuJet, and the new U2 planned by UAL.
The low cost carriers have proven that they can operate profitably, can garner market share, and have even spawned an increase in travel by luring those who would previously have traveled by bus, rail, or automobile or who would not have traveled at all.
In 1994, ValuJet Airlines in Anytown experienced considerable success and enjoyed rapid growth. It has forced TWA to abandon its mini hub in Anytown and has grown to more than 40 aircraft in two years. Until recently, Anytown was the most expensive major city in the U.S. to fly to or from. This was due, in part, to the near monopoly condition engendered by Delta’s dominance of the Anytown market.
ValuJet remains the economic success model for start-up airlines, although Puddle Jumpers management feels that it should not be the operational model. ValuJet’s current problems are the result of unbridled growth without commensurate control.
Many major airlines today are experiencing significant losses. The management of Puddle Jumpers feels that these losses can be traced directly to the high cost of labor, operational inefficiency, and poor management. Management further believes that the major carriers cannot profitably compete against start-up carriers with limited and specific market focus and lower over-all cost structures.
In retrospect, de-regulation has succeeded in providing air travelers with better service but has not necessarily provided service at a lower price. In the recent times of financial trouble many airlines have complained of an under supply of air travelers, when in fact there is an under supply of affordable seats. It is Puddle Jumpers’s goal to provide these affordable seats while maintaining a profitable airline.
4.2.1 Distributing a Service
Sales of airline tickets have historically been either direct from the airline itself or through various travel agents. Modern computer technology and communications capability are changing the mix dramatically. Travel agents once accounted for 80% of ticket sales. This channel of distribution has been one of very high cost to the airlines. Travel agent commissions at one time became the highest individual cost item to an airline. Perks and incentives amounted to coercion and bribery. The airlines found themselves held hostage. Not until Delta boldly announced that commissions to travel agents would be held to 10% did the situation begin to change.
The physical cost of printing and distributing tickets is also substantial. Travel agents estimate that it costs them an average of $30 in total cost to originate an airline ticket. Many of them have begun to add their own service fees to the actual cost of a ticket.
Available technology has now afforded the opportunity both to sell one’s own tickets and to eliminate the physical ticket altogether. The critical element for both strategies to be successful for an airline is simply to create the demand for travel on one’s airline. If the airline makes it desirable for the consumer to want to fly it then it is just as easy to order tickets directly from the airline as it is from any other source. Puddle Jumpers will have fifty of its own reservations agents available via an 800 number (the service will be 24 hours from an available pool of 90 agents in total). In addition, we will have an Internet site where schedules are available and customers can book their own reservations and buy tickets via credit card.
Puddle Jumpers expects to sell as much as 90% of its air travel “direct” and “ticketless.” Even so, we have budgeted 30% of sales as subject to agent’s commission.
“Ticketless” travel has an additional advantage since Puddle Jumpers will not wait 30 days for collection of clearinghouse funds from other airlines on combined-carrier tickets. Also, it is not expected to be a competitive disadvantage for Puddle Jumpers’s passengers to connect to other airlines. They will want to fly Puddle Jumpers to available destinations to save money even if they need to buy a paper ticket on another airline. Puddle Jumpers flights will be listed in all available flight information systems.
4.2.2 Competition and Buying Patterns
The most critical factor for Puddle Jumpers or any new airline to overcome is the issue of brand awareness and name recognition. Customers prefer to fly with carriers they know and trust. There is little doubt that Puddle Jumpers will need to spend heavily and frequently to advertise and promote its product. The needed amounts are budgeted in this plan. The advantage is that local media can be utilized which is more cost effective on a per-impression basis. It can also be highly targeted. It has been proven in the past that market share can be achieved for a new airline.
Critical in today’s environment is safety. Consumers will switch for lower costs, but not at the expense of a perception of a safety risk, or not at the expense of expected on-time performance. Puddle Jumpers’s media executions will emphasize these two main themes.
In the Anytown market, Puddle Jumpers expects to appeal to a mix of business oriented travelers and personal travelers. One issue is whether or not “frequent flier miles” are needed to compete and sell tickets. Management feels they are not. Industry estimates show that as many as 10% of occupied seats on domestic flights are currently “no revenue” as a result of redemption of premiums earned. It is also very expensive for an airline to administer its frequent flyer program. Puddle Jumpers feels that our cost advantage in Anytown will outweigh the lack of “incentive” rewards. We expect that casual and personal travelers don’t fly often enough for “points” to be significant. At the same time Puddle Jumpers will initiate a concerted sales effort directly to all major corporations in the Anytown market. We hope to have business travel mandated by these corporations on a cost basis alone.
4.2.3 Main Competitors
The only significant competitor in the Anytown market is US Air. At one time Eastern and Piedmont dominated the market. Eastern went out and Piedmont was acquired by US Air. US Air is highly vulnerable because of its high operating costs. ASM short-haul cost of 12 cents is currently the highest in the US. US Air commands 86% of the Anytown air travel market. Delta is a distant second with 2%.
As a result, Anytown currently has the highest air travel costs in the country and 0% of air travel is at discount fares.
US Air’s problems can be traced to two main factors. The first is the fact that their growth strategy has been by acquisition. It is apparent that management paid too much for many small regional carriers and also that the consolidation of these carriers has not produced the operational cost advantages that were anticipated. Secondly, and most important, has been out-of-control labor costs. US Air’s stronghold is in the North East. The strongest labor unions are located in this part of the country and prior management has been completely ineffective in obtaining any concessions from these unions.
In spite of high costs, US Air has grown to become the nation’s sixth largest carrier. However, recent press articles indicate a large measure of uncertainty in their future path. Berkshire Hathaway has asked US Air to buy back its 10% stake in the airline. Stephen Wolf, US Air’s new chairman has stated that US Air needs to become a carrier “of choice” not merely “of convenience.” He said further that US Air must either buy another airline, be acquired itself, or form a partnership with another carrier. The question is WHO? No one in the industry wants US Air’s high cost structure. And even if a new owner could obtain concessions, who’s current routes are compatible with US Air? The management of Puddle Jumpers cannot identify a strategic suitor. TWA or Continental would be the most likely to acquire US Air from an economic standpoint but the routes don’t match well.
Puddle Jumpers concludes that the Anytown opportunity is likely to be free from imposing competition unless it comes from another start-up. If we are able to attack the market first with sufficient capitalization, we feel we will be difficult to overcome and should be able to build critical mass within two years.
4.2.4 Business Participants
The major air carriers in the U.S. are not the focus of this plan. They are not viewed as competition to a single hub, short-haul, low cost entrant. The following three airlines are worthy of study. Southwest as one to emulate. ValuJet as one to improve upon. US Air as one to learn from and avoid similar pitfalls.
Southwest Airlines is the model for operating a safe and successful discount carrier. Even though Southwest has the lowest cost per ASM in the airline industry for short-haul carriers they have never experienced a fatal crash in more than 25 years of operation.
ValuJet remains the financial model for a start-up airline. The return to initial investors and early shareholders has been outstanding. However, operations have been marginal and growth was too fast.
US Air is the model for classically mismanaged labor cost within the airline industry. This plan focuses on a deeper discussion of US Air in the “Competition” section. US Air controls an 86% market share in Anytown. Delta is second with 2%.
Puddle Jumpers management has studied extensively the history of the above three airlines. All three have grown to substantial revenue size amidst the major airlines. None of the three existed in the not-too-distant past. Puddle Jumpers has taken the best parts of each growth story, heeded the alarms and cautions, and learned from the outright mistakes. The result is the plan for Puddle Jumpers Airlines, the airline for today’s marketplace.
Strategy and Implementation Summary
Puddle Jumpers’s market presence will be achieved by relying on the strategy of identifying and serving a specialized niche market well.
- Media executions will utilize local media, which is highly targeted and cost effective on a cost-per-impression basis.
- Air operations will be centralized and cost effective.
- Reservations will be centralized and cost effective.
- Marketing will be media generated to the leisure market and combined media/direct sales generated to corporate accounts.
5.1 Marketing Strategy
Marketing is targeted locally. The advantage of a local and highly identifiable market is that media selections can be limited in scope. There is no need for a national media program to launch Puddle Jumpers. The most effective media is expected to be outdoor billboards. Private Jet relied heavily on a dozen well-placed billboards in and around its home hub to build a $100 million plus business.
Other media will be local spot TV on highly visible programs such as local news and sports. Also, local radio. Newspapers and other print will not be used.
5.1.1 Distribution Strategy
In addition to other marketing programs outlined the company will also market via the World Wide Web. We will establish our own website with reservation, purchase, and payment capability.
5.1.2 Pricing Strategy
Due to its low cost operating structure Puddle Jumpers will be able to offer service at less than 50% of the competitive airfares to our selected destinations from our Anytown hub. Projected fares are as follows:
| ROUTE | ADVANCE | WALK-ON | D.O.T. |
| Atlanta | $59.00 | $89.00 | $167.66 |
| N.Y. | $89.00 | $129.00 | $170.17 |
| Dallas | $99.00 | $159.00 | $222.15 |
| Boston | $99.00 | $159.00 | $185.25 |
| Chicago | $89.00 | $129.00 | $184.99 |
| Orlando | $79.00 | $119.00 | $141.69 |
| Phil | $79.00 | $119.00 | $180.08 |
| Detroit | $89.00 | $129.00 | $165.55 |
| D.C. | $79.00 | $109.00 | $188.95 |
| Ft. Lauderdale | $79.00 | $119.00 | $148.70 |
The first column is for 14 day advance purchase. These fares are non-cancelable and non-refundable. The second column is for fares purchased inside of 14 days. The third column is current Day-of-Travel published average fare for all carriers.
5.1.3 Promotion Strategy
Promotion will be primarily outdoor advertising, radio and TV targeted at the Anytown business and leisure traveler.
In addition the company will employ a public relations firm for both consumer and financial purposes.
The combined amount budgeted for advertising, public relations, and reservations will be held under 15% of sales. Thus, the first year expenditure in these categories is expected to be $16.5 million. Past experience with Private Jet has demonstrated that this expenditure is sufficient to launch airline service in a single hub.
5.2 Sales Strategy
In order to attract the Anytown business traveler without the use of frequent flyer miles, the company will make direct sales contacts with the travel departments of Anytown based corporations and businesses. It is expected that our cost structure will be attractive to these businesses. Anytown is now the third largest banking center in the U.S. and the Anytown area economy in general is growing faster that the national average. We expect business travel to amount to at least 50% of our over-all revenue.
The sales personnel and salaries required to execute the direct sales strategy are included in these projections.
5.2.1 Sales Forecast
The company is forecasting very encouraging annual sales in year one of flight operations. Year two of flight operations sales are forecasted to more than double. Assumptions made for load factors are: 55% in year one, 62% in year two.
The year two numbers are based upon adding more flights and more airplanes to the routes already served. This will enable us to maximize profits within the market we have created without incurring the additional expense of opening new markets. It also allows for more controlled growth and eliminates the risks, early on, of the loss of control of operational procedures that can occur either with de-centralization or growth that is too rapid.
The basis of the sales projections illustrated in the table below have been outlined in the “Market Analysis” section of this plan.
The company has also prepared five-year projections that are based upon expanded service to additional market areas. This five year plan is a part of our due diligence package. Direct costs of sales are not included here but are instead reflected as a revenue discount in the projected P&L statement. These sales costs consist of travel agent commissions, credit card discounts, and federal excise taxes.
NOTE: For display purposes in this sample plan, numerical values in tables and charts are shown in thousands (000’s).

| Sales Forecast | |||
| Year 1 | Year 2 | Year 3 | |
| Sales | |||
| Sales | $0 | $110,000 | $216,925 |
| Other | $0 | $0 | $0 |
| Total Sales | $0 | $110,000 | $216,925 |
| Direct Cost of Sales | Year 1 | Year 2 | Year 3 |
| Sales | $0 | $0 | $0 |
| Other | $0 | $0 | $0 |
| Subtotal Direct Cost of Sales | $0 | $0 | $0 |
5.3 Milestones
The following table lists important program milestones, with dates and managers in charge, and budgets for each. The milestone schedule indicates our emphasis on planning for implementation.
Management expects that the current regulatory climate will loosen shortly. We expect it to be a long-term advantage to well operated airlines. We feel that 1996 is the ideal time both to invest and to start an airline.
The costs of adding airplanes are figured on the basis of first and last payment in advance + one month’s lease payment.

| Milestones | |||||
| Milestone | Start Date | End Date | Budget | Manager | Department |
| Seed Financing | 7/1/1996 | 7/30/1996 | $2,500 | KDS | Executive |
| Incorporation | 7/1/1996 | 7/15/1996 | $2,500 | KDS | Executive |
| Private Placement | 7/15/1996 | 7/30/1996 | $90,000 | KDS | Executive |
| D.O.T. Filing | 7/15/1996 | 8/1/1996 | $10,000 | KDS | Executive |
| F.A.A. Filing | 8/1/1996 | 10/1/1996 | $10,000 | KDS | Executive |
| Hiring Key Executives | 8/1/1996 | 1/1/1997 | $0 | KDS | Executive |
| I.P.O. | 1/1/1997 | 3/1/1997 | $0 | KDS | Executive |
| Full Staffing | 3/1/1997 | 6/1/1997 | $0 | KDS | Human Res |
| Lease 2 Airplanes | 3/1/1997 | 6/1/1997 | $960,000 | KDS | Executive |
| Commence Revenue Service | 7/1/1997 | 7/1/1997 | $200,000 | KDS | Sales |
| Lease 3rd Airplane | 6/1/1997 | 8/1/1997 | $480,000 | KDS | Executive |
| Lease 4th Airplane | 8/1/1997 | 9/1/1997 | $480,000 | KDS | Executive |
| Totals | $2,235,000 | ||||
Management Summary
The management of Puddle Jumpers is highly experienced. There is no one on the management team who has not already performed his or her function for another airline. We are not in the business of training key people. We intend to hit the ground running with a highly qualified and experienced management team. Some of the individuals profiled are currently with other airline companies. They both know and respect Ken Smith and have expressed the desire to work for him and for Puddle Jumpers.
Ken Smith is both known and respected by the F.A.A. regional officers in Anytown as well as at the Federal level in Washington. He enjoys similar status with key D.O.T. officers. The management of Puddle Jumpers is well versed in all governmental approval procedures, having traversed them in the past to a full approval and operational status. We feel that the resumes of the key people enclosed herein will only enhance our ability to obtain required approvals. It is expected to be a necessity from this point forward to have such a management team assembled in order to obtain the government charters from the D.O.T. and from the F.A.A.
The bios of the management team follow.
6.1 Organizational Structure
The company will be organized into five major operational areas:
- Flight Operations.
- Maintenance.
- Financial.
- Marketing.
- Customer Service.
Many of the specific positions and job descriptions are government mandated. Puddle Jumpers will fully comply with all such mandates.
6.2 Management Team
The following are the bios and ages of the key members of Puddle Jumpers’s management team:
KENNETH D. SMITH, President & CEO, 51
Ken Smith has 28 years of aviation experience beginning with his career in the U.S. Air Force, where he ultimately attained the rank of Captain. Ken was awarded the Distinguished Flying Cross, two Commendation Medals, and six Air Medals for his contributions as a pilot in the Vietnam War. When Ken left the Air Force in 1976 he was the Director of Flight Training Programs at the U.S. Air Force Academy in Colorado Springs. He has served as Chief Flight Instructor for Flight International Training School and as a pilot for Braniff Airlines. Ken then served as Executive Vice President and General Manager for Aerostar Airlines, leading a turn-around that enabled Aerostar to be acquired by Flight International in 1984.
Ken then became General Manager of Connie Jones Services, an air cargo airline which he expanded from five to twenty aircraft. He was then recruited by Aero Corporation where he became Vice President of Marketing for Aero’s worldwide aircraft maintenance services.
Ken became President and CEO of Private Jet in January 1991. In less than two years Ken’s leadership took Private Jet from a single aircraft to a fleet of 15 and revenue of more than $130 million dollars.
Ken then helped Eagle Airlines start-up and has also served as a consultant to the start-up of Nations Air.
JAMES B. JONES, Executive Vice President, 49
Mr. Jones has thirty years of flying experience including distinguished military service. He has been chief pilot, Director of Operations, and General Manager of Air Nevada Airlines, a commuter carrier. He has also served as Director of Operations and Director of Training for Eagle Airlines.
GREER CLARK, Vice President, Operations, 56
Mr. Clark has taken early retirement from Delta Airlines. He has since served as Chief Pilot for America International Airlines, and as Vice President, Operations for Private Jet and for Eagle Airlines. Currently, he is Manager, Flight Test for ValuJet.
DON ADAMS, Vice President, Maintenance, 47
Mr. Adams is an Aeronautical Engineer from Australia. He has served as Vice President of Ansett Airlines. He was Vice President of Technical Services for Intercredit Corporation, an aircraft leasing company. Currently, he is Vice President of Avitas, one of the world’s leading aviation consulting companies. He is presently on loan to the National Transportation Safety Board investigating the American Airlines B757 crash in Columbia.
BRUCE WING, Vice President, Finance, 50
Mr. Wing is a CPA who has been a Vice President with First Chicago Bank. He has previously served as CFO of United Express, the commuter division of United Airlines as well as CFO of Private Jet.
PAUL BERRY, Director of Operations, 57
Mr. Berry is a retired Air Force Colonel. Colonel Berry served as General Swartzkoph’s Tanker Task Force Commander for Desert Storm. Mr. Berry is currently Director of Operations at America International Airlines.
TERRY MCADAMS, Chief Pilot, 57
Mr. McAdams served as a pilot with Eastern Airlines for more than 25 years. He later served as Chief Pilot for Private Jet and is the Chief Pilot for ValuJet. Mr. McAdams is typed on the B727, DC-9, and MD-80 aircraft.
SALVATORE DIANGELO, Director of Maintenance, 41
Mr. Diangelo has been in aircraft maintenance in the military, at People’s Express Airlines, and at Continental Airlines. At Continental Mr. Diangelo was responsible for preparing the maintenance budget for the entire fleet. He has also served as Director of Maintenance for ValuJet.
CALVIN COBLE, Director of Quality Assurance, 42
Mr. Coble served his apprenticeship in the military. He is qualified as a Class III Inspector, which requires both extensive training and recommendation from his peers at the FAA. Mr. Coble has served as Director of Quality Assurance at Shannon Aerospace, a large maintenance facility operated by Lufthansa and Swiss Air in Shannon, Ireland.
JIM BEND, Director of Marketing, 49
Mr. Bend has over fifteen years as Regional Sales Manager for Eastern Airlines. He received numerous awards for his sales performance while at Eastern. He has also served as Director of Sales at Private Jet.
JUDY LAND, Director of Reservations, 38
Ms. Land has more than 10 years experience as Reservations Manager at Eastern Airlines. She has also helped with design and implementation of the reservations system at Private Jet and at World Technologies. She has received numerous awards for her motivational training seminars.
MARY ANN BENNETT, Director of In-flight Services, 43
Ms. Bennett served as a flight attendant at Eastern Airlines and went on to open her own travel agency. She joined Private Jet as a supervisor of flight attendants and was later promoted to Director.
6.3 Personnel Plan
The following table illustrates personnel needs and growth plans for both key executives and category needs by group. It is expected that all key executives will participate in the company’s stock option plan as well.
NOTE: For display purposes in this sample plan, numerical values in tables and charts are shown in thousands (000’s).
| Personnel Plan | |||
| Year 1 | Year 2 | Year 3 | |
| Chief Executive Officer | $96 | $96 | $108 |
| Executive Vice President | $42 | $84 | $96 |
| V.P. Operations | $36 | $72 | $84 |
| V.P. Maintenance | $36 | $72 | $78 |
| V.P. Finance | $30 | $60 | $66 |
| Director of Operations | $20 | $60 | $66 |
| Director of Maintenance | $20 | $60 | $66 |
| Chief Pilot | $18 | $72 | $78 |
| Director of Sales/Marketing | $10 | $60 | $66 |
| Director of Quality Assurance | $8 | $48 | $56 |
| Director of Reservations | $8 | $48 | $54 |
| Director of In-flight Services | $8 | $48 | $52 |
| Flight Crews | $0 | $4,221 | $5,614 |
| Reservations | $0 | $860 | $1,144 |
| Maintenance | $0 | $950 | $1,264 |
| Operations/Training/G&A | $0 | $1,035 | $1,376 |
| Sales/Marketing | $0 | $180 | $240 |
| Finance/Accounting | $0 | $360 | $480 |
| Other | $0 | $125 | $150 |
| Total People | 0 | 0 | 0 |
| Total Payroll | $332 | $8,511 | $11,138 |
Financial Plan
Adequate financing is essential for a start-up airline. Our strategy remains a “seed” to “bridge” to “IPO” progression. This has served as a successful model for airline starts in the past. Because of the amount of capital required to start an airline management feels it is restricted to this funding path. Once four to six airplanes are up and flying the company can continue to operate profitably for an indefinite period of time in the event additional capital becomes unavailable on attractive terms.
7.1 Important Assumptions
The financial plan depends on important assumptions, most of which are shown in the following table. They key underlying assumptions are:
- We assume a slow-growth economy, without major recession.
- We assume of course that there are no unforeseen changes in technology to make products immediately obsolete.
- We assume access to equity capital and financing sufficient to maintain our financial plan as shown in the tables.
| General Assumptions | |||
| Year 1 | Year 2 | Year 3 | |
| Plan Month | 1 | 2 | 3 |
| Current Interest Rate | 10.00% | 10.00% | 10.00% |
| Long-term Interest Rate | 10.00% | 10.00% | 10.00% |
| Tax Rate | 0.00% | 0.00% | 0.00% |
| Other | 0 | 0 | 0 |
7.2 Key Financial Indicators
In the airline business the most important measurements are cost per Available Seat Mile and the System Utilization Factor. If seat costs are kept below 7 cents and utilization is at 50% or better, the airline will operate profitably.

7.3 Break-even Analysis
When we take out all operational costs for flying aircraft and include only fixed overhead and aircraft leases the company can break even on the first six airplanes by maintaining sales just over $2 million per month or approximately $24 million in year one. This is less than 25% of our expected sales forecast but it indicates that the company could survive without adding planes and routes for an indeterminate period with load factors of less than 15%.
NOTE: For display purposes in this sample plan, numerical values in tables and charts are shown in thousands (000’s).

| Break-even Analysis | |
| Monthly Revenue Break-even | $28 |
| Assumptions: | |
| Average Percent Variable Cost | 0% |
| Estimated Monthly Fixed Cost | $28 |
7.4 Projected Profit and Loss
Our profits improve from a low percent of sales in year one to a modest percent of sales in year two and are expected to peak at a respectable percentage in year three and thereafter. In gross numbers, we create healthy profit in the second operational year.
NOTE: For display purposes in this sample plan, numerical values in tables and charts are shown in thousands (000’s).


| Pro Forma Profit and Loss | |||
| Year 1 | Year 2 | Year 3 | |
| Sales | $0 | $110,000 | $216,925 |
| Direct Cost of Sales | $0 | $0 | $0 |
| Other Costs of Sales | $0 | $0 | $0 |
| Total Cost of Sales | $0 | $0 | $0 |
| Gross Margin | $0 | $110,000 | $216,925 |
| Gross Margin % | 0.00% | 100.00% | 100.00% |
| Expenses | |||
| Payroll | $332 | $8,511 | $11,138 |
| Marketing/Promotion | $0 | $0 | $0 |
| Depreciation | $0 | $0 | $0 |
| Rent | $0 | $0 | $0 |
| Utilities | $0 | $0 | $0 |
| Insurance | $0 | $0 | $0 |
| Payroll Taxes | $0 | $0 | $0 |
| Other | $0 | $0 | $0 |
| Total Operating Expenses | $332 | $8,511 | $11,138 |
| Profit Before Interest and Taxes | ($332) | $101,489 | $205,787 |
| EBITDA | ($332) | $101,489 | $205,787 |
| Interest Expense | $0 | $0 | $0 |
| Taxes Incurred | $0 | $0 | $0 |
| Net Profit | ($332) | $101,489 | $205,787 |
| Net Profit/Sales | 0.00% | 92.26% | 94.87% |
7.5 Projected Cash Flow
This business plan cash flows positively from the initial infusion of investment forward. It will continue to produce cash as long as sales targets are met. Borrowing may only be required if seasonal fluctuations occur or if expansion plans are further accelerated.
The chart below illustrates the accumulation of first year cash during formative stage.
NOTE: For display purposes in this sample plan, numerical values in tables and charts are shown in thousands (000’s).

| Pro Forma Cash Flow | |||
| Year 1 | Year 2 | Year 3 | |
| Cash Received | |||
| Cash from Operations | |||
| Cash Sales | $0 | $110,000 | $216,925 |
| Subtotal Cash from Operations | $0 | $110,000 | $216,925 |
| Additional Cash Received | |||
| Sales Tax, VAT, HST/GST Received | $0 | $0 | $0 |
| New Current Borrowing | $0 | $0 | $0 |
| New Other Liabilities (interest-free) | $0 | $0 | $0 |
| New Long-term Liabilities | $0 | $0 | $0 |
| Sales of Other Current Assets | $0 | $0 | $0 |
| Sales of Long-term Assets | $0 | $0 | $0 |
| New Investment Received | $13,850 | $0 | $0 |
| Subtotal Cash Received | $13,850 | $110,000 | $216,925 |
| Expenditures | Year 1 | Year 2 | Year 3 |
| Expenditures from Operations | |||
| Cash Spending | $332 | $8,511 | $11,138 |
| Bill Payments | $0 | $0 | $0 |
| Subtotal Spent on Operations | $332 | $8,511 | $11,138 |
| Additional Cash Spent | |||
| Sales Tax, VAT, HST/GST Paid Out | $0 | $0 | $0 |
| Principal Repayment of Current Borrowing | $0 | $0 | $0 |
| Other Liabilities Principal Repayment | $0 | $0 | $0 |
| Long-term Liabilities Principal Repayment | $0 | $0 | $0 |
| Purchase Other Current Assets | $0 | $0 | $0 |
| Purchase Long-term Assets | $0 | $0 | $0 |
| Dividends | $0 | $0 | $0 |
| Subtotal Cash Spent | $332 | $8,511 | $11,138 |
| Net Cash Flow | $13,518 | $101,489 | $205,787 |
| Cash Balance | $13,558 | $115,047 | $320,834 |
7.6 Projected Balance Sheet
The projected balance sheet illustrates the growth of the net worth of the business and may also be utilized to estimate future stock values based upon industry multiples.
NOTE: For display purposes in this sample plan, numerical values in tables and charts are shown in thousands (000’s).
| Pro Forma Balance Sheet | |||
| Year 1 | Year 2 | Year 3 | |
| Assets | |||
| Current Assets | |||
| Cash | $13,558 | $115,047 | $320,834 |
| Other Current Assets | $0 | $0 | $0 |
| Total Current Assets | $13,558 | $115,047 | $320,834 |
| Long-term Assets | |||
| Long-term Assets | $22 | $22 | $22 |
| Accumulated Depreciation | $0 | $0 | $0 |
| Total Long-term Assets | $22 | $22 | $22 |
| Total Assets | $13,580 | $115,069 | $320,856 |
| Liabilities and Capital | Year 1 | Year 2 | Year 3 |
| Current Liabilities | |||
| Accounts Payable | $0 | $0 | $0 |
| Current Borrowing | $0 | $0 | $0 |
| Other Current Liabilities | $0 | $0 | $0 |
| Subtotal Current Liabilities | $0 | $0 | $0 |
| Long-term Liabilities | $0 | $0 | $0 |
| Total Liabilities | $0 | $0 | $0 |
| Paid-in Capital | $14,200 | $14,200 | $14,200 |
| Retained Earnings | ($288) | ($620) | $100,869 |
| Earnings | ($332) | $101,489 | $205,787 |
| Total Capital | $13,580 | $115,069 | $320,856 |
| Total Liabilities and Capital | $13,580 | $115,069 | $320,856 |
| Net Worth | $13,580 | $115,069 | $320,856 |
7.7 Business Ratios
The important business measurement ratios are presented here based upon projections for Puddle Jumpers. Business ratios for the years of this plan are shown below. Industry profile ratios based on the NAICS code 481111, Scheduled Passenger Air Transportation, are shown for comparison.
| Ratio Analysis | ||||
| Year 1 | Year 2 | Year 3 | Industry Profile | |
| Sales Growth | 0.00% | 0.00% | 97.20% | 11.52% |
| Percent of Total Assets | ||||
| Other Current Assets | 0.00% | 0.00% | 0.00% | 43.73% |
| Total Current Assets | 99.84% | 99.98% | 99.99% | 65.07% |
| Long-term Assets | 0.16% | 0.02% | 0.01% | 34.93% |
| Total Assets | 100.00% | 100.00% | 100.00% | 100.00% |
| Current Liabilities | 0.00% | 0.00% | 0.00% | 32.81% |
| Long-term Liabilities | 0.00% | 0.00% | 0.00% | 25.84% |
| Total Liabilities | 0.00% | 0.00% | 0.00% | 58.65% |
| Net Worth | 100.00% | 100.00% | 100.00% | 41.35% |
| Percent of Sales | ||||
| Sales | 100.00% | 100.00% | 100.00% | 100.00% |
| Gross Margin | 0.00% | 100.00% | 100.00% | 55.90% |
| Selling, General & Administrative Expenses | 0.00% | 85.78% | 76.98% | 31.28% |
| Advertising Expenses | 0.00% | 62.07% | 52.09% | 0.66% |
| Profit Before Interest and Taxes | 0.00% | 92.26% | 94.87% | 0.16% |
| Main Ratios | ||||
| Current | 0.00 | 0.00 | 0.00 | 1.65 |
| Quick | 0.00 | 0.00 | 0.00 | 0.92 |
| Total Debt to Total Assets | 0.00% | 0.00% | 0.00% | 65.97% |
| Pre-tax Return on Net Worth | -2.44% | 88.20% | 64.14% | 0.20% |
| Pre-tax Return on Assets | -2.44% | 88.20% | 64.14% | 0.60% |
| Additional Ratios | Year 1 | Year 2 | Year 3 | |
| Net Profit Margin | 0.00% | 92.26% | 94.87% | n.a |
| Return on Equity | -2.44% | 88.20% | 64.14% | n.a |
| Activity Ratios | ||||
| Accounts Payable Turnover | 0.00 | 0.00 | 0.00 | n.a |
| Payment Days | 0 | 0 | 0 | n.a |
| Total Asset Turnover | 0.00 | 0.96 | 0.68 | n.a |
| Debt Ratios | ||||
| Debt to Net Worth | 0.00 | 0.00 | 0.00 | n.a |
| Current Liab. to Liab. | 0.00 | 0.00 | 0.00 | n.a |
| Liquidity Ratios | ||||
| Net Working Capital | $13,558 | $115,047 | $320,834 | n.a |
| Interest Coverage | 0.00 | 0.00 | 0.00 | n.a |
| Additional Ratios | ||||
| Assets to Sales | n.a. | 1.05 | 1.48 | n.a |
| Current Debt/Total Assets | 0% | 0% | 0% | n.a |
| Acid Test | 0.00 | 0.00 | 0.00 | n.a |
| Sales/Net Worth | 0.00 | 0.96 | 0.68 | n.a |
| Dividend Payout | 0.00 | 0.00 | 0.00 | n.a |
Appendix
| Sales Forecast | |||||||||||||
| Month 1 | Month 2 | Month 3 | Month 4 | Month 5 | Month 6 | Month 7 | Month 8 | Month 9 | Month 10 | Month 11 | Month 12 | ||
| Sales | |||||||||||||
| Sales | 0% | $0 | $0 | $0 | $0 | $0 | $0 | $0 | $0 | $0 | $0 | $0 | $0 |
| Other | 0% | $0 | $0 | $0 | $0 | $0 | $0 | $0 | $0 | $0 | $0 | $0 | $0 |
| Total Sales | $0 | $0 | $0 | $0 | $0 | $0 | $0 | $0 | $0 | $0 | $0 | $0 | |
| Direct Cost of Sales | Month 1 | Month 2 | Month 3 | Month 4 | Month 5 | Month 6 | Month 7 | Month 8 | Month 9 | Month 10 | Month 11 | Month 12 | |
| Sales | $0 | $0 | $0 | $0 | $0 | $0 | $0 | $0 | $0 | $0 | $0 | $0 | |
| Other | $0 | $0 | $0 | $0 | $0 | $0 | $0 | $0 | $0 | $0 | $0 | $0 | |
| Subtotal Direct Cost of Sales | $0 | $0 | $0 | $0 | $0 | $0 | $0 | $0 | $0 | $0 | $0 | $0 | |
| Personnel Plan | |||||||||||||
| Month 1 | Month 2 | Month 3 | Month 4 | Month 5 | Month 6 | Month 7 | Month 8 | Month 9 | Month 10 | Month 11 | Month 12 | ||
| Chief Executive Officer | 0% | $8 | $8 | $8 | $8 | $8 | $8 | $8 | $8 | $8 | $8 | $8 | $8 |
| Executive Vice President | 0% | $0 | $0 | $0 | $0 | $0 | $0 | $7 | $7 | $7 | $7 | $7 | $7 |
| V.P. Operations | 0% | $0 | $0 | $0 | $0 | $0 | $0 | $6 | $6 | $6 | $6 | $6 | $6 |
| V.P. Maintenance | 0% | $0 | $0 | $0 | $0 | $0 | $0 | $6 | $6 | $6 | $6 | $6 | $6 |
| V.P. Finance | 0% | $0 | $0 | $0 | $0 | $0 | $0 | $0 | $6 | $6 | $6 | $6 | $6 |
| Director of Operations | 0% | $0 | $0 | $0 | $0 | $0 | $0 | $0 | $0 | $5 | $5 | $5 | $5 |
| Director of Maintenance | 0% | $0 | $0 | $0 | $0 | $0 | $0 | $0 | $0 | $5 | $5 | $5 | $5 |
| Chief Pilot | 0% | $0 | $0 | $0 | $0 | $0 | $0 | $0 | $0 | $0 | $6 | $6 | $6 |
| Director of Sales/Marketing | 0% | $0 | $0 | $0 | $0 | $0 | $0 | $0 | $0 | $0 | $0 | $5 | $5 |
| Director of Quality Assurance | 0% | $0 | $0 | $0 | $0 | $0 | $0 | $0 | $0 | $0 | $0 | $4 | $4 |
| Director of Reservations | 0% | $0 | $0 | $0 | $0 | $0 | $0 | $0 | $0 | $0 | $0 | $4 | $4 |
| Director of In-flight Services | 0% | $0 | $0 | $0 | $0 | $0 | $0 | $0 | $0 | $0 | $0 | $4 | $4 |
| Flight Crews | 0% | $0 | $0 | $0 | $0 | $0 | $0 | $0 | $0 | $0 | $0 | $0 | $0 |
| Reservations | 0% | $0 | $0 | $0 | $0 | $0 | $0 | $0 | $0 | $0 | $0 | $0 | $0 |
| Maintenance | 0% | $0 | $0 | $0 | $0 | $0 | $0 | $0 | $0 | $0 | $0 | $0 | $0 |
| Operations/Training/G&A | 0% | $0 | $0 | $0 | $0 | $0 | $0 | $0 | $0 | $0 | $0 | $0 | $0 |
| Sales/Marketing | 0% | $0 | $0 | $0 | $0 | $0 | $0 | $0 | $0 | $0 | $0 | $0 | $0 |
| Finance/Accounting | 0% | $0 | $0 | $0 | $0 | $0 | $0 | $0 | $0 | $0 | $0 | $0 | $0 |
| Other | 0% | $0 | $0 | $0 | $0 | $0 | $0 | $0 | $0 | $0 | $0 | $0 | $0 |
| Total People | 0 | 0 | 0 | 0 | 0 | 0 | 0 | 0 | 0 | 0 | 0 | 0 | |
| Total Payroll | $8 | $8 | $8 | $8 | $8 | $8 | $27 | $33 | $43 | $49 | $66 | $66 | |
| Pro Forma Profit and Loss | |||||||||||||
| Month 1 | Month 2 | Month 3 | Month 4 | Month 5 | Month 6 | Month 7 | Month 8 | Month 9 | Month 10 | Month 11 | Month 12 | ||
| Sales | $0 | $0 | $0 | $0 | $0 | $0 | $0 | $0 | $0 | $0 | $0 | $0 | |
| Direct Cost of Sales | $0 | $0 | $0 | $0 | $0 | $0 | $0 | $0 | $0 | $0 | $0 | $0 | |
| Other Costs of Sales | $0 | $0 | $0 | $0 | $0 | $0 | $0 | $0 | $0 | $0 | $0 | $0 | |
| Total Cost of Sales | $0 | $0 | $0 | $0 | $0 | $0 | $0 | $0 | $0 | $0 | $0 | $0 | |
| Gross Margin | $0 | $0 | $0 | $0 | $0 | $0 | $0 | $0 | $0 | $0 | $0 | $0 | |
| Gross Margin % | 0.00% | 0.00% | 0.00% | 0.00% | 0.00% | 0.00% | 0.00% | 0.00% | 0.00% | 0.00% | 0.00% | 0.00% | |
| Expenses | |||||||||||||
| Payroll | $8 | $8 | $8 | $8 | $8 | $8 | $27 | $33 | $43 | $49 | $66 | $66 | |
| Marketing/Promotion | $0 | $0 | $0 | $0 | $0 | $0 | $0 | $0 | $0 | $0 | $0 | $0 | |
| Depreciation | $0 | $0 | $0 | $0 | $0 | $0 | $0 | $0 | $0 | $0 | $0 | $0 | |
| Rent | $0 | $0 | $0 | $0 | $0 | $0 | $0 | $0 | $0 | $0 | $0 | $0 | |
| Utilities | $0 | $0 | $0 | $0 | $0 | $0 | $0 | $0 | $0 | $0 | $0 | $0 | |
| Insurance | $0 | $0 | $0 | $0 | $0 | $0 | $0 | $0 | $0 | $0 | $0 | $0 | |
| Payroll Taxes | 15% | $0 | $0 | $0 | $0 | $0 | $0 | $0 | $0 | $0 | $0 | $0 | $0 |
| Other | $0 | $0 | $0 | $0 | $0 | $0 | $0 | $0 | $0 | $0 | $0 | $0 | |
| Total Operating Expenses | $8 | $8 | $8 | $8 | $8 | $8 | $27 | $33 | $43 | $49 | $66 | $66 | |
| Profit Before Interest and Taxes | ($8) | ($8) | ($8) | ($8) | ($8) | ($8) | ($27) | ($33) | ($43) | ($49) | ($66) | ($66) | |
| EBITDA | ($8) | ($8) | ($8) | ($8) | ($8) | ($8) | ($27) | ($33) | ($43) | ($49) | ($66) | ($66) | |
| Interest Expense | $0 | $0 | $0 | $0 | $0 | $0 | $0 | $0 | $0 | $0 | $0 | $0 | |
| Taxes Incurred | $0 | $0 | $0 | $0 | $0 | $0 | $0 | $0 | $0 | $0 | $0 | $0 | |
| Net Profit | ($8) | ($8) | ($8) | ($8) | ($8) | ($8) | ($27) | ($33) | ($43) | ($49) | ($66) | ($66) | |
| Net Profit/Sales | 0.00% | 0.00% | 0.00% | 0.00% | 0.00% | 0.00% | 0.00% | 0.00% | 0.00% | 0.00% | 0.00% | 0.00% | |
| Pro Forma Cash Flow | |||||||||||||
| Month 1 | Month 2 | Month 3 | Month 4 | Month 5 | Month 6 | Month 7 | Month 8 | Month 9 | Month 10 | Month 11 | Month 12 | ||
| Cash Received | |||||||||||||
| Cash from Operations | |||||||||||||
| Cash Sales | $0 | $0 | $0 | $0 | $0 | $0 | $0 | $0 | $0 | $0 | $0 | $0 | |
| Subtotal Cash from Operations | $0 | $0 | $0 | $0 | $0 | $0 | $0 | $0 | $0 | $0 | $0 | $0 | |
| Additional Cash Received | |||||||||||||
| Sales Tax, VAT, HST/GST Received | 0.00% | $0 | $0 | $0 | $0 | $0 | $0 | $0 | $0 | $0 | $0 | $0 | $0 |
| New Current Borrowing | $0 | $0 | $0 | $0 | $0 | $0 | $0 | $0 | $0 | $0 | $0 | $0 | |
| New Other Liabilities (interest-free) | $0 | $0 | $0 | $0 | $0 | $0 | $0 | $0 | $0 | $0 | $0 | $0 | |
| New Long-term Liabilities | $0 | $0 | $0 | $0 | $0 | $0 | $0 | $0 | $0 | $0 | $0 | $0 | |
| Sales of Other Current Assets | $0 | $0 | $0 | $0 | $0 | $0 | $0 | $0 | $0 | $0 | $0 | $0 | |
| Sales of Long-term Assets | $0 | $0 | $0 | $0 | $0 | $0 | $0 | $0 | $0 | $0 | $0 | $0 | |
| New Investment Received | $250 | $100 | $500 | $1,000 | $2,000 | $0 | $0 | $0 | $10,000 | $0 | $0 | $0 | |
| Subtotal Cash Received | $250 | $100 | $500 | $1,000 | $2,000 | $0 | $0 | $0 | $10,000 | $0 | $0 | $0 | |
| Expenditures | Month 1 | Month 2 | Month 3 | Month 4 | Month 5 | Month 6 | Month 7 | Month 8 | Month 9 | Month 10 | Month 11 | Month 12 | |
| Expenditures from Operations | |||||||||||||
| Cash Spending | $8 | $8 | $8 | $8 | $8 | $8 | $27 | $33 | $43 | $49 | $66 | $66 | |
| Bill Payments | $0 | $0 | $0 | $0 | $0 | $0 | $0 | $0 | $0 | $0 | $0 | $0 | |
| Subtotal Spent on Operations | $8 | $8 | $8 | $8 | $8 | $8 | $27 | $33 | $43 | $49 | $66 | $66 | |
| Additional Cash Spent | |||||||||||||
| Sales Tax, VAT, HST/GST Paid Out | $0 | $0 | $0 | $0 | $0 | $0 | $0 | $0 | $0 | $0 | $0 | $0 | |
| Principal Repayment of Current Borrowing | $0 | $0 | $0 | $0 | $0 | $0 | $0 | $0 | $0 | $0 | $0 | $0 | |
| Other Liabilities Principal Repayment | $0 | $0 | $0 | $0 | $0 | $0 | $0 | $0 | $0 | $0 | $0 | $0 | |
| Long-term Liabilities Principal Repayment | $0 | $0 | $0 | $0 | $0 | $0 | $0 | $0 | $0 | $0 | $0 | $0 | |
| Purchase Other Current Assets | $0 | $0 | $0 | $0 | $0 | $0 | $0 | $0 | $0 | $0 | $0 | $0 | |
| Purchase Long-term Assets | $0 | $0 | $0 | $0 | $0 | $0 | $0 | $0 | $0 | $0 | $0 | $0 | |
| Dividends | $0 | $0 | $0 | $0 | $0 | $0 | $0 | $0 | $0 | $0 | $0 | $0 | |
| Subtotal Cash Spent | $8 | $8 | $8 | $8 | $8 | $8 | $27 | $33 | $43 | $49 | $66 | $66 | |
| Net Cash Flow | $242 | $92 | $492 | $992 | $1,992 | ($8) | ($27) | ($33) | $9,957 | ($49) | ($66) | ($66) | |
| Cash Balance | $282 | $374 | $866 | $1,858 | $3,850 | $3,842 | $3,815 | $3,782 | $13,739 | $13,690 | $13,624 | $13,558 | |
| Pro Forma Balance Sheet | |||||||||||||
| Month 1 | Month 2 | Month 3 | Month 4 | Month 5 | Month 6 | Month 7 | Month 8 | Month 9 | Month 10 | Month 11 | Month 12 | ||
| Assets | Starting Balances | ||||||||||||
| Current Assets | |||||||||||||
| Cash | $40 | $282 | $374 | $866 | $1,858 | $3,850 | $3,842 | $3,815 | $3,782 | $13,739 | $13,690 | $13,624 | $13,558 |
| Other Current Assets | $0 | $0 | $0 | $0 | $0 | $0 | $0 | $0 | $0 | $0 | $0 | $0 | $0 |
| Total Current Assets | $40 | $282 | $374 | $866 | $1,858 | $3,850 | $3,842 | $3,815 | $3,782 | $13,739 | $13,690 | $13,624 | $13,558 |
| Long-term Assets | |||||||||||||
| Long-term Assets | $22 | $22 | $22 | $22 | $22 | $22 | $22 | $22 | $22 | $22 | $22 | $22 | $22 |
| Accumulated Depreciation | $0 | $0 | $0 | $0 | $0 | $0 | $0 | $0 | $0 | $0 | $0 | $0 | $0 |
| Total Long-term Assets | $22 | $22 | $22 | $22 | $22 | $22 | $22 | $22 | $22 | $22 | $22 | $22 | $22 |
| Total Assets | $62 | $304 | $396 | $888 | $1,880 | $3,872 | $3,864 | $3,837 | $3,804 | $13,761 | $13,712 | $13,646 | $13,580 |
| Liabilities and Capital | Month 1 | Month 2 | Month 3 | Month 4 | Month 5 | Month 6 | Month 7 | Month 8 | Month 9 | Month 10 | Month 11 | Month 12 | |
| Current Liabilities | |||||||||||||
| Accounts Payable | $0 | $0 | $0 | $0 | $0 | $0 | $0 | $0 | $0 | $0 | $0 | $0 | $0 |
| Current Borrowing | $0 | $0 | $0 | $0 | $0 | $0 | $0 | $0 | $0 | $0 | $0 | $0 | $0 |
| Other Current Liabilities | $0 | $0 | $0 | $0 | $0 | $0 | $0 | $0 | $0 | $0 | $0 | $0 | $0 |
| Subtotal Current Liabilities | $0 | $0 | $0 | $0 | $0 | $0 | $0 | $0 | $0 | $0 | $0 | $0 | $0 |
| Long-term Liabilities | $0 | $0 | $0 | $0 | $0 | $0 | $0 | $0 | $0 | $0 | $0 | $0 | $0 |
| Total Liabilities | $0 | $0 | $0 | $0 | $0 | $0 | $0 | $0 | $0 | $0 | $0 | $0 | $0 |
| Paid-in Capital | $350 | $600 | $700 | $1,200 | $2,200 | $4,200 | $4,200 | $4,200 | $4,200 | $14,200 | $14,200 | $14,200 | $14,200 |
| Retained Earnings | ($288) | ($288) | ($288) | ($288) | ($288) | ($288) | ($288) | ($288) | ($288) | ($288) | ($288) | ($288) | ($288) |
| Earnings | $0 | ($8) | ($16) | ($24) | ($32) | ($40) | ($48) | ($75) | ($108) | ($151) | ($200) | ($266) | ($332) |
| Total Capital | $62 | $304 | $396 | $888 | $1,880 | $3,872 | $3,864 | $3,837 | $3,804 | $13,761 | $13,712 | $13,646 | $13,580 |
| Total Liabilities and Capital | $62 | $304 | $396 | $888 | $1,880 | $3,872 | $3,864 | $3,837 | $3,804 | $13,761 | $13,712 | $13,646 | $13,580 |
| Net Worth | $62 | $304 | $396 | $888 | $1,880 | $3,872 | $3,864 | $3,837 | $3,804 | $13,761 | $13,712 | $13,646 | $13,580 |


