
Tricky Widgets Manufacturing
Executive Summary
Tricky Widgets Manufacturing (TWM) is a manufacturer of heavy equipment machinery, with one location in Spokane, Washington. TWM is a start-up manufacturing firm. Along with a significant level of its own capital, TWM hopes to initially make a successful effort to secure start-up financing to begin operations.
TWM is looking to conduct operations at its location to meet an ever-growing level of demand for heavy equipment machinery products. The company’s initial product offering will include the “Widget Basic,” “Widget Deluxe,” and “Widget Premium.” These products are expected to be very popular among commercial construction companies because of their versatility and accurate control capabilities. Strong contact relationships and referral networks among commercial construction company owners are expected to allow for a rapid entry into this market.
1.1 Mission
TWM aims to offer high-quality heavy equipment machinery for the commercial construction industry at a price which is competitive in comparison to other premium-quality commercial machinery manufacturers in the market. The management of TWM believes there is a current untapped market opportunity because 1) existing providers of construction machinery are too diversified to serve the increasingly specialized needs of the commercial construction segment, and 2) the incorporation of greater precision controls within such machinery will greater serve the needs of this segment of the construction machinery industry.
1.2 Keys to Success
TWM’s keys to success will include:
- A high level of quality in its product line.
- Maintaining and growing its referral networks to generate new and repeat sales.
- Significant investments in research and development and engineering with the aim to focus on precisely controlled equipment.
- Improving efficiencies of operations.
Company Summary
TWM is a start-up manufacturing firm which will be managed by four executives representing administration, marketing, sales, and finance. These executives bring to the company a large degree of experience in the equipment manufacturing industry. They perceive an opportunity to acquire a significant amount of market share by focusing on the specific needs of the commercial construction industry and by providing greater precision controls to their products than other competitors. The company will be organized as a closely-held corporation with a majority of the shares held by the four principle executives.
The company will be seeking to raise approximately $4.5 million in loans and another $500,000 from private investors for start-up purposes. The company will have one manufacturing facility in Spokane, Washington.
2.1 Company Ownership
The company will be a closely-held corporation with six principle shareholders who will form the Board of Directors. It is anticipated that within the next five years, the company will be instituting a public offering to enlarge its ability to acquire financing. The principle owners will seek to retain the majority of the company’s stock for the foreseeable future. The company is incorporated in the state of Delaware as this offers the most advantageous conditions of taxes etc.
2.2 Start-up Summary
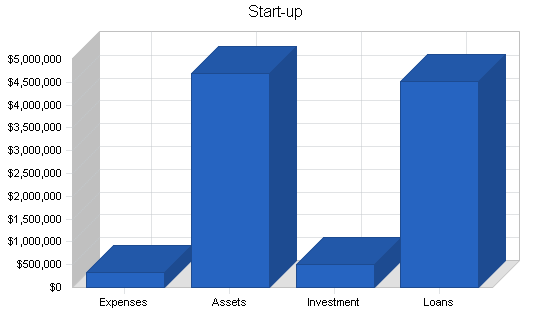
The following table and chart illustrates projected initial start-up costs for the firm.
| Start-up | |
| Requirements | |
| Start-up Expenses | |
| Legal | $4,000 |
| Rent | $24,000 |
| Advertising | $15,000 |
| Insurance | $12,000 |
| Research and Development | $250,000 |
| Office setup | $10,000 |
| Other | $3,000 |
| Total Start-up Expenses | $318,000 |
| Start-up Assets | |
| Cash Required | $2,000,000 |
| Start-up Inventory | $100,000 |
| Other Current Assets | $100,000 |
| Long-term Assets | $2,500,000 |
| Total Assets | $4,700,000 |
| Total Requirements | $5,018,000 |
| Start-up Funding | |
| Start-up Expenses to Fund | $318,000 |
| Start-up Assets to Fund | $4,700,000 |
| Total Funding Required | $5,018,000 |
| Assets | |
| Non-cash Assets from Start-up | $2,700,000 |
| Cash Requirements from Start-up | $2,000,000 |
| Additional Cash Raised | $0 |
| Cash Balance on Starting Date | $2,000,000 |
| Total Assets | $4,700,000 |
| Liabilities and Capital | |
| Liabilities | |
| Current Borrowing | $0 |
| Long-term Liabilities | $4,500,000 |
| Accounts Payable (Outstanding Bills) | $10,000 |
| Other Current Liabilities (interest-free) | $0 |
| Total Liabilities | $4,510,000 |
| Capital | |
| Planned Investment | |
| Investor 1 | $55,000 |
| Investor 2 | $43,000 |
| Investor 3 | $160,000 |
| Investor 4 | $60,000 |
| Investor 5 | $120,000 |
| Investor 6 | $70,000 |
| Additional Investment Requirement | $0 |
| Total Planned Investment | $508,000 |
| Loss at Start-up (Start-up Expenses) | ($318,000) |
| Total Capital | $190,000 |
| Total Capital and Liabilities | $4,700,000 |
| Total Funding | $5,018,000 |
Products
TWM will manufacture heavy equipment machinery for all phases of commercial construction needs. Primary focus will be placed on product engineering and manufacturing processes to ensure the highest quality, a high level of product features, and the most efficient manufacturing process possible.
TWM will manufacture heavy equipment machinery products called the “Widget Basic,” “Widget Deluxe,” and “Widget Premium.” All Widget products will be capable of lifting 50 tons, and are specially designed to be extremely precise when controlling movement of the various features of the machine.
The Widget Basic will include features including a large “grabber” arm, for tasks such as girder installation and placement, and a back-hoe lifter for land clearance.
The Widget Deluxe will include features including a large “grabber” arm, for tasks such as girder installation and placement, a back-hoe lifter for land clearance, and a wrecker ball attachment for building demolition.
The Widget Premium will include features including a large “grabber” arm for tasks such as girder installation and placement; a back hoe lifter for land clearance; a wrecker ball attachment for building demolition; and an elevating device to lift as many as ten crewpersons up to 10 stories.
3.1 Industry Analysis
The industry is dominated by a few very large companies, such as Caterpillar, Komatsu, Ingersoll Rand, and Linde AG. Of these major competitors, Caterpillar is the largest, with approximately 40% market share. Last year, Caterpillar reported sales of approximately $20 billion and Komatsu, Ingersoll Rand, and Linde AG each reported around $8-9 billion. Each of these giants has large or multisegment marketing strategies that provide general equipment for large blocks of customers.
Companies market their products through established local distributors who are often franchises of the parent manufacturers. There is limited direct sales to very large customers. The advantage of such distributors is the ability to provide financing, rapid servicing and replacement of such equipment as well as providing close relationships between customers and service providers that allows for maximizing equipment usage.
Customers who purchase such equipment require reliability, rapid servicing/availability of parts, and versatility for a variety of anticipated and unanticipated uses. Customers are influenced by reputation and cost, since equipment purchases can be the most significant portion of the customer’s long-term assets.
Market Analysis Summary
The construction machinery industry experienced sales of approximately $15.4 billion last year. Power cranes, draglines, and excavators, which are similar to TWM’s products, had a total sales of $3.2 billion. The construction machinery industry is a mature market with approximately five percent annual growth.
Customers within the market consist of commercial construction companies, equipment rental and leasing companies, general construction firms, and to a lesser degree, adjacent market segments such as mining, industrial, agricultural, forestry, and waste management companies. Of these, commercial construction companies will be the dominate consumers of TWM’s products as they have the deepest pockets, the greatest need for large orders of machinery, and the greatest need for precision controlled equipment.
The most rapidly growing sub-segment of the commercial construction segment is the small construction companies. These firms have relatively low entry/exit barriers to the market. However, these companies are not seen as a potentially large market for TWM since they have such low market capitalization.
The market is strongly effected by the current trends in the economy. Companies such as Caterpillar and Komatsu have seen recent decreases in sales due to a weakening global economy and decreasing consumer confidence. If recent downturns in the market prove to be long-lasting, then TWM may have a significantly more difficult time acquiring sales contracts and financing.
Brought to you by
Create a professional business plan
Using AI and step-by-step instructions
Create Your PlanSecure funding
Validate ideas
Build a strategy
One of the more recent trends in the construction machinery industry is to create more and more specialized equipment for the various market segments and to focus research and development on providing multitask machinery that is attractive to the companies with less market capitalization. It is TWM’s goal to be the industry leader in focusing on these trends and being the first to market with innovative designs reflecting these changes.
| Market Analysis | |||||||
| Year 1 | Year 2 | Year 3 | Year 4 | Year 5 | |||
| Potential Customers | Growth | CAGR | |||||
| Major Commerical Construction Companies | 15% | 25,000 | 28,750 | 33,063 | 38,022 | 43,725 | 15.00% |
| Mid-Sized Commercial Construction Companies | 10% | 5,000 | 5,500 | 6,050 | 6,655 | 7,321 | 10.00% |
| Small Commercial Construction Companies | 3% | 5,000 | 5,150 | 5,305 | 5,464 | 5,628 | 3.00% |
| Total | 12.81% | 35,000 | 39,400 | 44,418 | 50,141 | 56,674 | 12.81% |
4.1 Market Segmentation
TWM will focus on the large commercial construction companies with over $2 billion in annual revenue. These companies are looking for heavy equipment machinery that will last for a long period of time, will do the job effectively and quickly, are easy to operate, are extremely precise in control of movement, and offer a high number of features including safety types of features to minimize liability and employee injury risks. Typically these companies lean towards the Widget Deluxe or Widget Premium products.
Mid-size commercial construction companies are a secondary market for TWM. These companies are more interested in the Widget Basic and Widget Deluxe. Mid-size commercial construction companies range from $500 million to $2 billion in annual revenue. Cost savings is more important to these companies, who are still in the growth stage of the business cycle.

4.2 Target Market Segment Strategy
TWM primarily focuses on its target market, the large commercial construction company, through direct selling via its various relationship and referral networks. In addition, a significant amount of investment will be made in advertising to promote product awareness. Direct selling is far more effective in closing sales as well as in terms of sales and marketing costs.
TWM uses the tool of product demonstrations at its site to close sales. Potential clients’ travel costs to TWM’s site for product demonstrations is covered by TWM. Product demonstrations are a critical step in the sales process. This is the opportunity to prove the capabilities of our products, educate the potential client, and establish a relationship.
4.3 Market Needs
The volume of commercial construction activity has been steadily increasing since the mid-1980s. Demand for heavy machinery equipment has been steadily increasing as new entrants come into the market and current participants grow their operations.
Modern complex designs, earthquake proofing, and other factors have increased demand for higher precision and accuracy in controls of heavy machinery equipment in commercial construction operations.
4.4 Competition and Buying Patterns
TWM faces approximately 55 major competitors nationally. The top player is Caterpillar and has been in the market for 40 years. Their name is very well known and their products are trusted. Their products practically sell themselves.
Large commercial construction companies typically look for the most widely used equipment that has an established name and reputation for quality, durability, and versatility. Product demonstrations are a critical part of the buying process, especially when a buyer is working with a smaller, less known company.
Similar competitors design, manufacture, and market power equipment that play a niche role in commercial construction and material movement. This segment’s products include skid-steer loaders, compact hydraulic excavators, industrial vehicles, pavers, and compactors, drilling equipment, and rough-terrain material handlers.
Strategy and Implementation Summary
TWM will succeed by manufacturing high quality, durable heavy equipment machinery with a significant number of product features and options which are extremely precise in control of movement. It will focus on a very narrow segment of the market and attempt to achieve the best reputation in that segment.
5.1 Competitive Edge
TWM’s competitive edge is its level of quality, product features and options, and the company’s relationships with several major commercial construction companies nationwide.
5.2 Sales Strategy
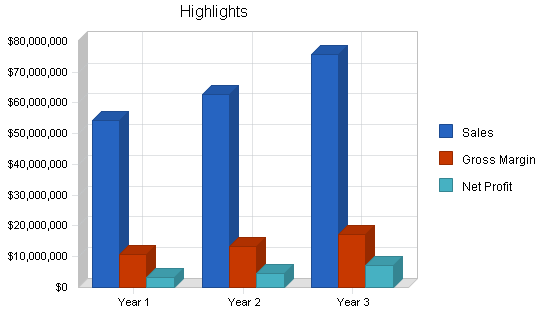
As the table shows, TWM plans to deliver sales of approximately $54 million in the current year, $62 million in the second year, and $75 million in the third year following this plan.
5.2.1 Sales Forecast
The company will begin by utilizing its extensive contacts with several major construction companies to leverage contracts through direct sales methods and onsite demonstrations. A number of these companies have expressed an interest in purchasing the proposed products of TWM. The company’s extensive advertising campaign will be used to create product awareness through the use of trade journals, direct mail advertising, and other means. At some future date, the company will seek to entice major equipment distributors to carry TWM’s products once the company has established a firm reputation. The establishment of a post sales servicing and parts division will provide additional sales and opportunities for marketing new products.

| Sales Forecast | |||
| Year 1 | Year 2 | Year 3 | |
| Unit Sales | |||
| Widget Basic | 295 | 310 | 341 |
| Widget Deluxe | 335 | 352 | 387 |
| Widget Premium | 362 | 380 | 418 |
| Other | 0 | 0 | 0 |
| Total Unit Sales | 992 | 1,042 | 1,146 |
| Unit Prices | Year 1 | Year 2 | Year 3 |
| Widget Basic | $35,000.00 | $38,500.00 | $42,350.00 |
| Widget Deluxe | $50,000.00 | $55,000.00 | $60,500.00 |
| Widget Premium | $75,000.00 | $82,500.00 | $90,750.00 |
| Other | $0.00 | $0.00 | $0.00 |
| Sales | |||
| Widget Basic | $10,327,309 | $11,928,042 | $14,432,931 |
| Widget Deluxe | $16,765,112 | $19,363,705 | $23,430,082 |
| Widget Premium | $27,159,482 | $31,369,201 | $37,956,734 |
| Other | $0 | $0 | $0 |
| Total Sales | $54,251,903 | $62,660,948 | $75,819,747 |
| Direct Unit Costs | Year 1 | Year 2 | Year 3 |
| Widget Basic | $28,000.00 | $30,240.00 | $32,659.20 |
| Widget Deluxe | $40,000.00 | $43,200.00 | $46,656.00 |
| Widget Premium | $60,000.00 | $64,800.00 | $69,984.00 |
| Other | $0.00 | $0.00 | $0.00 |
| Direct Cost of Sales | |||
| Widget Basic | $8,261,847 | $9,368,935 | $11,130,295 |
| Widget Deluxe | $13,412,090 | $15,209,310 | $18,068,660 |
| Widget Premium | $21,727,585 | $24,639,082 | $29,271,229 |
| Other | $0 | $0 | $0 |
| Subtotal Direct Cost of Sales | $43,401,522 | $49,217,326 | $58,470,184 |
Management Summary
Jim Mitchell
Chief Executive Officer. Extensive experience in the manufacturing industry with sales and marketing capacities.
Ike Smith
Chief Financial Officer. Brings experience with a heavy focus in finance.
Pat Hyder
VP of Sales. Strong background in manufacturing sales, business development, and strategic partnership development.
Pamela Jules
VP of Marketing. Strong background in marketing within the heavy equipment manufacturing industry. Extensive experience in business development and strategic partnership development.
6.1 Personnel Plan
As the personnel plan shows, TWM expects to make significant investments in research and development.
| Personnel Plan | |||
| Year 1 | Year 2 | Year 3 | |
| Executives | $480,000 | $504,000 | $529,200 |
| Managers | $960,000 | $1,008,000 | $1,058,400 |
| Manufacturing Process Workers | $720,000 | $756,000 | $793,800 |
| Engineering | $3,000,000 | $3,150,000 | $3,307,500 |
| Total People | 115 | 127 | 175 |
| Total Payroll | $5,160,000 | $5,418,000 | $5,688,900 |
Financial Plan
TWM expects to raise $4.5 million in loans along with $.5 million in private investment for start-up costs for the first three years. An additional $50 million in financing is expected to be raised in an initial public offering that is scheduled to occur between years three-five. This will provide the bulk of the financing required to grow operations at the planned rate.
7.1 Important Assumptions
Important assumptions for this plan are found in the following table.
| General Assumptions | |||
| Year 1 | Year 2 | Year 3 | |
| Plan Month | 1 | 2 | 3 |
| Current Interest Rate | 10.00% | 10.00% | 10.00% |
| Long-term Interest Rate | 10.00% | 10.00% | 10.00% |
| Tax Rate | 30.00% | 30.00% | 30.00% |
| Other | 0 | 0 | 0 |
7.2 Break-even Analysis
TWM’s break-even analysis is based on the average of the first-year figures for total sales and by operating expenses. These are presented as per-unit revenue, per-unit cost, and fixed costs. These conservative assumptions make for a more accurate estimate of real risk.

| Break-even Analysis | |
| Monthly Units Break-even | 44 |
| Monthly Revenue Break-even | $2,381,000 |
| Assumptions: | |
| Average Per-Unit Revenue | $54,689.42 |
| Average Per-Unit Variable Cost | $43,751.53 |
| Estimated Monthly Fixed Cost | $476,200 |
7.3 Projected Profit and Loss
As the profit and loss table shows, TWM expects to continue its steady growth in profitability over the next three years of operations.


| Pro Forma Profit and Loss | |||
| Year 1 | Year 2 | Year 3 | |
| Sales | $54,251,903 | $62,660,948 | $75,819,747 |
| Direct Cost of Sales | $43,401,522 | $49,217,326 | $58,470,184 |
| Other | $0 | $0 | $0 |
| Total Cost of Sales | $43,401,522 | $49,217,326 | $58,470,184 |
| Gross Margin | $10,850,381 | $13,443,622 | $17,349,563 |
| Gross Margin % | 20.00% | 21.45% | 22.88% |
| Expenses | |||
| Payroll | $5,160,000 | $5,418,000 | $5,688,900 |
| Sales and Marketing and Other Expenses | $242,400 | $540,800 | $829,200 |
| Depreciation | $300,000 | $300,000 | $300,000 |
| Utilities | $12,000 | $14,000 | $15,000 |
| Payroll Taxes | $0 | $0 | $0 |
| Other | $0 | $0 | $0 |
| Total Operating Expenses | $5,714,400 | $6,272,800 | $6,833,100 |
| Profit Before Interest and Taxes | $5,135,981 | $7,170,822 | $10,516,463 |
| EBITDA | $5,435,981 | $7,470,822 | $10,816,463 |
| Interest Expense | $673,381 | $538,595 | $380,991 |
| Taxes Incurred | $1,338,780 | $1,989,668 | $3,040,642 |
| Net Profit | $3,123,819 | $4,642,559 | $7,094,831 |
| Net Profit/Sales | 5.76% | 7.41% | 9.36% |
Brought to you by
Create a professional business plan
Using AI and step-by-step instructions
Create Your PlanSecure funding
Validate ideas
Build a strategy
7.4 Projected Cash Flow
The cash flow projection shows that provisions for ongoing expenses are adequate to meet TWM’s needs as the business generates cash flow sufficient to support operations. The second and third month decrease in cash flow reflects the payment of initial cost of goods sold prior to a large number of receipts being paid. As can be seen, TWM has anticipated such a decrease and has arranged a line of credit to cover cash shortages.

| Pro Forma Cash Flow | |||
| Year 1 | Year 2 | Year 3 | |
| Cash Received | |||
| Cash from Operations | |||
| Cash Sales | $27,125,951 | $31,330,474 | $37,909,873 |
| Cash from Receivables | $22,227,991 | $30,571,290 | $36,721,873 |
| Subtotal Cash from Operations | $49,353,943 | $61,901,764 | $74,631,747 |
| Additional Cash Received | |||
| Sales Tax, VAT, HST/GST Received | $0 | $0 | $0 |
| New Current Borrowing | $2,600,000 | $0 | $0 |
| New Other Liabilities (interest-free) | $0 | $0 | $0 |
| New Long-term Liabilities | $0 | $0 | $0 |
| Sales of Other Current Assets | $0 | $0 | $0 |
| Sales of Long-term Assets | $0 | $0 | $0 |
| New Investment Received | $0 | $0 | $0 |
| Subtotal Cash Received | $51,953,943 | $61,901,764 | $74,631,747 |
| Expenditures | Year 1 | Year 2 | Year 3 |
| Expenditures from Operations | |||
| Cash Spending | $5,160,000 | $5,418,000 | $5,688,900 |
| Bill Payments | $45,818,085 | $52,731,967 | $62,793,055 |
| Subtotal Spent on Operations | $50,978,085 | $58,149,967 | $68,481,955 |
| Additional Cash Spent | |||
| Sales Tax, VAT, HST/GST Paid Out | $0 | $0 | $0 |
| Principal Repayment of Current Borrowing | $0 | $2,600,000 | $0 |
| Other Liabilities Principal Repayment | $0 | $0 | $0 |
| Long-term Liabilities Principal Repayment | $276,036 | $276,038 | $276,038 |
| Purchase Other Current Assets | $0 | $0 | $0 |
| Purchase Long-term Assets | $0 | $0 | $0 |
| Dividends | $0 | $0 | $0 |
| Subtotal Cash Spent | $51,254,121 | $61,026,005 | $68,757,993 |
| Net Cash Flow | $699,822 | $875,759 | $5,873,754 |
| Cash Balance | $2,699,822 | $3,575,580 | $9,449,334 |
7.5 Projected Balance Sheet
TWM’s projected company balance sheet follows.
| Pro Forma Balance Sheet | |||
| Year 1 | Year 2 | Year 3 | |
| Assets | |||
| Current Assets | |||
| Cash | $2,699,822 | $3,575,580 | $9,449,334 |
| Accounts Receivable | $4,897,960 | $5,657,144 | $6,845,144 |
| Inventory | $4,425,915 | $5,018,988 | $5,962,558 |
| Other Current Assets | $100,000 | $100,000 | $100,000 |
| Total Current Assets | $12,123,697 | $14,351,712 | $22,357,036 |
| Long-term Assets | |||
| Long-term Assets | $2,500,000 | $2,500,000 | $2,500,000 |
| Accumulated Depreciation | $300,000 | $600,000 | $900,000 |
| Total Long-term Assets | $2,200,000 | $1,900,000 | $1,600,000 |
| Total Assets | $14,323,697 | $16,251,712 | $23,957,036 |
| Liabilities and Capital | Year 1 | Year 2 | Year 3 |
| Current Liabilities | |||
| Accounts Payable | $4,185,913 | $4,347,408 | $5,233,939 |
| Current Borrowing | $2,600,000 | $0 | $0 |
| Other Current Liabilities | $0 | $0 | $0 |
| Subtotal Current Liabilities | $6,785,913 | $4,347,408 | $5,233,939 |
| Long-term Liabilities | $4,223,964 | $3,947,926 | $3,671,888 |
| Total Liabilities | $11,009,877 | $8,295,334 | $8,905,827 |
| Paid-in Capital | $508,000 | $508,000 | $508,000 |
| Retained Earnings | ($318,000) | $2,805,819 | $7,448,378 |
| Earnings | $3,123,819 | $4,642,559 | $7,094,831 |
| Total Capital | $3,313,819 | $7,956,378 | $15,051,209 |
| Total Liabilities and Capital | $14,323,697 | $16,251,712 | $23,957,036 |
| Net Worth | $3,313,819 | $7,956,378 | $15,051,209 |
7.6 Business Ratios
Business ratios for the years of this plan are shown below. Industry profile ratios based on the Standard Industrial Classification (SIC) code 3531, Construction Machinery, are shown for comparison.
| Ratio Analysis | ||||
| Year 1 | Year 2 | Year 3 | Industry Profile | |
| Sales Growth | 0.00% | 15.50% | 21.00% | 0.10% |
| Percent of Total Assets | ||||
| Accounts Receivable | 34.19% | 34.81% | 28.57% | 31.10% |
| Inventory | 30.90% | 30.88% | 24.89% | 29.10% |
| Other Current Assets | 0.70% | 0.62% | 0.42% | 20.00% |
| Total Current Assets | 84.64% | 88.31% | 93.32% | 80.20% |
| Long-term Assets | 15.36% | 11.69% | 6.68% | 19.80% |
| Total Assets | 100.00% | 100.00% | 100.00% | 100.00% |
| Current Liabilities | 47.38% | 26.75% | 21.85% | 38.00% |
| Long-term Liabilities | 29.49% | 24.29% | 15.33% | 16.80% |
| Total Liabilities | 76.86% | 51.04% | 37.17% | 54.80% |
| Net Worth | 23.14% | 48.96% | 62.83% | 45.20% |
| Percent of Sales | ||||
| Sales | 100.00% | 100.00% | 100.00% | 100.00% |
| Gross Margin | 20.00% | 21.45% | 22.88% | 28.00% |
| Selling, General & Administrative Expenses | 14.59% | 14.37% | 13.73% | 15.20% |
| Advertising Expenses | 0.11% | 0.13% | 0.15% | 0.50% |
| Profit Before Interest and Taxes | 9.47% | 11.44% | 13.87% | 3.30% |
| Main Ratios | ||||
| Current | 1.79 | 3.30 | 4.27 | 2.11 |
| Quick | 1.13 | 2.15 | 3.13 | 1.14 |
| Total Debt to Total Assets | 76.86% | 51.04% | 37.17% | 54.80% |
| Pre-tax Return on Net Worth | 134.67% | 83.36% | 67.34% | 7.30% |
| Pre-tax Return on Assets | 31.16% | 40.81% | 42.31% | 16.20% |
| Additional Ratios | Year 1 | Year 2 | Year 3 | |
| Net Profit Margin | 5.76% | 7.41% | 9.36% | n.a |
| Return on Equity | 94.27% | 58.35% | 47.14% | n.a |
| Activity Ratios | ||||
| Accounts Receivable Turnover | 5.54 | 5.54 | 5.54 | n.a |
| Collection Days | 57 | 61 | 60 | n.a |
| Inventory Turnover | 10.91 | 10.42 | 10.65 | n.a |
| Accounts Payable Turnover | 11.94 | 12.17 | 12.17 | n.a |
| Payment Days | 27 | 29 | 27 | n.a |
| Total Asset Turnover | 3.79 | 3.86 | 3.16 | n.a |
| Debt Ratios | ||||
| Debt to Net Worth | 3.32 | 1.04 | 0.59 | n.a |
| Current Liab. to Liab. | 0.62 | 0.52 | 0.59 | n.a |
| Liquidity Ratios | ||||
| Net Working Capital | $5,337,783 | $10,004,304 | $17,123,097 | n.a |
| Interest Coverage | 7.63 | 13.31 | 27.60 | n.a |
| Additional Ratios | ||||
| Assets to Sales | 0.26 | 0.26 | 0.32 | n.a |
| Current Debt/Total Assets | 47% | 27% | 22% | n.a |
| Acid Test | 0.41 | 0.85 | 1.82 | n.a |
| Sales/Net Worth | 16.37 | 7.88 | 5.04 | n.a |
| Dividend Payout | 0.00 | 0.00 | 0.00 | n.a |
Appendix
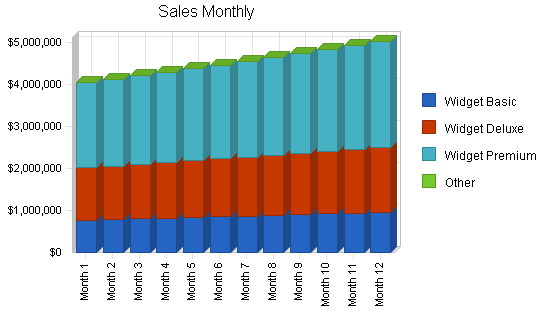
| Sales Forecast | |||||||||||||
| Month 1 | Month 2 | Month 3 | Month 4 | Month 5 | Month 6 | Month 7 | Month 8 | Month 9 | Month 10 | Month 11 | Month 12 | ||
| Unit Sales | |||||||||||||
| Widget Basic | 0% | 22 | 22 | 23 | 23 | 24 | 24 | 25 | 25 | 26 | 26 | 27 | 27 |
| Widget Deluxe | 0% | 25 | 26 | 26 | 27 | 27 | 28 | 28 | 29 | 29 | 30 | 30 | 31 |
| Widget Premium | 0% | 27 | 28 | 28 | 29 | 29 | 30 | 30 | 31 | 32 | 32 | 33 | 34 |
| Other | 0% | 0 | 0 | 0 | 0 | 0 | 0 | 0 | 0 | 0 | 0 | 0 | 0 |
| Total Unit Sales | 74 | 75 | 77 | 79 | 80 | 82 | 83 | 85 | 87 | 88 | 90 | 92 | |
| Unit Prices | Month 1 | Month 2 | Month 3 | Month 4 | Month 5 | Month 6 | Month 7 | Month 8 | Month 9 | Month 10 | Month 11 | Month 12 | |
| Widget Basic | $35,000.00 | $35,000.00 | $35,000.00 | $35,000.00 | $35,000.00 | $35,000.00 | $35,000.00 | $35,000.00 | $35,000.00 | $35,000.00 | $35,000.00 | $35,000.00 | |
| Widget Deluxe | $50,000.00 | $50,000.00 | $50,000.00 | $50,000.00 | $50,000.00 | $50,000.00 | $50,000.00 | $50,000.00 | $50,000.00 | $50,000.00 | $50,000.00 | $50,000.00 | |
| Widget Premium | $75,000.00 | $75,000.00 | $75,000.00 | $75,000.00 | $75,000.00 | $75,000.00 | $75,000.00 | $75,000.00 | $75,000.00 | $75,000.00 | $75,000.00 | $75,000.00 | |
| Other | $0.00 | $0.00 | $0.00 | $0.00 | $0.00 | $10.00 | $10.00 | $10.00 | $10.00 | $10.00 | $10.00 | $10.00 | |
| Sales | |||||||||||||
| Widget Basic | $770,000 | $785,400 | $801,108 | $817,130 | $833,473 | $850,142 | $867,145 | $884,488 | $902,178 | $920,221 | $938,626 | $957,398 | |
| Widget Deluxe | $1,250,000 | $1,275,000 | $1,300,500 | $1,326,510 | $1,353,040 | $1,380,101 | $1,407,703 | $1,435,857 | $1,464,574 | $1,493,866 | $1,523,743 | $1,554,218 | |
| Widget Premium | $2,025,000 | $2,065,500 | $2,106,810 | $2,148,946 | $2,191,925 | $2,235,764 | $2,280,479 | $2,326,088 | $2,372,610 | $2,420,062 | $2,468,464 | $2,517,833 | |
| Other | $0 | $0 | $0 | $0 | $0 | $0 | $0 | $0 | $0 | $0 | $0 | $0 | |
| Total Sales | $4,045,000 | $4,125,900 | $4,208,418 | $4,292,586 | $4,378,438 | $4,466,007 | $4,555,327 | $4,646,434 | $4,739,362 | $4,834,149 | $4,930,832 | $5,029,449 | |
| Direct Unit Costs | Month 1 | Month 2 | Month 3 | Month 4 | Month 5 | Month 6 | Month 7 | Month 8 | Month 9 | Month 10 | Month 11 | Month 12 | |
| Widget Basic | 0.00% | $28,000.00 | $28,000.00 | $28,000.00 | $28,000.00 | $28,000.00 | $28,000.00 | $28,000.00 | $28,000.00 | $28,000.00 | $28,000.00 | $28,000.00 | $28,000.00 |
| Widget Deluxe | 0.00% | $40,000.00 | $40,000.00 | $40,000.00 | $40,000.00 | $40,000.00 | $40,000.00 | $40,000.00 | $40,000.00 | $40,000.00 | $40,000.00 | $40,000.00 | $40,000.00 |
| Widget Premium | 0.00% | $60,000.00 | $60,000.00 | $60,000.00 | $60,000.00 | $60,000.00 | $60,000.00 | $60,000.00 | $60,000.00 | $60,000.00 | $60,000.00 | $60,000.00 | $60,000.00 |
| Other | 0.00% | $0.00 | $0.00 | $0.00 | $0.00 | $0.00 | $0.00 | $0.00 | $0.00 | $0.00 | $0.00 | $0.00 | $0.00 |
| Direct Cost of Sales | |||||||||||||
| Widget Basic | $616,000 | $628,320 | $640,886 | $653,704 | $666,778 | $680,114 | $693,716 | $707,590 | $721,742 | $736,177 | $750,901 | $765,919 | |
| Widget Deluxe | $1,000,000 | $1,020,000 | $1,040,400 | $1,061,208 | $1,082,432 | $1,104,081 | $1,126,162 | $1,148,686 | $1,171,659 | $1,195,093 | $1,218,994 | $1,243,374 | |
| Widget Premium | $1,620,000 | $1,652,400 | $1,685,448 | $1,719,157 | $1,753,540 | $1,788,611 | $1,824,383 | $1,860,871 | $1,898,088 | $1,936,050 | $1,974,771 | $2,014,266 | |
| Other | $0 | $0 | $0 | $0 | $0 | $0 | $0 | $0 | $0 | $0 | $0 | $0 | |
| Subtotal Direct Cost of Sales | $3,236,000 | $3,300,720 | $3,366,734 | $3,434,069 | $3,502,750 | $3,572,805 | $3,644,262 | $3,717,147 | $3,791,490 | $3,867,320 | $3,944,666 | $4,023,559 | |
| Personnel Plan | |||||||||||||
| Month 1 | Month 2 | Month 3 | Month 4 | Month 5 | Month 6 | Month 7 | Month 8 | Month 9 | Month 10 | Month 11 | Month 12 | ||
| Executives | 0% | $40,000 | $40,000 | $40,000 | $40,000 | $40,000 | $40,000 | $40,000 | $40,000 | $40,000 | $40,000 | $40,000 | $40,000 |
| Managers | 0% | $80,000 | $80,000 | $80,000 | $80,000 | $80,000 | $80,000 | $80,000 | $80,000 | $80,000 | $80,000 | $80,000 | $80,000 |
| Manufacturing Process Workers | 0% | $60,000 | $60,000 | $60,000 | $60,000 | $60,000 | $60,000 | $60,000 | $60,000 | $60,000 | $60,000 | $60,000 | $60,000 |
| Engineering | 0% | $250,000 | $250,000 | $250,000 | $250,000 | $250,000 | $250,000 | $250,000 | $250,000 | $250,000 | $250,000 | $250,000 | $250,000 |
| Total People | 75 | 75 | 75 | 75 | 85 | 85 | 85 | 100 | 100 | 100 | 100 | 115 | |
| Total Payroll | $430,000 | $430,000 | $430,000 | $430,000 | $430,000 | $430,000 | $430,000 | $430,000 | $430,000 | $430,000 | $430,000 | $430,000 | |
| Pro Forma Profit and Loss | |||||||||||||
| Month 1 | Month 2 | Month 3 | Month 4 | Month 5 | Month 6 | Month 7 | Month 8 | Month 9 | Month 10 | Month 11 | Month 12 | ||
| Sales | $4,045,000 | $4,125,900 | $4,208,418 | $4,292,586 | $4,378,438 | $4,466,007 | $4,555,327 | $4,646,434 | $4,739,362 | $4,834,149 | $4,930,832 | $5,029,449 | |
| Direct Cost of Sales | $3,236,000 | $3,300,720 | $3,366,734 | $3,434,069 | $3,502,750 | $3,572,805 | $3,644,262 | $3,717,147 | $3,791,490 | $3,867,320 | $3,944,666 | $4,023,559 | |
| Other | $0 | $0 | $0 | $0 | $0 | $0 | $0 | $0 | $0 | $0 | $0 | $0 | |
| Total Cost of Sales | $3,236,000 | $3,300,720 | $3,366,734 | $3,434,069 | $3,502,750 | $3,572,805 | $3,644,262 | $3,717,147 | $3,791,490 | $3,867,320 | $3,944,666 | $4,023,559 | |
| Gross Margin | $809,000 | $825,180 | $841,684 | $858,517 | $875,688 | $893,201 | $911,065 | $929,287 | $947,872 | $966,830 | $986,166 | $1,005,890 | |
| Gross Margin % | 20.00% | 20.00% | 20.00% | 20.00% | 20.00% | 20.00% | 20.00% | 20.00% | 20.00% | 20.00% | 20.00% | 20.00% | |
| Expenses | |||||||||||||
| Payroll | $430,000 | $430,000 | $430,000 | $430,000 | $430,000 | $430,000 | $430,000 | $430,000 | $430,000 | $430,000 | $430,000 | $430,000 | |
| Sales and Marketing and Other Expenses | $20,200 | $20,200 | $20,200 | $20,200 | $20,200 | $20,200 | $20,200 | $20,200 | $20,200 | $20,200 | $20,200 | $20,200 | |
| Depreciation | $25,000 | $25,000 | $25,000 | $25,000 | $25,000 | $25,000 | $25,000 | $25,000 | $25,000 | $25,000 | $25,000 | $25,000 | |
| Utilities | $1,000 | $1,000 | $1,000 | $1,000 | $1,000 | $1,000 | $1,000 | $1,000 | $1,000 | $1,000 | $1,000 | $1,000 | |
| Payroll Taxes | 15% | $0 | $0 | $0 | $0 | $0 | $0 | $0 | $0 | $0 | $0 | $0 | $0 |
| Other | $0 | $0 | $0 | $0 | $0 | $0 | $0 | $0 | $0 | $0 | $0 | $0 | |
| Total Operating Expenses | $476,200 | $476,200 | $476,200 | $476,200 | $476,200 | $476,200 | $476,200 | $476,200 | $476,200 | $476,200 | $476,200 | $476,200 | |
| Profit Before Interest and Taxes | $332,800 | $348,980 | $365,484 | $382,317 | $399,488 | $417,001 | $434,865 | $453,087 | $471,672 | $490,630 | $509,966 | $529,690 | |
| EBITDA | $357,800 | $373,980 | $390,484 | $407,317 | $424,488 | $442,001 | $459,865 | $478,087 | $496,672 | $515,630 | $534,966 | $554,690 | |
| Interest Expense | $37,308 | $58,783 | $58,592 | $58,400 | $58,208 | $58,017 | $57,825 | $57,633 | $57,441 | $57,250 | $57,058 | $56,866 | |
| Taxes Incurred | $88,648 | $87,059 | $92,068 | $97,175 | $102,384 | $107,695 | $113,112 | $118,636 | $124,269 | $130,014 | $135,873 | $141,847 | |
| Net Profit | $206,844 | $203,138 | $214,824 | $226,742 | $238,896 | $251,289 | $263,928 | $276,818 | $289,962 | $303,366 | $317,036 | $330,976 | |
| Net Profit/Sales | 5.11% | 4.92% | 5.10% | 5.28% | 5.46% | 5.63% | 5.79% | 5.96% | 6.12% | 6.28% | 6.43% | 6.58% | |
| Pro Forma Cash Flow | |||||||||||||
| Month 1 | Month 2 | Month 3 | Month 4 | Month 5 | Month 6 | Month 7 | Month 8 | Month 9 | Month 10 | Month 11 | Month 12 | ||
| Cash Received | |||||||||||||
| Cash from Operations | |||||||||||||
| Cash Sales | $2,022,500 | $2,062,950 | $2,104,209 | $2,146,293 | $2,189,219 | $2,233,003 | $2,277,663 | $2,323,217 | $2,369,681 | $2,417,075 | $2,465,416 | $2,514,725 | |
| Cash from Receivables | $0 | $67,417 | $2,023,848 | $2,064,325 | $2,105,612 | $2,147,724 | $2,190,679 | $2,234,492 | $2,279,182 | $2,324,766 | $2,371,261 | $2,418,686 | |
| Subtotal Cash from Operations | $2,022,500 | $2,130,367 | $4,128,057 | $4,210,618 | $4,294,831 | $4,380,727 | $4,468,342 | $4,557,709 | $4,648,863 | $4,741,840 | $4,836,677 | $4,933,411 | |
| Additional Cash Received | |||||||||||||
| Sales Tax, VAT, HST/GST Received | 0.00% | $0 | $0 | $0 | $0 | $0 | $0 | $0 | $0 | $0 | $0 | $0 | $0 |
| New Current Borrowing | $0 | $2,600,000 | $0 | $0 | $0 | $0 | $0 | $0 | $0 | $0 | $0 | $0 | |
| New Other Liabilities (interest-free) | $0 | $0 | $0 | $0 | $0 | $0 | $0 | $0 | $0 | $0 | $0 | $0 | |
| New Long-term Liabilities | $0 | $0 | $0 | $0 | $0 | $0 | $0 | $0 | $0 | $0 | $0 | $0 | |
| Sales of Other Current Assets | $0 | $0 | $0 | $0 | $0 | $0 | $0 | $0 | $0 | $0 | $0 | $0 | |
| Sales of Long-term Assets | $0 | $0 | $0 | $0 | $0 | $0 | $0 | $0 | $0 | $0 | $0 | $0 | |
| New Investment Received | $0 | $0 | $0 | $0 | $0 | $0 | $0 | $0 | $0 | $0 | $0 | $0 | |
| Subtotal Cash Received | $2,022,500 | $4,730,367 | $4,128,057 | $4,210,618 | $4,294,831 | $4,380,727 | $4,468,342 | $4,557,709 | $4,648,863 | $4,741,840 | $4,836,677 | $4,933,411 | |
| Expenditures | Month 1 | Month 2 | Month 3 | Month 4 | Month 5 | Month 6 | Month 7 | Month 8 | Month 9 | Month 10 | Month 11 | Month 12 | |
| Expenditures from Operations | |||||||||||||
| Cash Spending | $430,000 | $430,000 | $430,000 | $430,000 | $430,000 | $430,000 | $430,000 | $430,000 | $430,000 | $430,000 | $430,000 | $430,000 | |
| Bill Payments | $238,092 | $6,732,629 | $3,541,363 | $3,613,666 | $3,687,418 | $3,762,648 | $3,839,385 | $3,917,660 | $3,997,503 | $4,078,945 | $4,162,019 | $4,246,757 | |
| Subtotal Spent on Operations | $668,092 | $7,162,629 | $3,971,363 | $4,043,666 | $4,117,418 | $4,192,648 | $4,269,385 | $4,347,660 | $4,427,503 | $4,508,945 | $4,592,019 | $4,676,757 | |
| Additional Cash Spent | |||||||||||||
| Sales Tax, VAT, HST/GST Paid Out | $0 | $0 | $0 | $0 | $0 | $0 | $0 | $0 | $0 | $0 | $0 | $0 | |
| Principal Repayment of Current Borrowing | $0 | $0 | $0 | $0 | $0 | $0 | $0 | $0 | $0 | $0 | $0 | $0 | |
| Other Liabilities Principal Repayment | $0 | $0 | $0 | $0 | $0 | $0 | $0 | $0 | $0 | $0 | $0 | $0 | |
| Long-term Liabilities Principal Repayment | $23,003 | $23,003 | $23,003 | $23,003 | $23,003 | $23,003 | $23,003 | $23,003 | $23,003 | $23,003 | $23,003 | $23,003 | |
| Purchase Other Current Assets | $0 | $0 | $0 | $0 | $0 | $0 | $0 | $0 | $0 | $0 | $0 | $0 | |
| Purchase Long-term Assets | $0 | $0 | $0 | $0 | $0 | $0 | $0 | $0 | $0 | $0 | $0 | $0 | |
| Dividends | $0 | $0 | $0 | $0 | $0 | $0 | $0 | $0 | $0 | $0 | $0 | $0 | |
| Subtotal Cash Spent | $691,095 | $7,185,632 | $3,994,366 | $4,066,669 | $4,140,421 | $4,215,651 | $4,292,388 | $4,370,663 | $4,450,506 | $4,531,948 | $4,615,022 | $4,699,760 | |
| Net Cash Flow | $1,331,405 | ($2,455,265) | $133,692 | $143,949 | $154,410 | $165,076 | $175,954 | $187,046 | $198,357 | $209,892 | $221,655 | $233,651 | |
| Cash Balance | $3,331,405 | $876,140 | $1,009,831 | $1,153,781 | $1,308,190 | $1,473,266 | $1,649,220 | $1,836,266 | $2,034,623 | $2,244,515 | $2,466,171 | $2,699,822 | |
| Pro Forma Balance Sheet | |||||||||||||
| Month 1 | Month 2 | Month 3 | Month 4 | Month 5 | Month 6 | Month 7 | Month 8 | Month 9 | Month 10 | Month 11 | Month 12 | ||
| Assets | Starting Balances | ||||||||||||
| Current Assets | |||||||||||||
| Cash | $2,000,000 | $3,331,405 | $876,140 | $1,009,831 | $1,153,781 | $1,308,190 | $1,473,266 | $1,649,220 | $1,836,266 | $2,034,623 | $2,244,515 | $2,466,171 | $2,699,822 |
| Accounts Receivable | $0 | $2,022,500 | $4,018,033 | $4,098,394 | $4,180,362 | $4,263,969 | $4,349,248 | $4,436,233 | $4,524,958 | $4,615,457 | $4,707,766 | $4,801,922 | $4,897,960 |
| Inventory | $100,000 | $3,559,600 | $3,630,792 | $3,703,408 | $3,777,476 | $3,853,026 | $3,930,086 | $4,008,688 | $4,088,862 | $4,170,639 | $4,254,052 | $4,339,133 | $4,425,915 |
| Other Current Assets | $100,000 | $100,000 | $100,000 | $100,000 | $100,000 | $100,000 | $100,000 | $100,000 | $100,000 | $100,000 | $100,000 | $100,000 | $100,000 |
| Total Current Assets | $2,200,000 | $9,013,505 | $8,624,965 | $8,911,633 | $9,211,618 | $9,525,185 | $9,852,601 | $10,194,141 | $10,550,085 | $10,920,719 | $11,306,333 | $11,707,225 | $12,123,697 |
| Long-term Assets | |||||||||||||
| Long-term Assets | $2,500,000 | $2,500,000 | $2,500,000 | $2,500,000 | $2,500,000 | $2,500,000 | $2,500,000 | $2,500,000 | $2,500,000 | $2,500,000 | $2,500,000 | $2,500,000 | $2,500,000 |
| Accumulated Depreciation | $0 | $25,000 | $50,000 | $75,000 | $100,000 | $125,000 | $150,000 | $175,000 | $200,000 | $225,000 | $250,000 | $275,000 | $300,000 |
| Total Long-term Assets | $2,500,000 | $2,475,000 | $2,450,000 | $2,425,000 | $2,400,000 | $2,375,000 | $2,350,000 | $2,325,000 | $2,300,000 | $2,275,000 | $2,250,000 | $2,225,000 | $2,200,000 |
| Total Assets | $4,700,000 | $11,488,505 | $11,074,965 | $11,336,633 | $11,611,618 | $11,900,185 | $12,202,601 | $12,519,141 | $12,850,085 | $13,195,719 | $13,556,333 | $13,932,225 | $14,323,697 |
| Liabilities and Capital | Month 1 | Month 2 | Month 3 | Month 4 | Month 5 | Month 6 | Month 7 | Month 8 | Month 9 | Month 10 | Month 11 | Month 12 | |
| Current Liabilities | |||||||||||||
| Accounts Payable | $10,000 | $6,614,664 | $3,420,989 | $3,490,836 | $3,562,082 | $3,634,756 | $3,708,885 | $3,784,500 | $3,861,630 | $3,940,305 | $4,020,556 | $4,102,415 | $4,185,913 |
| Current Borrowing | $0 | $0 | $2,600,000 | $2,600,000 | $2,600,000 | $2,600,000 | $2,600,000 | $2,600,000 | $2,600,000 | $2,600,000 | $2,600,000 | $2,600,000 | $2,600,000 |
| Other Current Liabilities | $0 | $0 | $0 | $0 | $0 | $0 | $0 | $0 | $0 | $0 | $0 | $0 | $0 |
| Subtotal Current Liabilities | $10,000 | $6,614,664 | $6,020,989 | $6,090,836 | $6,162,082 | $6,234,756 | $6,308,885 | $6,384,500 | $6,461,630 | $6,540,305 | $6,620,556 | $6,702,415 | $6,785,913 |
| Long-term Liabilities | $4,500,000 | $4,476,997 | $4,453,994 | $4,430,991 | $4,407,988 | $4,384,985 | $4,361,982 | $4,338,979 | $4,315,976 | $4,292,973 | $4,269,970 | $4,246,967 | $4,223,964 |
| Total Liabilities | $4,510,000 | $11,091,661 | $10,474,983 | $10,521,827 | $10,570,070 | $10,619,741 | $10,670,867 | $10,723,479 | $10,777,606 | $10,833,278 | $10,890,526 | $10,949,382 | $11,009,877 |
| Paid-in Capital | $508,000 | $508,000 | $508,000 | $508,000 | $508,000 | $508,000 | $508,000 | $508,000 | $508,000 | $508,000 | $508,000 | $508,000 | $508,000 |
| Retained Earnings | ($318,000) | ($318,000) | ($318,000) | ($318,000) | ($318,000) | ($318,000) | ($318,000) | ($318,000) | ($318,000) | ($318,000) | ($318,000) | ($318,000) | ($318,000) |
| Earnings | $0 | $206,844 | $409,982 | $624,806 | $851,548 | $1,090,444 | $1,341,733 | $1,605,662 | $1,882,479 | $2,172,441 | $2,475,807 | $2,792,843 | $3,123,819 |
| Total Capital | $190,000 | $396,844 | $599,982 | $814,806 | $1,041,548 | $1,280,444 | $1,531,733 | $1,795,662 | $2,072,479 | $2,362,441 | $2,665,807 | $2,982,843 | $3,313,819 |
| Total Liabilities and Capital | $4,700,000 | $11,488,505 | $11,074,965 | $11,336,633 | $11,611,618 | $11,900,185 | $12,202,601 | $12,519,141 | $12,850,085 | $13,195,719 | $13,556,333 | $13,932,225 | $14,323,697 |
| Net Worth | $190,000 | $396,844 | $599,982 | $814,806 | $1,041,548 | $1,280,444 | $1,531,733 | $1,795,662 | $2,072,479 | $2,362,441 | $2,665,807 | $2,982,843 | $3,313,819 |


