
Regali Luxuri
Executive Summary
Bensai Halstadt and Kaethe Villanova are the principals of Regali Luxuri. Regali Luxuri is a specialty gift boutique located in the enterprising warehouse district of west midtown in Treschicburg. We specialize in an assortment of high-quality merchandise ranging from customized business cards and greeting cards to personalized apparel and home accents. Regali Luxuri caters to middle-to-upper class and affluent clientele. Our company image exemplifies what customers are seeking in home accents and gifts which is a “Modern & Urban Life Style” look and feel. What differentiates our company from other specialty retail shops are the printing services we offer, our “one-of-a-kind” product line and a number of exclusive, proprietary products we designed ourselves.
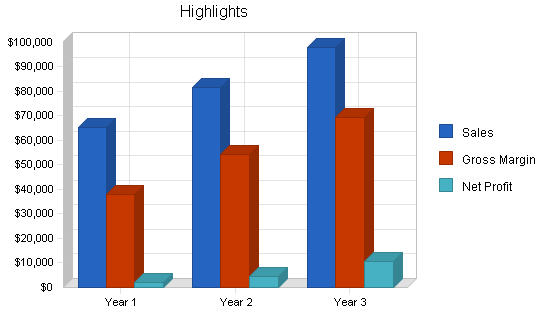
Before Regali Luxuri’s Grand Opening we will have established a company website. In year one, Regali Luxuri plans to break-even and in year two, we plan to generate a moderate profit. Some future growth plans for Regali Luxuri include: physically expanding the location to include the 2nd level of our live/work unit; broadening our unique product line; hiring individuals to design for our proprietary merchandise; developing and implementing e-commerce to our existing website in year three; and establishing a mail order catalog.
We incorporated our business as an “S” corporation. Over several years, we, Bensai and Kaethe, have invested our time, innumerable personal finances and research in developing and expanding our home-based business into a retail location. For the opening of the retail location, we each contributed an equity investment. Even though we are not well versed in the retail industry, Kaethe does have five years of retail and accounting experience and we have both have taken entrepreneurial and managerial classes through the local University SBDC (small business development center). Our experience and continuous education aid our efforts in training future employees and managing daily operations.
1.1 Objectives
- Generate total sales revenue to establish a profit at the end of year one.
- Implement e-commerce capabilities to existing company website in year three.
- Establish an annual growth rate of approximately 20% in year three.
- Maintain a direct cost of sales of 45% or less.
- Establish 50% of our merchandise as proprietary products in year two.
- Establish our company as a premier “Brand Recognized” name throughout the community in year one.
1.2 Mission
Regali Luxuri is a specialty cards, gifts and apparel boutique that specializes in “one-of-a-kind” merchandise not commonly found in the larger retail market. We are dedicated to providing customers exceptional customer service in a visibly relaxing and engaging shopping environment. Our mission is to provide customers with unique, high-quality merchandise at affordable prices.
1.3 Keys to Success
- Acquire and personally design a product line of “one-of-kind” handcrafted and unique products.
- Provide customized products and services that are “tailor-made” to each customer’s personal style.
- Establish a loyal customer following by offering seasonal promotions / discounts, distributing direct mail postcards, offering quality merchandise at affordable prices, and providing a visibly inviting and comfortable shopping environment.
- Establish a “Brand Identity” that personifies high-quality, gift giving merchandise and outstanding customer service.
Company Summary
Regali Luxuri is a privately owned specialty gift boutique located in the community of Treschicburg. The principal owners are Bensai Halstadt and Kaethe Villanova. Regali Luxuri specializes in a variety of unique merchandise ranging from specialty cards and personalized printing services to specialty handcrafted gifts and customized apparel.
What started out as a hobby for us soon evolved into a promising business venture. After meeting through a mutual friend we realized that we shared interests and a similar hobby. When Kaethe Villanova purchased a personal computer we began designing greeting cards, custom T-shirts and business cards for loved ones, free of charge. We used our own money to produce these products. Family and friends soon became very interested in actually purchasing these items. After a while we had built a clientele base that eventually branched out to several cities by word-of-mouth.
Over the years, we have invested our time and money to conduct the necessary primary market research by marketing new merchandise to the public which resulted in tremendous interest and responses.
Three years ago we relocated to Treschicburg where another clientele base was established. By testing our products, we realized that our target market consisted primarily of women; of ages ranging from 25 to 55; Business Entrepreneurs and Business Professionals. Next we started visualizing the possibility of having more than just a home-based business but perhaps a store front. That possibility didn’t culminate until Bensai Halstadt located and secured space in a newly developed Luxury Residential/Retail Community in west midtown in January of last year. Twelve of the residential lofts apartments are 2-level live/work space units where tenants who maintain home-based businesses could utilize the space as their store front. It was more than what they had imagined. Although both owners have diverse backgrounds, Bensai Halstadt, a design engineer, and Kaethe Villanova, a surgical technologist, both are very creative, crafty and ambitious.
Regali Luxuri is located at 1234 Greenfern Boulevard, in the warehouse district of west midtown in Treschicburg. The area is in its beginning stages of gentrification. The gift shop is located in a newly developed Residential/Retail Community named Wensleydale. There are approximately 12 live/work space units that are dedicated to tenants/entrepreneurs and two sizeable retail spaces available for more established businesses. The two-level unit that the owners occupy has a total square footage of 1,800 with the lower level store front space occupying 800 square feet. The owners are leasing the total space at $1,610 per month.
Of the 12 live/work store fronts, over half have been occupied and are fully operating. These businesses include: a convenience/beer and wine store; a dry cleaners; a hospice; a children’s story-book store; a music production company; and a spa. What is sure to increase visibility and business traffic to the area is the opening of an established upscale restaurant in early fall which will occupy one of the larger retail spaces.
Regali Luxuri is approximately 15 minutes from the Treschicburg Airport and is less than 10 minutes away from the intesection of the two Interstate Highways. Local street access is convenient. Ample parking is available to prospective customers along with other shopping conveniences. The shop is also within 5-10 miles of several universities.
2.1 Company Ownership
Regali Luxuri is owned and operated by Bensai Halstadt and Kaethe Villanova who are equally involved in the operation and management of the company. In August of last year, the business became incorporated and is structured as a privately owned “S” Corporation.
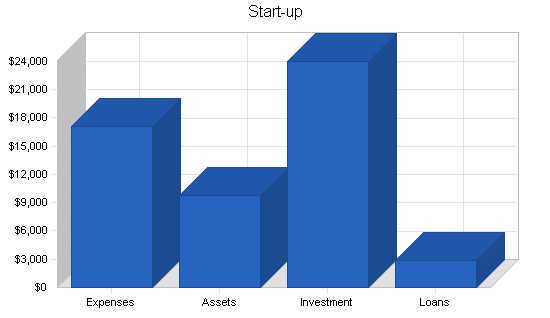
2.2 Start-up Summary
These figures are based on monthly and start-up expenses needed to open and functionally operate the gift store. The capital needed will come from both owner’s personal finances.
Purchase of an additional computer, POS system, additional high-quality printing equipment and software is allowed by the IRS as a Start-up Expense instead of as Long-term assets.
Long-term assets include a larger multi-function fabric press or use in customizing garments.
Additional start-up inventory of gift items for stocking display shelves in the store are included as assets to be purchased.
Brought to you by
Create a professional business plan
Using AI and step-by-step instructions
Create Your PlanSecure funding
Validate ideas
Build a strategy
Other Current Assets include the computer, supplies, and inventory the owners had accumulated while pursuing this business as a hobby.
| Start-up | |
| Requirements | |
| Start-up Expenses | |
| Rent | $1,600 |
| Advertising | $300 |
| Delivery Costs | $300 |
| Telephone Landline | $90 |
| Cellular Phone | $375 |
| Utilities and Internet | $375 |
| Insurance | $85 |
| Legal | $180 |
| Computer/Printing Equipment/Software | $4,000 |
| Decorating and Remodeling | $5,690 |
| Office Supplies | $400 |
| Professional Fees | $150 |
| Licenses and Permits | $200 |
| Security Deposits | $2,000 |
| Grand Opening Ads and Promos | $1,335 |
| Total Start-up Expenses | $17,080 |
| Start-up Assets | |
| Cash Required | $800 |
| Start-up Inventory | $4,000 |
| Other Current Assets | $3,000 |
| Long-term Assets | $2,000 |
| Total Assets | $9,800 |
| Total Requirements | $26,880 |
Products and Services
Ragali Luxuri offers an ecclectic ensemble of specialty cards, gifts, and home accents designed to fit the client’s personal style. Our specialty shop also incorporates customized printing services as well as exclusive proprietary products. We have assembled an array of local and national vendors along with skillful craftsmen and business entrepreneurs who will showcase a unique product line that will embody Regali Luxuri’s company image of a “Modern & Urban Lifestyle.”
PRODUCT DESCRIPTION
The following is an overview of our product line by category:
Printing Products: The printing products are just an extension of Regali Luxuri’s visually artistic and creative ideas that we offer clients to engage in. Price-points in this category range from $5 – $250+.
- Brochures
- Business cards
- 12-month calendars
- Special occasion cards: Greeting cards, wedding invitations, etc.
- Photo restoration/photo enlargements
- 2-year pocket planners
- Promotional materials
Customized Apparel: Our offering of personalizing a client’s favorite garment to reflect a special occasion or individual style will surely enhance their wardrobe. We use graphic imagery along with decorative studs and rhinestones to create a personal style. Price-points in this category range from $20 – $150.
- T-shirts
- Sweat shirts
- Denim apparel: Jackets, slacks, jump suits, and shirts
Home Accessories: Our product line of home accessories is a collection of modern accents that customers can certainly connect with. Price-points in this category range from $5 – $100.
- Bamboo garden vase collection
- Decorative and scented candles
- Framed artwork
- Shadow boxes
- Wine accessories
- Tabletop Accents: Coffee mugs, place mats, platters and coasters
Personal Care Accents: This category is very popular with customers when it comes to gift giving or personal use. Price-points in this category range from $6 – $15.
- Scented body lotion
- Scented bath salt
- Facial and body soaps
- Body gel
- Aromatherapy products
Pet Products: This trendy category will be very popular with potential customers and convenient for 80% of residential tenants in the complex who own a pet. Price-points in this category range from $5 – $25.
- Gourmet snacks
- Overnight traveling bags
- Bathing products
- Name tags
- Toys
Specialty Gifts: This gift giving merchandise line will allow customers to express their personal sentiments for special occasions and the gift recipient. Price-points in this category range from $10 – $250.
- Organza sheer gift bags
- Handcrafted jewelry
- Designer cigar handbags
- Baby products
- Handcrafted Afro-centric dolls
- Customized men’s and women’s gift sets
- Children’s interests books
- Housewarming gifts
SERVICE DESCRIPTION
To distinguish ourselves from surrounding specialty retailers, we provide numerous customized services that offer customers a satisfying and unique shopping experience.
Plastic Gift Cards: Gift cards are available to customers when purchasing for gift recipients may become a little difficult. We offer $25 gift cards.
Customization Services: To further enhance the customer’s shopping experience, we provide customers with the option of customizing almost any item of our product line. Whether it is printing products, specialty gifts, or home accessories customers can choose to have certain items customized to fit their individual decorating style or personal needs.
V.I.P. Customer Appreciation: In recognition of our “loyal” customers, we will provide them with V.I.P. cards. V.I.P. card holders will receive a special discount on all merchandise for a specified time period.
Graphic Design/Photography Services: These services are provided to complement the personalization of our printing services and products. Equipment available to support these services includes:
| Hardware | Software |
| 1 Dell Personal Computer | ArcSoft Photo Impression 2000 |
| 1 Dell Notebook | MGI Photo Suite 3 (Graphics) |
| 2 Scanners: HP & Microtek | Adobe Photo Deluxe 4 (Graphics) |
| 2 Printers: HP & Epson | Epson Kai’s Photo SE (Graphics) |
| 2 Kodak Digital Cameras | Microsoft Publisher XP |
Corporate Gift Program: Regali Luxuri would like to branch out and explore business-to-business ventures. We will offer a 15% discount to businesses that purchase for their employees.
ADVERTISING LITERATURE
This will be distributed to existing clients via direct mail and available to new customers as they browse through the boutique. Regali Luxuri will utilize our own printing capabilities to publish business cards, brochures and promotional postcards. Bensai Halstadt is a graphic design enthusiast who is proficient in desktop publishing and printing professional advertisements. This approach will definitely reduce our monthly advertising costs.
PRICING
Product pricing structures will be based on cost-plus and competitive pricing. Cost-plus pricing is basing the price on the basis of all costs plus a mark-up to cover overhead costs. Our mark-up cost is 33%. All orders will require a 50% deposit upon receiving final shipment. For bulk orders, a 50% deposit is required and a 15% discount will be given to customers. There will be seasonal and periodic sales on merchandise due to the possible overstock of inventory.
Design and Photography Service Fee Structures will be determined by the particular requirements of individual projects. Typically, compensation to Regali Luxuri includes a retainer design fee in addition to the cost plus system of billing for supplies and materials. This structure accounts for research, design time and consulting.
Future Plans
We seek to broaden Regali Luxuri’s product line by expanding the retail location to the 2nd level and show casing:
- Home Accessories: Mirrors, framed artwork, picture frames, glassware, dinnerware, flatware, throw pillows, throw blankets, and plush rugs.
- Gift Wrapping Services: This signature service will strengthen Regali Luxuri’s “brand identity” and company image.
- Men’s Gifts
Regali Luxuri also seeks to hire individuals to design exclusively for our proprietary products.
- Apparel: Crochet hats and scarves for toddlers to adults
- Baby Products: Crochet hats, booties, and throw blankets
- Soft Goods: Crochet throw pillows and throw blankets
- Printing Products: Greeting cards, calendars, obituaries
Plans of developing a mail order catalog will increase sales for Regali Luxuri.
Market Analysis Summary
Many skeptics wouldn’t think in these economic times that a small business would be capable of successfully launching their business. However, the following research findings will prove that small businesses in the gift industry have a distinct advantage. While the U.S. economy has been in a recession since 2000, consumers have continuously been focused on enhancing their homes with the purchase of home accent pieces. Total sales in the gift and decorative accessories industry for 2002 were $54.3 billion, resulting in just a drop of 1 % from $54.6 billion in 2001.
“When it comes to dealing with change, small firms are at a distinct advantage. Not having the large corporate hierarchy, they can be flexible, react quickly, and readily respond. When you make a change in a big company, it’s like turning an aircraft carrier. In a small company, you’re turning a jet ski.”
—Source: The Kenmarc Company, Common Sense Management, Thriving in a Recession 2002
“Although cost cutting is inevitable, marketing and product promotion are absolutely essential. The question is, How can you effectively promote your products on a smaller budget?”
“The answer is the Internet. It is an extremely powerful, yet cost-effective, communication tool that effectively utilized can stimulate significant sales growth, even in a recession.”
—Source: The Kenmarc Company, Common Sense Management, Thriving in a Recession 2002
Brought to you by
Create a professional business plan
Using AI and step-by-step instructions
Create Your PlanSecure funding
Validate ideas
Build a strategy
4.1 Market Segmentation
Regali Luxuri target markets will consist of the following groups:
BABY BOOM GENERATION (age 35-59) is married with children; college educated; homeowner; tend to stay in their home rather than multi-family properties; household income $50,000-$75,000; and seeks spacious living.
AFFLUENT (age 30-45) are married; college educated; household income $100,000+; growing at a much faster rate than the total number of U.S. households; and currently represents more women and minorities than ever before.
GENERATION X (age 24-37) well educated; married and raising children; buying our first homes; climbing up the corporate or entrepreneurial ladder.
GENERATION Y (age 10-24, born 1977-1995) is more ethnically diverse and is experiencing tremendous growth in spending power. “They will have careers and enough disposable income to afford luxuries for themselves and our homes.”
—Source: Home Accents report 2002, The Consumer Counts: Generation Y.
Market Segmentation Demographics
Regali Luxuri’s retail boutique is located in the community of Treschicburg. It encompasses a wide area of 28.7 square miles and experienced a population growth rate of 6.0% through 2005. The following demographic information will concentrate primarily within a five mile radius of our retail location.
The population (age 0-59) contained within a 5 mile radius of Regali Luxuri target market segments totals 214,675 in 2000.
Women are the primary consumers of Regali Luxuri products representing 60%. The growth rate of 6.0% is expencted to continue.
By market segments, Regali Luxuri’s customer base is represented by the following:
- 33% Baby Boomers
- 26% Affluent
- 24% Generation X
- 17% Generation Y
By race, Regali Luxuri’s market segments is represented by the following:
- 45% White
- 30% African American
- 10% Hispanic
- 5% Asian
- 10% Other
The total number of households from 2000 through 2005 was projected to increase at a 7.5% growth rate for our area.
—Source: CACI Marketing Systems for 2000 Information Systems, Ourstate University
Who is Regali Luxuri’s customer?
- Primarily Female
- Educated
- Homeowner
- Middle-to-upper class
- 25-59 years of age
- Favorites splurges are traveling and redecorating
- Enjoys spending time with family and friends
- Finds “word-of-mouth” and referrals from friends and colleagues extremely significant when making decisions
- Influenced by a brand and reputation of the product and its seller

| Market Analysis | |||||||
| Year 1 | Year 2 | Year 3 | Year 4 | Year 5 | |||
| Potential Customers | Growth | CAGR | |||||
| Baby Boomers | 3% | 70,842 | 73,180 | 75,595 | 78,090 | 80,667 | 3.30% |
| Affluent | 3% | 55,816 | 57,267 | 58,756 | 60,284 | 61,851 | 2.60% |
| Generation X | 2% | 51,522 | 52,759 | 54,025 | 55,322 | 56,650 | 2.40% |
| Generation Y | 2% | 36,495 | 37,115 | 37,746 | 38,388 | 39,041 | 1.70% |
| Total | 2.63% | 214,675 | 220,321 | 226,122 | 232,084 | 238,209 | 2.63% |
4.2 Service Business Analysis
The “Gift Industry” is primarily engaged in the retail sale of combined lines of gifts and novelty merchandise, souvenirs, greeting cards, holiday decorations, and miscellaneous small arts goods. These establishments are characterized by small, single unit specialty shops, each retailing a narrow line of full-priced, high-quality merchandise. The gift industry’s five product categories along with its total sales and market share are represented by the following:
| Product Category |
Total Sales (billions) |
Market Share |
|
1. Home Decorative Accents |
$16.89 |
31.0% |
| 2. Stationery & Paper Products |
$14.07 |
26.0% |
| 3. General Gifts |
$13.51 |
25.0% |
| 4. Collectibles |
$6.40 |
12.0% |
| 5. Seasonal Decorations |
$3.66 |
7.0% |
—Source: 2004 Market Share Reporter (Research Alert, Dec. 6, 2002, p.5 from Unity Marketing)
The market for gifts and decorations hit $54.6 billion in 2001, only a 1% drop of $55.2 billion for 2000. In the Home Decorative Accents segment, Candles commanded the largest sales of $2 billion, while Baby and Children gifts were the top sellers in the General Gifts category with $1.8 billion.
Snap Shots of the Industry
“While the traditional furniture industry is struggling with the new fashion focus in home, the gifts industry is benefiting greatly from this trend. In the past two years, consumers spent more money on home furnishings than on clothes.”
“With this new emphasis on home decorating, consumers are not just striving to make our homes more ‘beautiful,’ rather they are seeking decorative items that can positively impact the mood and emotional climate of our home.”
“Products which have a personal, emotional link to the consumer, such as collectibles or gifts based upon licensed properties or which appeal to multiple senses, including sight, sound, scent, are in demand as consumers seek to make our homes more comfortable and comforting.”
“The future of the gifts and home accents market is positive for the next several years. A significant consumer trend that will play out in the gifts and home decorative market, as well as many other consumer product categories, will be a reaction against our increasingly technology-driven culture.”
“As our lives become more ‘virtual’ and dependent upon computers and technology, consumers will seek out gifts and decorative accents which will help ground them in the ‘real’ world.”
—Source: Unity Marketing, The Gifts and Decorative Accents Report 2002: The Market, The Competitors, The Trends
4.2.1 Competition and Buying Patterns
Main Competitors
Specialty gift retailers have the ability to distinguish themselves merely by the types of products and/or services that they offer and Regali Luxuri is no exception. We have identified and conducted an in-depth analysis of three of our competitors located within a 5 mile radius. To aide in a more effective analysis, one of the owners visited all three retail stores to observe pricing structures, company image, traffic-flow, location and range of service. The analysis proved to be valuable to Regali Luxuri in identifying our competitive edge, areas of uniqueness, and marketing “niche.”
BELLA AZUL
Bella Azul is an ultra chic, cutting-edge, funky fashion and lifestyle boutique that recently opened its doors in February 2003. A large percentage of their merchandise is designer fashion followed by a distinctive but narrow line of home accessories, candles, bath/body accents and jewelry. They have a personal shopping staff available to repeat customers who are interested in this service. Their target market is primarily affluent women and prices range from $20 – $1600. While walking through the store, customers become captivated by the lofty space, eclectic ambiance and hand-painted floors. Since Bella Azul is located just blocks away from Regali Luxuri, they too are experiencing slow traffic-flow due to the developing residential/commercial area. The boutique occasionally hosts special events like Wine Tasting and Fashion Shows. Hours of operation are Tuesday through Friday 11 a.m. — 7 p.m., Saturday 10 a.m. — 6 p.m. and Sunday/Monday by appointment only. Their first-year estimated annual sales were approximately $200,000.
SWOOZIES
Swoozies is a more established gift shop located in the metro Treschicburg area with four retail locations. The shop closest to Regali Luxuri is located in a shopping center so there is a substantial amount of traffic-flow. The two owners of this establishment have at least 25 years of retail experience between them. They too target affluent women with an eclectic wide range of products and services. Products range from dinnerware, picture frames and journals to doll collections, pet products and custom printing. The store environment is very festive, engaging, bright and celebratory which have been effective in establishing the store’s name and image. The products are creatively displayed and showcased throughout the store to distinguish who the gifts are for, e.g. “a girl” section and “a boy” section. Swoozies is looking to expand nationally to the southeast cities like Raleigh, Huntsville, and Memphis. Their estimated annual sales for 2003 were $8 million. Hours of operation are Monday through Friday 10 a.m. — 7 p.m., Saturday 10 a.m. — 6 a.m. and Sunday 12 p.m. — 6 p.m.
BROOKSTONE, INC.
And lastly Brookstone, Inc., the most recognized company of the three local competitors is a nationwide specialty retailer whose strategy is to develop unique, proprietary branded products. Their merchandise is offered to customers through several distribution channels including 240 retail stores, catalogs and the Internet. Brookstone’s closest retail store is located in the very popular and frequented Rhomboid Square mall. Customers are encouraged to try out products for true, hands-on shopping. Their product range is vast in comparison to the other competitors. Their “brand identity” is well established and customers identify their products as personifying exceptional quality and high-value. There is of course a “corporate gifts program” available where personalized services like silk-screening, engraving, stitching or embossing are offered. Brookstone products range from $5 – $3,000 and estimated annual sales were over $325 million. Their target market is women who purchase for their husbands, fiances, boyfriends, etc.
Brought to you by
Create a professional business plan
Using AI and step-by-step instructions
Create Your PlanSecure funding
Validate ideas
Build a strategy
Strategy and Implementation Summary
Regali Luxuri will develop effective marketing & sales strategies by focusing on the following key areas:
- Prices
- Promotions
- Distribution channels
- Customer relations
- Products
These keys areas will reflect our existing and potential target market segments previously mentioned.
5.1 Competitive Edge
KEY COMPETITIVE STRENGTHS
- Customized Services — These “tailor-made” services offer the customer a personal connection to the product that he/she is purchasing. This type of service is not commonly offered in today’s retail marketplace.
- Printing Services — The added printing products service within the gift shop is unique for a gift shop. This will enable customers to bring in personal photographs and mementos or email digital images to create greeting cards, 12-month calendars or business cards. These types of items then become personal keep-sakes and one-of-a-kind type merchandise.
- Handmade/Handcrafted Products — The handcrafted products will be designed by owners Bensai and Kaethe as well as outside entrepreneurs. We will showcase their crafts on consignment. This will also broaden the our own product line.
- Brand Identity — The proprietary products that we design will be distinguished from other products by brand labels. Our brand name merchandise makes up 50% of our present product line. Promoting “brand recognized” merchandise connects the customers to products that represent high-quality and dedicated customer service.
KEY COMPETITIVE WEAKNESSES
- Range of Product Line — Although Regali Luxuri’s present product line is unique and high-end merchandise, the range of our products is considered small in relation to more established businesses. Yet these items are engaging and personable.
- Location of the Gift Shop — Because the area is in its developing stages of residential and commercial enterprise zones, business traffic is relatively slow. However with time, west midtown will undoubtedly generate a traffic-flow of curious residents and outside customers.
5.2 Marketing Strategy
PRICING STRATEGY
Although Regali Luxuri products are high-end and stylish, our pricing structure remains affordable and in-line with other specialty gift retailers. Our pricing structure is also based on the value the customers place on these products.
PROMOTION STRATEGY
Regali Luxuri will host several seasonal open houses offering special discounts. This promotional strategy will showcase new products and liquidate slow moving merchandise. The following illustrate the seasonal open houses:
- Spring: 15-20% discounts
- Fall: 15-20% discounts
- Summer: 15-20% discounts
- Annual Anniversary: 25% discounts
MARKETING CHANNELS
Existing customers as well as potential customers will be informed about new merchandise and savings utilizing the following marketing communications channels:
- Direct-Mail Postcards: Advertising postcards will be mailed to various local ZIP codes and to existing clientele located out of state.
- Word-of-Mouth: Networking through friends, family, and business associates is an inexpensive and effective marketing tool which Regali Luxuri utilizes to broaden our clientele base.
- Advertising Literature: Regali Luxuri will distribute our literature to various local community businesses and establishments such as restaurants, coffee shops, book stores, and universities.
5.3 Sales Strategy
CUSTOMERS
Establishing a rapport and connection with the customer directly effects a business’ sales. The following methods will establish such a connection:
- Training and Customer Needs: While training sales associates, we will emphasize the importance of the customer’s needs and inform associates to be helpful and personable.
- Suggestion/Comment Box: A suggestion/comment box will be available to customers near the boutique’s entrance. This provides Regali Luxuri with direct customer feedback concerning areas of improvement or enhancements.
PRODUCTS AND MERCHANDISING
Staying abreast of product and market trends is also essential to increased sales for a business. Regali Luxuri will utilize the following methods to increase our sales:
- Gift Industry Trade Shows: Frequenting local and national trade shows will provide Regali Luxuri with most up-to-date gifting products and the customer’s buying trends.
- Subscribing to Trade Publications: This resource will also ensure that Regali Luxuri product selections are current and satisfying the customer’s needs.
- Proprietary Products: Regali Luxuri will continue to develop creative and stylish products that will continue to strengthen our brand positioning and company image.
5.3.1 Sales Forecast
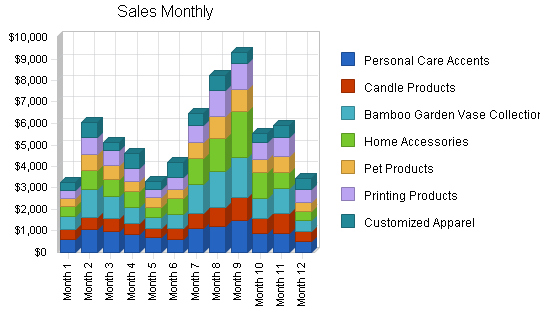
For this first year we have chosen to average our cost of goods across all product lines at 42%. As we track our real costs our forcasts for subsequent years’ COGS will be adjusted. Sales forecasts show the cyclical trends of seasonal/holiday spending and post-holiday frugality. Current forecasts show decling sales in the summer months, but as the neighborhood economic/residential develpment continues, there is the possibility of more visitors/vacationers/guests/residents shopping the area, and our sales would then improve.

| Sales Forecast | |||
| Year 1 | Year 2 | Year 3 | |
| Sales | |||
| Personal Care Accents | $10,875 | $13,594 | $16,313 |
| Candle Products | $7,800 | $9,750 | $11,700 |
| Bamboo Garden Vase Collection | $12,390 | $15,488 | $18,585 |
| Home Accessories | $11,190 | $13,988 | $16,785 |
| Pet Products | $7,770 | $9,713 | $11,655 |
| Printing Products | $8,960 | $11,200 | $13,440 |
| Customized Apparel | $6,370 | $7,963 | $9,555 |
| Total Sales | $65,355 | $81,694 | $98,033 |
| Direct Cost of Sales | Year 1 | Year 2 | Year 3 |
| Personal Care Accents | $4,567 | $4,567 | $4,795 |
| Candle Products | $3,278 | $3,278 | $3,442 |
| Bamboo Garden Vase Collection | $5,203 | $5,203 | $5,463 |
| Home Accessories | $4,700 | $4,700 | $4,935 |
| Pet Products | $3,264 | $3,264 | $3,427 |
| Printing Products | $3,763 | $3,763 | $3,951 |
| Customized Apparel | $2,674 | $2,674 | $2,808 |
| Subtotal Direct Cost of Sales | $27,449 | $27,449 | $28,821 |
5.4 Milestones
The following lists important milestones for Regali Luxuri along with dates and person(s) responsible for each task.

| Milestones | |||||
| Milestone | Start Date | End Date | Budget | Manager | Department |
| Store Location Confirmed | 1/1/2003 | 1/15/2003 | $0 | Bensai | Department |
| Lease Agreement Negotiated/Signed | 1/15/2003 | 3/1/2003 | $0 | Bensai/Kaethe | Department |
| Utilities, Internet Service Confirmed | 3/1/2003 | 3/6/2003 | $0 | Selma | Department |
| Vendor List Selection | 5/1/2003 | 2/1/2004 | $0 | Bensai/Kaethe | Department |
| Product Selection Confirmed | 5/1/2003 | 2/1/2004 | $0 | Bensai/Kaethe | Department |
| Business Acccount Opened | 7/1/2003 | 7/1/2003 | $0 | Bensai/Kaethe | Department |
| Licensing/Business Entity | 7/18/2003 | 8/18/2003 | $0 | Bensai/Kudana | Department |
| Business Plan Completed | 10/1/2003 | 2/20/2004 | $0 | Bensai/Shantu | Department |
| Grand Opening Advertisement | 12/1/2003 | 1/1/2004 | $0 | Bensai | Department |
| Business Cards & Stationery Printed | 1/1/2004 | 2/1/2004 | $0 | Kaethe | Department |
| Totals | $0 | ||||
Management Summary
Owners, Bensai Halstadt and Kaethe Villanova will initially manage the day-to-day operations of the boutique. Kaethe Villanova has five-years of retail and accounting experience that she has applied to the business. Both owners have also taken entrepreneurial classes through the local University SBDC (small business development center). our experience and continuous education has aided our efforts in training sales associates and managing daily operations.
Due to the area being in its beginning stages of gentrification resulting in slow business traffic, the owners have decided to initially open its doors Thursday-Saturday, 10a.m. – 7p.m. and Sunday, 10a.m. – 6p.m. They have also decided to take a minimal salary for the first year 2005, and increasing their salary each of the next two years, commenserate with their expanded operating hours. Both will continue to work to finance our business venture. Our work schedule allows us the flexibility to manage the store on the days previously mentioned. We will eventually expand our days of operation according to increased population of residential and retail establishments and increased business traffic.
The following is a structural breakdown of responsibility and decision-making:
| Bensai Halstadt | Kaethe Villanova | Bensai & Kaethe |
| Printing Services | Purchasing/Inventory Tracking | Sales/Marketing |
| Promotions/Advertising | Merchandising/Store Planning | Hiring/Employee Policies |
| Shipping/Delivery | Operations/Accounting | Customer Service |
| Web Maintenance | Training | Customization Services |
| Proprietary Product Development | ||
| General Product Selection |
In addition Regali Luxuri has a professional and advisory support team.
- Board of Directors – Bensai Halstadt & Kaethe Villanova
- Attorney – Greming Starke Roffman P.C.
- Accountant – Cleona Giraude
- Insurance Agent – State Farm Agency
- Banker – Riane Schmidt, Wachovia Bank
- Consultant(s) – Kudana Elderberry
- Mentors & Key Advisors – Kudana Ederberry and Shantu Mobuko
6.1 Personnel Plan
Owners Bensai and Kaethe have decided to take a minimal salary for the first year 2005, and increasing their salary each of the next two years, commenserate with their expanded operating hours. Both will continue to work to finance our business venture. If the extended hours and volume of business warrants we may hire part-time employees for the year two holiday season, or maybe not until year three.
| Personnel Plan | |||
| Year 1 | Year 2 | Year 3 | |
| Owners | $18,000 | $30,000 | $36,000 |
| Name or Title or Group | $0 | $0 | $0 |
| Name or Title or Group | $0 | $0 | $0 |
| Total People | 0 | 0 | 0 |
| Total Payroll | $18,000 | $30,000 | $36,000 |
Financial Plan
The following topics present the financials for Regali Luxuri.
7.1 Start-up Funding
Kaethe Villanova and Bensai Halstadt will each invest in Regali Luxuri. Additional start-up funding includes existing computer and printing equipment, some short-term debt in the form of credit card purchases, and a small amount of Accounts Payables owed to suppliers for inventory purchased while this operation was a hobby.
| Start-up Funding | |
| Start-up Expenses to Fund | $17,080 |
| Start-up Assets to Fund | $9,800 |
| Total Funding Required | $26,880 |
| Assets | |
| Non-cash Assets from Start-up | $9,000 |
| Cash Requirements from Start-up | $800 |
| Additional Cash Raised | $0 |
| Cash Balance on Starting Date | $800 |
| Total Assets | $9,800 |
| Liabilities and Capital | |
| Liabilities | |
| Current Borrowing | $2,160 |
| Long-term Liabilities | $0 |
| Accounts Payable (Outstanding Bills) | $720 |
| Other Current Liabilities (interest-free) | $0 |
| Total Liabilities | $2,880 |
| Capital | |
| Planned Investment | |
| Bensai Halstadt | $12,000 |
| Kaethe Villanova | $12,000 |
| Other | $0 |
| Additional Investment Requirement | $0 |
| Total Planned Investment | $24,000 |
| Loss at Start-up (Start-up Expenses) | ($17,080) |
| Total Capital | $6,920 |
| Total Capital and Liabilities | $9,800 |
| Total Funding | $26,880 |
7.2 Break-even Analysis
Current projections of average monthly expenses, and an admittedly high estimated cost of goods, Regali Luxuri will need to sell mechandise and services each month, as shown below, to break even.

| Break-even Analysis | |
| Monthly Revenue Break-even | $5,048 |
| Assumptions: | |
| Average Percent Variable Cost | 42% |
| Estimated Monthly Fixed Cost | $2,928 |
7.3 Projected Profit and Loss
The profit and loss figures show Regali Luxuri balances on the knife edge of profitability. The owners are aware that they may forego salaries in any given month to insure profitablity and positive cash balance.


| Pro Forma Profit and Loss | |||
| Year 1 | Year 2 | Year 3 | |
| Sales | $65,355 | $81,694 | $98,033 |
| Direct Cost of Sales | $27,449 | $27,449 | $28,821 |
| Other Costs of Goods | $0 | $0 | $0 |
| Total Cost of Sales | $27,449 | $27,449 | $28,821 |
| Gross Margin | $37,906 | $54,245 | $69,211 |
| Gross Margin % | 58.00% | 66.40% | 70.60% |
| Expenses | |||
| Payroll | $18,000 | $30,000 | $36,000 |
| Marketing/Promotion | $1,200 | $1,600 | $2,000 |
| Depreciation | $396 | $400 | $400 |
| Delivery & Shipping Cost | $1,200 | $1,200 | $1,200 |
| Legal Expenses | $720 | $720 | $720 |
| Payroll Taxes | $0 | $0 | $0 |
| Rent | $9,600 | $9,600 | $9,600 |
| Utilities & Internet | $1,500 | $1,500 | $1,500 |
| Business Insurance | $1,020 | $1,020 | $1,020 |
| Telephones-Landline/Cell | $1,500 | $1,500 | $1,500 |
| Total Operating Expenses | $35,136 | $47,540 | $53,940 |
| Profit Before Interest and Taxes | $2,770 | $6,705 | $15,271 |
| EBITDA | $3,166 | $7,105 | $15,671 |
| Interest Expense | $40 | $0 | $0 |
| Taxes Incurred | $819 | $2,011 | $4,581 |
| Net Profit | $1,911 | $4,693 | $10,690 |
| Net Profit/Sales | 2.92% | 5.75% | 10.90% |
7.4 Projected Cash Flow
The following includes Regali Luxuri Projected Cash Flow through 2007.

| Pro Forma Cash Flow | |||
| Year 1 | Year 2 | Year 3 | |
| Cash Received | |||
| Cash from Operations | |||
| Cash Sales | $65,355 | $81,694 | $98,033 |
| Subtotal Cash from Operations | $65,355 | $81,694 | $98,033 |
| Additional Cash Received | |||
| Sales Tax, VAT, HST/GST Received | $4,575 | $5,159 | $5,828 |
| New Current Borrowing | $0 | $0 | $0 |
| New Other Liabilities (interest-free) | $0 | $0 | $0 |
| New Long-term Liabilities | $0 | $0 | $0 |
| Sales of Other Current Assets | $0 | $0 | $0 |
| Sales of Long-term Assets | $0 | $0 | $0 |
| New Investment Received | $0 | $0 | $0 |
| Subtotal Cash Received | $69,930 | $86,853 | $103,861 |
| Expenditures | Year 1 | Year 2 | Year 3 |
| Expenditures from Operations | |||
| Cash Spending | $18,000 | $30,000 | $36,000 |
| Bill Payments | $42,017 | $44,813 | $50,691 |
| Subtotal Spent on Operations | $60,017 | $74,813 | $86,691 |
| Additional Cash Spent | |||
| Sales Tax, VAT, HST/GST Paid Out | $4,575 | $5,159 | $5,828 |
| Principal Repayment of Current Borrowing | $2,160 | $0 | $0 |
| Other Liabilities Principal Repayment | $0 | $0 | $0 |
| Long-term Liabilities Principal Repayment | $0 | $0 | $0 |
| Purchase Other Current Assets | $0 | $0 | $0 |
| Purchase Long-term Assets | $0 | $0 | $0 |
| Dividends | $0 | $0 | $0 |
| Subtotal Cash Spent | $66,752 | $79,972 | $92,519 |
| Net Cash Flow | $3,178 | $6,881 | $11,341 |
| Cash Balance | $3,978 | $10,859 | $22,201 |
7.5 Projected Balance Sheet
The balance sheet for Regali Luxuri is somewhat typical of a shoe-string start up company, relying upon the passion and dedication of this founding owners. The company displays steady growth, based on conservative forecasting. Earnings and Net Worth grow and show improvement each year of the plan.
| Pro Forma Balance Sheet | |||
| Year 1 | Year 2 | Year 3 | |
| Assets | |||
| Current Assets | |||
| Cash | $3,978 | $10,859 | $22,201 |
| Inventory | $2,291 | $2,291 | $2,406 |
| Other Current Assets | $3,000 | $3,000 | $3,000 |
| Total Current Assets | $9,270 | $16,150 | $27,607 |
| Long-term Assets | |||
| Long-term Assets | $2,000 | $2,000 | $2,000 |
| Accumulated Depreciation | $396 | $796 | $1,196 |
| Total Long-term Assets | $1,604 | $1,204 | $804 |
| Total Assets | $10,874 | $17,354 | $28,411 |
| Liabilities and Capital | Year 1 | Year 2 | Year 3 |
| Current Liabilities | |||
| Accounts Payable | $2,043 | $3,830 | $4,196 |
| Current Borrowing | $0 | $0 | $0 |
| Other Current Liabilities | $0 | $0 | $0 |
| Subtotal Current Liabilities | $2,043 | $3,830 | $4,196 |
| Long-term Liabilities | $0 | $0 | $0 |
| Total Liabilities | $2,043 | $3,830 | $4,196 |
| Paid-in Capital | $24,000 | $24,000 | $24,000 |
| Retained Earnings | ($17,080) | ($15,169) | ($10,476) |
| Earnings | $1,911 | $4,693 | $10,690 |
| Total Capital | $8,831 | $13,524 | $24,214 |
| Total Liabilities and Capital | $10,874 | $17,354 | $28,411 |
| Net Worth | $8,831 | $13,524 | $24,214 |
7.6 Business Ratios
The Standard Industrial Classification (SIC) Code for our industy is Gift Shops (5947.0104). We used the report for broader category Gift, Novelty, and Souvenir shop (5947) to generate the industry profile ratios shown in the following table.
| Ratio Analysis | ||||
| Year 1 | Year 2 | Year 3 | Industry Profile | |
| Sales Growth | 0.00% | 25.00% | 20.00% | 0.44% |
| Percent of Total Assets | ||||
| Inventory | 21.07% | 13.20% | 8.47% | 34.88% |
| Other Current Assets | 27.59% | 17.29% | 10.56% | 23.80% |
| Total Current Assets | 85.25% | 93.06% | 97.17% | 76.55% |
| Long-term Assets | 14.75% | 6.94% | 2.83% | 23.45% |
| Total Assets | 100.00% | 100.00% | 100.00% | 100.00% |
| Current Liabilities | 18.79% | 22.07% | 14.77% | 34.24% |
| Long-term Liabilities | 0.00% | 0.00% | 0.00% | 15.29% |
| Total Liabilities | 18.79% | 22.07% | 14.77% | 49.53% |
| Net Worth | 81.21% | 77.93% | 85.23% | 50.47% |
| Percent of Sales | ||||
| Sales | 100.00% | 100.00% | 100.00% | 100.00% |
| Gross Margin | 58.00% | 66.40% | 70.60% | 39.04% |
| Selling, General & Administrative Expenses | 134.30% | 118.94% | 105.29% | 24.17% |
| Advertising Expenses | 0.00% | 0.00% | 0.00% | 1.96% |
| Profit Before Interest and Taxes | 4.24% | 8.21% | 15.58% | 1.36% |
| Main Ratios | ||||
| Current | 4.54 | 4.22 | 6.58 | 1.99 |
| Quick | 3.42 | 3.62 | 6.01 | 0.81 |
| Total Debt to Total Assets | 18.79% | 22.07% | 14.77% | 51.50% |
| Pre-tax Return on Net Worth | 30.91% | 49.58% | 63.07% | 2.37% |
| Pre-tax Return on Assets | 25.11% | 38.63% | 53.75% | 4.90% |
| Additional Ratios | Year 1 | Year 2 | Year 3 | |
| Net Profit Margin | 2.92% | 5.75% | 10.90% | n.a |
| Return on Equity | 21.64% | 34.70% | 44.15% | n.a |
| Activity Ratios | ||||
| Inventory Turnover | 10.09 | 11.98 | 12.27 | n.a |
| Accounts Payable Turnover | 21.22 | 12.17 | 12.17 | n.a |
| Payment Days | 28 | 23 | 29 | n.a |
| Total Asset Turnover | 6.01 | 4.71 | 3.45 | n.a |
| Debt Ratios | ||||
| Debt to Net Worth | 0.23 | 0.28 | 0.17 | n.a |
| Current Liab. to Liab. | 1.00 | 1.00 | 1.00 | n.a |
| Liquidity Ratios | ||||
| Net Working Capital | $7,227 | $12,320 | $23,410 | n.a |
| Interest Coverage | 69.25 | 0.00 | 0.00 | n.a |
| Additional Ratios | ||||
| Assets to Sales | 0.17 | 0.21 | 0.29 | n.a |
| Current Debt/Total Assets | 19% | 22% | 15% | n.a |
| Acid Test | 3.42 | 3.62 | 6.01 | n.a |
| Sales/Net Worth | 7.40 | 6.04 | 4.05 | n.a |
| Dividend Payout | 0.00 | 0.00 | 0.00 | n.a |
Appendix
| Sales Forecast | |||||||||||||
| Month 1 | Month 2 | Month 3 | Month 4 | Month 5 | Month 6 | Month 7 | Month 8 | Month 9 | Month 10 | Month 11 | Month 12 | ||
| Sales | |||||||||||||
| Personal Care Accents | 0% | $600 | $1,050 | $975 | $825 | $675 | $600 | $1,125 | $1,200 | $1,500 | $900 | $900 | $525 |
| Candle Products | 0% | $450 | $600 | $600 | $525 | $450 | $525 | $675 | $900 | $1,050 | $675 | $900 | $450 |
| Bamboo Garden Vase Collection | 0% | $630 | $1,260 | $1,050 | $735 | $525 | $630 | $1,365 | $1,680 | $1,890 | $945 | $1,155 | $525 |
| Home Accessories | 0% | $450 | $900 | $750 | $750 | $450 | $750 | $1,200 | $1,500 | $2,100 | $1,200 | $750 | $390 |
| Pet Products | 0% | $375 | $750 | $675 | $450 | $450 | $420 | $750 | $1,050 | $1,050 | $600 | $750 | $450 |
| Printing Products | 0% | $400 | $800 | $700 | $600 | $400 | $560 | $800 | $1,200 | $1,200 | $800 | $900 | $600 |
| Customized Apparel | 0% | $350 | $700 | $350 | $700 | $350 | $700 | $560 | $700 | $490 | $420 | $560 | $490 |
| Total Sales | $3,255 | $6,060 | $5,100 | $4,585 | $3,300 | $4,185 | $6,475 | $8,230 | $9,280 | $5,540 | $5,915 | $3,430 | |
| Direct Cost of Sales | Month 1 | Month 2 | Month 3 | Month 4 | Month 5 | Month 6 | Month 7 | Month 8 | Month 9 | Month 10 | Month 11 | Month 12 | |
| Personal Care Accents | $252 | $441 | $409 | $346 | $283 | $252 | $473 | $504 | $630 | $378 | $378 | $221 | |
| Candle Products | $189 | $252 | $252 | $221 | $189 | $221 | $284 | $378 | $441 | $284 | $378 | $189 | |
| Bamboo Garden Vase Collection | $264 | $529 | $441 | $308 | $221 | $264 | $573 | $706 | $794 | $397 | $485 | $221 | |
| Home Accessories | $189 | $378 | $315 | $315 | $189 | $315 | $504 | $630 | $882 | $504 | $315 | $164 | |
| Pet Products | $158 | $315 | $284 | $189 | $189 | $176 | $315 | $441 | $441 | $252 | $315 | $189 | |
| Printing Products | $168 | $336 | $294 | $252 | $168 | $235 | $336 | $504 | $504 | $336 | $378 | $252 | |
| Customized Apparel | $147 | $294 | $147 | $294 | $147 | $294 | $235 | $294 | $206 | $176 | $235 | $205 | |
| Subtotal Direct Cost of Sales | $1,367 | $2,545 | $2,142 | $1,925 | $1,386 | $1,757 | $2,720 | $3,457 | $3,898 | $2,327 | $2,484 | $1,441 | |
| Personnel Plan | |||||||||||||
| Month 1 | Month 2 | Month 3 | Month 4 | Month 5 | Month 6 | Month 7 | Month 8 | Month 9 | Month 10 | Month 11 | Month 12 | ||
| Owners | 0% | $1,500 | $1,500 | $1,500 | $1,500 | $1,500 | $1,500 | $1,500 | $1,500 | $1,500 | $1,500 | $1,500 | $1,500 |
| Name or Title or Group | 0% | $0 | $0 | $0 | $0 | $0 | $0 | $0 | $0 | $0 | $0 | $0 | $0 |
| Name or Title or Group | 0% | $0 | $0 | $0 | $0 | $0 | $0 | $0 | $0 | $0 | $0 | $0 | $0 |
| Total People | 0 | 0 | 0 | 0 | 0 | 0 | 0 | 0 | 0 | 0 | 0 | 0 | |
| Total Payroll | $1,500 | $1,500 | $1,500 | $1,500 | $1,500 | $1,500 | $1,500 | $1,500 | $1,500 | $1,500 | $1,500 | $1,500 | |
| Pro Forma Profit and Loss | |||||||||||||
| Month 1 | Month 2 | Month 3 | Month 4 | Month 5 | Month 6 | Month 7 | Month 8 | Month 9 | Month 10 | Month 11 | Month 12 | ||
| Sales | $3,255 | $6,060 | $5,100 | $4,585 | $3,300 | $4,185 | $6,475 | $8,230 | $9,280 | $5,540 | $5,915 | $3,430 | |
| Direct Cost of Sales | $1,367 | $2,545 | $2,142 | $1,925 | $1,386 | $1,757 | $2,720 | $3,457 | $3,898 | $2,327 | $2,484 | $1,441 | |
| Other Costs of Goods | $0 | $0 | $0 | $0 | $0 | $0 | $0 | $0 | $0 | $0 | $0 | $0 | |
| Total Cost of Sales | $1,367 | $2,545 | $2,142 | $1,925 | $1,386 | $1,757 | $2,720 | $3,457 | $3,898 | $2,327 | $2,484 | $1,441 | |
| Gross Margin | $1,888 | $3,515 | $2,958 | $2,660 | $1,914 | $2,428 | $3,755 | $4,773 | $5,382 | $3,213 | $3,431 | $1,989 | |
| Gross Margin % | 58.00% | 58.00% | 58.00% | 58.02% | 58.00% | 58.02% | 57.99% | 58.00% | 58.00% | 58.00% | 58.01% | 57.99% | |
| Expenses | |||||||||||||
| Payroll | $1,500 | $1,500 | $1,500 | $1,500 | $1,500 | $1,500 | $1,500 | $1,500 | $1,500 | $1,500 | $1,500 | $1,500 | |
| Marketing/Promotion | $100 | $100 | $100 | $100 | $100 | $100 | $100 | $100 | $100 | $100 | $100 | $100 | |
| Depreciation | $33 | $33 | $33 | $33 | $33 | $33 | $33 | $33 | $33 | $33 | $33 | $33 | |
| Delivery & Shipping Cost | $100 | $100 | $100 | $100 | $100 | $100 | $100 | $100 | $100 | $100 | $100 | $100 | |
| Legal Expenses | $60 | $60 | $60 | $60 | $60 | $60 | $60 | $60 | $60 | $60 | $60 | $60 | |
| Payroll Taxes | 15% | $0 | $0 | $0 | $0 | $0 | $0 | $0 | $0 | $0 | $0 | $0 | $0 |
| Rent | $800 | $800 | $800 | $800 | $800 | $800 | $800 | $800 | $800 | $800 | $800 | $800 | |
| Utilities & Internet | $125 | $125 | $125 | $125 | $125 | $125 | $125 | $125 | $125 | $125 | $125 | $125 | |
| Business Insurance | 15% | $85 | $85 | $85 | $85 | $85 | $85 | $85 | $85 | $85 | $85 | $85 | $85 |
| Telephones-Landline/Cell | $125 | $125 | $125 | $125 | $125 | $125 | $125 | $125 | $125 | $125 | $125 | $125 | |
| Total Operating Expenses | $2,928 | $2,928 | $2,928 | $2,928 | $2,928 | $2,928 | $2,928 | $2,928 | $2,928 | $2,928 | $2,928 | $2,928 | |
| Profit Before Interest and Taxes | ($1,040) | $587 | $30 | ($268) | ($1,014) | ($500) | $827 | $1,845 | $2,454 | $285 | $503 | ($939) | |
| EBITDA | ($1,007) | $620 | $63 | ($235) | ($981) | ($467) | $860 | $1,878 | $2,487 | $318 | $536 | ($906) | |
| Interest Expense | $15 | $11 | $8 | $5 | $1 | $0 | $0 | $0 | $0 | $0 | $0 | $0 | |
| Taxes Incurred | ($316) | $173 | $7 | ($82) | ($305) | ($150) | $248 | $554 | $736 | $86 | $151 | ($282) | |
| Net Profit | ($738) | $403 | $15 | ($191) | ($711) | ($350) | $579 | $1,292 | $1,718 | $200 | $352 | ($657) | |
| Net Profit/Sales | -22.68% | 6.65% | 0.30% | -4.16% | -21.54% | -8.36% | 8.94% | 15.69% | 18.51% | 3.60% | 5.95% | -19.16% | |
| Pro Forma Cash Flow | |||||||||||||
| Month 1 | Month 2 | Month 3 | Month 4 | Month 5 | Month 6 | Month 7 | Month 8 | Month 9 | Month 10 | Month 11 | Month 12 | ||
| Cash Received | |||||||||||||
| Cash from Operations | |||||||||||||
| Cash Sales | $3,255 | $6,060 | $5,100 | $4,585 | $3,300 | $4,185 | $6,475 | $8,230 | $9,280 | $5,540 | $5,915 | $3,430 | |
| Subtotal Cash from Operations | $3,255 | $6,060 | $5,100 | $4,585 | $3,300 | $4,185 | $6,475 | $8,230 | $9,280 | $5,540 | $5,915 | $3,430 | |
| Additional Cash Received | |||||||||||||
| Sales Tax, VAT, HST/GST Received | 7.00% | $228 | $424 | $357 | $321 | $231 | $293 | $453 | $576 | $650 | $388 | $414 | $240 |
| New Current Borrowing | $0 | $0 | $0 | $0 | $0 | $0 | $0 | $0 | $0 | $0 | $0 | $0 | |
| New Other Liabilities (interest-free) | $0 | $0 | $0 | $0 | $0 | $0 | $0 | $0 | $0 | $0 | $0 | $0 | |
| New Long-term Liabilities | $0 | $0 | $0 | $0 | $0 | $0 | $0 | $0 | $0 | $0 | $0 | $0 | |
| Sales of Other Current Assets | $0 | $0 | $0 | $0 | $0 | $0 | $0 | $0 | $0 | $0 | $0 | $0 | |
| Sales of Long-term Assets | $0 | $0 | $0 | $0 | $0 | $0 | $0 | $0 | $0 | $0 | $0 | $0 | |
| New Investment Received | $0 | $0 | $0 | $0 | $0 | $0 | $0 | $0 | $0 | $0 | $0 | $0 | |
| Subtotal Cash Received | $3,483 | $6,484 | $5,457 | $4,906 | $3,531 | $4,478 | $6,928 | $8,806 | $9,930 | $5,928 | $6,329 | $3,670 | |
| Expenditures | Month 1 | Month 2 | Month 3 | Month 4 | Month 5 | Month 6 | Month 7 | Month 8 | Month 9 | Month 10 | Month 11 | Month 12 | |
| Expenditures from Operations | |||||||||||||
| Cash Spending | $1,500 | $1,500 | $1,500 | $1,500 | $1,500 | $1,500 | $1,500 | $1,500 | $1,500 | $1,500 | $1,500 | $1,500 | |
| Bill Payments | $756 | $1,200 | $4,251 | $3,105 | $2,974 | $2,129 | $3,277 | $5,449 | $6,226 | $6,380 | $2,525 | $3,745 | |
| Subtotal Spent on Operations | $2,256 | $2,700 | $5,751 | $4,605 | $4,474 | $3,629 | $4,777 | $6,949 | $7,726 | $7,880 | $4,025 | $5,245 | |
| Additional Cash Spent | |||||||||||||
| Sales Tax, VAT, HST/GST Paid Out | $228 | $424 | $357 | $321 | $231 | $293 | $453 | $576 | $650 | $388 | $414 | $240 | |
| Principal Repayment of Current Borrowing | $400 | $400 | $400 | $400 | $400 | $160 | $0 | $0 | $0 | $0 | $0 | $0 | |
| Other Liabilities Principal Repayment | $0 | $0 | $0 | $0 | $0 | $0 | $0 | $0 | $0 | $0 | $0 | $0 | |
| Long-term Liabilities Principal Repayment | $0 | $0 | $0 | $0 | $0 | $0 | $0 | $0 | $0 | $0 | $0 | $0 | |
| Purchase Other Current Assets | $0 | $0 | $0 | $0 | $0 | $0 | $0 | $0 | $0 | $0 | $0 | $0 | |
| Purchase Long-term Assets | $0 | $0 | $0 | $0 | $0 | $0 | $0 | $0 | $0 | $0 | $0 | $0 | |
| Dividends | $0 | $0 | $0 | $0 | $0 | $0 | $0 | $0 | $0 | $0 | $0 | $0 | |
| Subtotal Cash Spent | $2,884 | $3,524 | $6,508 | $5,326 | $5,105 | $4,082 | $5,230 | $7,525 | $8,376 | $8,268 | $4,439 | $5,485 | |
| Net Cash Flow | $599 | $2,960 | ($1,051) | ($420) | ($1,574) | $396 | $1,698 | $1,281 | $1,554 | ($2,340) | $1,890 | ($1,815) | |
| Cash Balance | $1,399 | $4,359 | $3,308 | $2,888 | $1,314 | $1,710 | $3,408 | $4,689 | $6,243 | $3,903 | $5,794 | $3,978 | |
| Pro Forma Balance Sheet | |||||||||||||
| Month 1 | Month 2 | Month 3 | Month 4 | Month 5 | Month 6 | Month 7 | Month 8 | Month 9 | Month 10 | Month 11 | Month 12 | ||
| Assets | Starting Balances | ||||||||||||
| Current Assets | |||||||||||||
| Cash | $800 | $1,399 | $4,359 | $3,308 | $2,888 | $1,314 | $1,710 | $3,408 | $4,689 | $6,243 | $3,903 | $5,794 | $3,978 |
| Inventory | $4,000 | $2,633 | $2,800 | $2,356 | $2,118 | $1,732 | $1,933 | $2,992 | $3,803 | $4,288 | $2,961 | $2,732 | $2,291 |
| Other Current Assets | $3,000 | $3,000 | $3,000 | $3,000 | $3,000 | $3,000 | $3,000 | $3,000 | $3,000 | $3,000 | $3,000 | $3,000 | $3,000 |
| Total Current Assets | $7,800 | $7,032 | $10,158 | $8,664 | $8,005 | $6,046 | $6,643 | $9,400 | $11,492 | $13,531 | $9,864 | $11,526 | $9,270 |
| Long-term Assets | |||||||||||||
| Long-term Assets | $2,000 | $2,000 | $2,000 | $2,000 | $2,000 | $2,000 | $2,000 | $2,000 | $2,000 | $2,000 | $2,000 | $2,000 | $2,000 |
| Accumulated Depreciation | $0 | $33 | $66 | $99 | $132 | $165 | $198 | $231 | $264 | $297 | $330 | $363 | $396 |
| Total Long-term Assets | $2,000 | $1,967 | $1,934 | $1,901 | $1,868 | $1,835 | $1,802 | $1,769 | $1,736 | $1,703 | $1,670 | $1,637 | $1,604 |
| Total Assets | $9,800 | $8,999 | $12,092 | $10,565 | $9,873 | $7,881 | $8,445 | $11,169 | $13,228 | $15,234 | $11,534 | $13,163 | $10,874 |
| Liabilities and Capital | Month 1 | Month 2 | Month 3 | Month 4 | Month 5 | Month 6 | Month 7 | Month 8 | Month 9 | Month 10 | Month 11 | Month 12 | |
| Current Liabilities | |||||||||||||
| Accounts Payable | $720 | $1,057 | $4,148 | $3,005 | $2,904 | $2,022 | $3,096 | $5,242 | $6,009 | $6,297 | $2,398 | $3,675 | $2,043 |
| Current Borrowing | $2,160 | $1,760 | $1,360 | $960 | $560 | $160 | $0 | $0 | $0 | $0 | $0 | $0 | $0 |
| Other Current Liabilities | $0 | $0 | $0 | $0 | $0 | $0 | $0 | $0 | $0 | $0 | $0 | $0 | $0 |
| Subtotal Current Liabilities | $2,880 | $2,817 | $5,508 | $3,965 | $3,464 | $2,182 | $3,096 | $5,242 | $6,009 | $6,297 | $2,398 | $3,675 | $2,043 |
| Long-term Liabilities | $0 | $0 | $0 | $0 | $0 | $0 | $0 | $0 | $0 | $0 | $0 | $0 | $0 |
| Total Liabilities | $2,880 | $2,817 | $5,508 | $3,965 | $3,464 | $2,182 | $3,096 | $5,242 | $6,009 | $6,297 | $2,398 | $3,675 | $2,043 |
| Paid-in Capital | $24,000 | $24,000 | $24,000 | $24,000 | $24,000 | $24,000 | $24,000 | $24,000 | $24,000 | $24,000 | $24,000 | $24,000 | $24,000 |
| Retained Earnings | ($17,080) | ($17,080) | ($17,080) | ($17,080) | ($17,080) | ($17,080) | ($17,080) | ($17,080) | ($17,080) | ($17,080) | ($17,080) | ($17,080) | ($17,080) |
| Earnings | $0 | ($738) | ($335) | ($320) | ($511) | ($1,222) | ($1,572) | ($993) | $299 | $2,017 | $2,216 | $2,568 | $1,911 |
| Total Capital | $6,920 | $6,182 | $6,585 | $6,600 | $6,409 | $5,699 | $5,349 | $5,927 | $7,219 | $8,937 | $9,136 | $9,488 | $8,831 |
| Total Liabilities and Capital | $9,800 | $8,999 | $12,092 | $10,565 | $9,873 | $7,881 | $8,445 | $11,169 | $13,228 | $15,234 | $11,534 | $13,163 | $10,874 |
| Net Worth | $6,920 | $6,182 | $6,585 | $6,600 | $6,409 | $5,699 | $5,349 | $5,927 | $7,219 | $8,937 | $9,136 | $9,488 | $8,831 |


