
EcoAquatics
Executive Summary
EcoAquatics is the hobbyist business of a high-school sophomore. Its main goal is to offer its owner a way to pursue an interesting hobby and turn that into a small part-time business to provide her with the economic benefits that other students her age get from less interesting part-time jobs.
EcoAquatics will manage saltwater aquariums for its clients. We will help every step of the way, from setting up the aquarium, to cleaning it, maintaining it, and feeding the fish. Depending on the client, they can go step by step along with us, or simply enjoy the finished product.
Our service can be used for a range of needs, from those who have never had an aquarium before and need step by step help, to someone who is an expert but does not have time to do everything. We will tell our clients the truth and not let them get something that will not thrive in their specific tank environment.
In the early stages of the business, the owner will focus on offering services to family and friends. Later, the company will expand to offer services to small businesses in the Eugene, Oregon area. Since this is a small hobbyist business, the start-up expenses are minimal. Start-up will be funded through an interest-free loan from a family friend. The loan will be repaid in year three.
As this business plan is written, EcoAquatics is properly registered with the state of Oregon and has been maintaining the aquarium of its first client for four months.
1.1 Mission
EcoAquatics is a hobbyist business intended to give its owner a way to develop environmentally-sound aquariums, sensitive to the potential ecological dangers of the aquarium hobby worldwide, on a small scale appropriate to a high school student’s infrastructure and reach. It should be fun, rewarding, full of learning, good for the clients, and good for the owner.
1.2 Keys to Success
-
- Maintain the vision of a part-time hobbyist business, moving only slowly and appropriately up.
- Always be up-to-date on the environmental impact of home and office aquariums.
1.3 Objectives
-
- For the short term, the main objective is to extend my aquarium hobby by building and maintaining a few aquariums outside my home with selected close-in clients who will work with me in a friendly way. I don’t want to pretend this a full-time business with completely normal business motivations.
- On the longer term, develop this into a business that can help me support myself through high school and college, generating a part-time income from a part-time endeavor that relates vocation to avocation.
Company Summary
EcoAquatics is starting very small, with the intention that it will be there later on, with a few key reference clients, when it is time to grow.
2.1 Start-up Summary
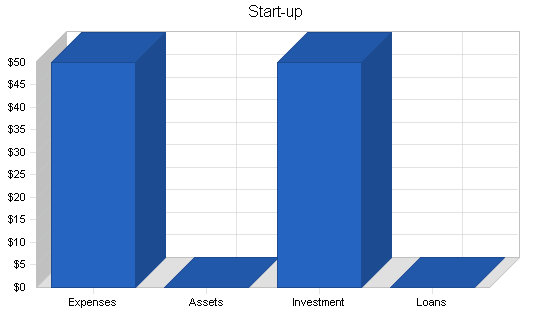
We have the advantage of a very simple start-up. There is no equipment needed, no rent, not even a phone line. Because we are purposely focusing on just a few clients who are friends and family, we don’t need sales literature. The cost is the registration with the State of Oregon.
| Start-up Funding | |
| Start-up Expenses to Fund | $50 |
| Start-up Assets to Fund | $0 |
| Total Funding Required | $50 |
| Assets | |
| Non-cash Assets from Start-up | $0 |
| Cash Requirements from Start-up | $0 |
| Additional Cash Raised | $0 |
| Cash Balance on Starting Date | $0 |
| Total Assets | $0 |
| Liabilities and Capital | |
| Liabilities | |
| Current Borrowing | $0 |
| Long-term Liabilities | $0 |
| Accounts Payable (Outstanding Bills) | $0 |
| Other Current Liabilities (interest-free) | $0 |
| Total Liabilities | $0 |
| Capital | |
| Planned Investment | |
| Self investment from savings | $50 |
| Other | $0 |
| Additional Investment Requirement | $0 |
| Total Planned Investment | $50 |
| Loss at Start-up (Start-up Expenses) | ($50) |
| Total Capital | $0 |
| Total Capital and Liabilities | $0 |
| Total Funding | $50 |
| Start-up | |
| Requirements | |
| Start-up Expenses | |
| Legal | $50 |
| Expensed Equipment | $0 |
| Other | $0 |
| Total Start-up Expenses | $50 |
| Start-up Assets | |
| Cash Required | $0 |
| Other Current Assets | $0 |
| Long-term Assets | $0 |
| Total Assets | $0 |
| Total Requirements | $50 |
2.2 Company Ownership
EcoAquatics is registered in the State of Oregon, Lane County, as a fictitious business name. The business is owned and operated entirely by Megan Berry, who turned 15 a couple months before it was founded.
Services
EcoAquatics will manage saltwater aquariums for its clients. We will help every step of the way, from setting up the aquarium, to cleaning it, maintaining it, and feeding the fish. Depending on the client, they can go step by step along with us, or simply enjoy the finished product.
We will help clients make choices that will not harm the environment in any way. We understand that sometimes this hobby can be damaging to the reefs we are trying to simulate. One of our main goals is to help our clients understand this, and choose reef friendly inhabitants.
The client must pay for equipment, supplies, and inhabitants, directly through the supplier, using their credit cards or accounts with local retailers. We are not going to buy and resell, just direct purchases.
We will focus on saltwater tanks only. Freshwater tanks are easier and require less maintenance. Saltwater takes advantage of what we know how to do. Furthermore, saltwater tanks are more likely to have features, colors, and visuals that enhance an office appearance.
We will customize the aquarium to match the client’s budget. We will help our clients decide whether they want a fish-only or a reef tank, while we have an emphasis on reef aquariums, we can do both. We will also make sure that all the inhabitants of the tank are compatible with each other, the size of the aquarium, and the equipment in it. We can offer advice on the best equipment and find the best deal. We will discuss what type of equipment and inhabitants are needed, or wanted, and do our best to match both the client’s budget and their expectations of the finished product.
We typically visit the client’s location four days a week during the start-up process, and once or twice a week afterwards. We will clean any filters or other equipment, feed fish, watch fish’s health carefully, care for corals, trim any macroalgea in the tank, check water quality, and clean glass on a regular basis.
During the start-up we will go out and get the equipment and creatures so the client need not do anything except set up the initial account with local retail, or supply the credit card for Internet orders. Our service can be used for a range of needs, from those who have never done this before and need step by step help to someone who is an expert, but does not have time to do everything. We will tell our clients the truth and not let them get something that will not thrive in their specific tank environment.
3.1 Market Analysis Summary
Although our immediate market is friends and family, the potential long-term market is businesses in Eugene. We’re looking eventually at two kinds of offices:
- Chamber of Commerce members.
- University of Oregon offices.
In addition, we’ve left some room for “others” such as school rooms, some private homes, and businesses not members of the Chamber of Commerce.
Brought to you by
Create a professional business plan
Using AI and step-by-step instructions
Create Your PlanSecure funding
Validate ideas
Build a strategy
3.1.1 Market Segmentation
Although our immediate market is friends and family, the potential long-term market is businesses in Eugene. We’re looking eventually at two kinds of offices:
- Chamber of Commerce members.
- University of Oregon offices.
In addition, we’ve left some room for “others” such as school rooms, some private homes, and businesses not members of the Chamber of Commerce.

| Market Analysis | |||||||
| Year 1 | Year 2 | Year 3 | Year 4 | Year 5 | |||
| Potential Customers | Growth | CAGR | |||||
| Chamber of Commerce members | 0% | 1,350 | 1,350 | 1,350 | 1,350 | 1,350 | 0.00% |
| University Offices | 0% | 400 | 400 | 400 | 400 | 400 | 0.00% |
| Other | 0% | 50 | 50 | 50 | 50 | 50 | 0.00% |
| Total | 0.00% | 1,800 | 1,800 | 1,800 | 1,800 | 1,800 | 0.00% |
3.1.2 Target Market Segment Strategy
We don’t have immediate capacity to serve more than one or two clients in the beginning. For the immediate future we focus entirely on word-of-mouth clients, accessible through friends and family. We move into the Chamber of Commerce as a marketing tool later, when we need more sales.
3.1.3 Service Business Analysis
Aquarium maintenance and design is by nature a smaller business full of small single competitors. In Eugene, two aquarium stores offer these services, but only one of them even bothers to advertise in the Yellow Pages of the main phone book.
3.1.3.1 Competition and Buying Patterns
Of course there is competition – there always is – but we don’t see competition as a limiting factor in this small hobbyist business, because we focus on friends and family first and we must maintain low capacity to be true to our underlying objectives.
Strategy and Implementation Summary
The key to my strategy is maintaining a clear hold on underlying objectives. I want this business to be a part-time business to provide pocket money and confidence that other kids in high school get by doing less interesting part-time jobs. I want the satisfaction of earning my own money, but like the aquarium business and want to focus it on what I like.
Therefore I have limited capacity and will build slowly and carefully, with one friends-and-family client to begin with, moving very careful to three clients only later when I have driving privileges.
4.1 Competitive Edge
- In this business, being young, and a good student, is a competitive edge. When I need to generate new clients, people will relate positively to a young person working her own business.
- Knowledge is very important. I take the time to know what I’m talking about, particularly regarding the environmental-impact of the aquarium hobby.
- The environmental emphasis is unusual, and is also a competitive advantage. Many people will prefer to work with an environmentally sensitive aquarium vendor.
4.2 Marketing Strategy
- Start first with friends and family companies where I can establish a track record and reference site.
- Move slowly, through word of mouth, into a carefully selected few additional sites that I can serve at a very high quality level.
- Lever on the Chamber of Commerce, and my competitive edge, to market through personal talks and Chamber events.
4.3 Sales Strategy
Our selling will be entirely based on word of mouth. We will build the website for the future. Later on, as soon as we feel confident to turn on more business, joining the Chamber of Commerce would be sufficient. We could attend some of their gatherings, get an occasional forum, and build more business that way.
4.3.1 Sales Forecast
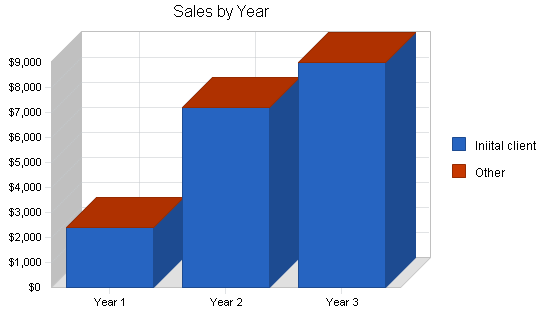
We will remain with a single client throughout this first year before expanding in the future. We need to establish history with one client, and we also need to maintain the constraints on this business as a single hobbyist business.
During the following year, when we have a drivers license, we can expand to three clients.
| Sales Forecast | |||
| Year 1 | Year 2 | Year 3 | |
| Sales | |||
| Iniital client | $2,400 | $7,200 | $9,000 |
| Other | $0 | $0 | $0 |
| Total Sales | $2,400 | $7,200 | $9,000 |
| Direct Cost of Sales | Year 1 | Year 2 | Year 3 |
| Unbilled minor accessories, testing supplies, etc. | $48 | $144 | $180 |
| Other | $0 | $0 | $0 |
| Subtotal Direct Cost of Sales | $48 | $144 | $180 |
4.4 Milestones
The plan involves two additional clients for the summer of 2003, and then a transition during late 2004 in preparation for me to be able to leave clients to attend college.
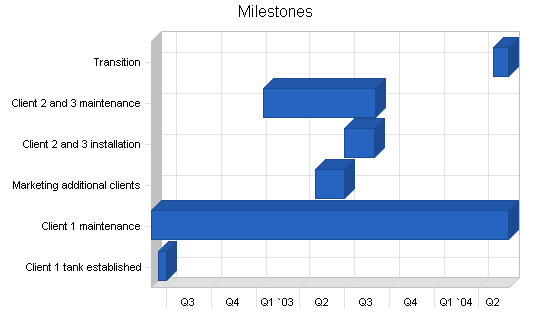
| Milestones | |||||
| Milestone | Start Date | End Date | Budget | Manager | Department |
| Client 1 tank established | 6/15/2002 | 6/30/2002 | $0 | Megan | Overall |
| Client 1 maintenance | 6/1/2002 | 5/31/2004 | $0 | Megan | Overall |
| Marketing additional clients | 5/1/2003 | 6/30/2003 | $0 | Megan | Overall |
| Client 2 and 3 installation | 7/1/2003 | 8/31/2003 | $0 | Megan | Overall |
| Client 2 and 3 maintenance | 9/1/2003 | 1/15/2003 | $0 | Megan | Overall |
| Transition | 5/1/2004 | 5/31/2004 | $0 | Megan | Overall |
| Totals | $0 | ||||
Web Plan Summary
EcoAquatics will address a long-term interest in environmentally sound aquarium hobbies.
5.1 Website Marketing Strategy
Low-key marketing will focus mainly on informational value of the EcoAquatics site, for placement at Yahoo! and search results in Google, etc.
5.2 Development Requirements
EcoAquatics will be a personal project, much like my present and former site at citruscoolkids.com, using Cold Fusion and Flash.
Management Summary
This is a one-person hobbyist business. I plan to pay myself 90% of the billings as salary.
6.1 Personnel Plan
The personnel plan is to pay myself 90% of the billings of the services. This leaves some room for purchase of books, testing supplies, etc.
| Personnel Plan | |||
| Year 1 | Year 2 | Year 3 | |
| Owner | $1,800 | $5,400 | $6,750 |
| Other | $0 | $0 | $0 |
| Total People | 0 | 0 | 0 |
| Total Payroll | $1,800 | $5,400 | $6,750 |
Financial Plan
The main financial problem is working capital for the first few months before business clients pay, and I support that by not paying myself. I don’t foresee the kind of client relationships that will cause long-term problems getting paid, but I also have to be able to support their occasional delays because this won’t be important to them.
7.1 Important Assumptions
The following table outlines the general assumptions for EcoAquatics.
| General Assumptions | |||
| Year 1 | Year 2 | Year 3 | |
| Plan Month | 1 | 2 | 3 |
| Current Interest Rate | 10.00% | 10.00% | 10.00% |
| Long-term Interest Rate | 10.00% | 10.00% | 10.00% |
| Tax Rate | 30.00% | 30.00% | 30.00% |
| Other | 0 | 0 | 0 |
7.2 Break-even Analysis
The break-even is based on a very realistic assessment of the present hobbyist nature of this business.

| Break-even Analysis | |
| Monthly Revenue Break-even | $201 |
| Assumptions: | |
| Average Percent Variable Cost | 2% |
| Estimated Monthly Fixed Cost | $197 |
7.3 Projected Profit and Loss
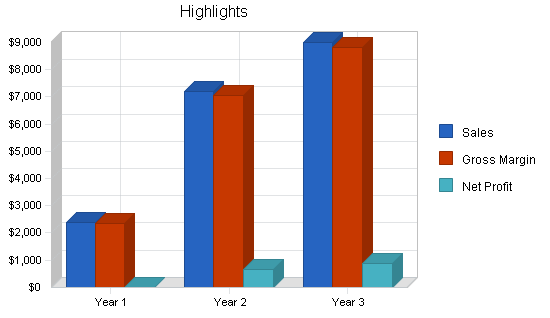
As the Profit and Loss table shows, we have a small hobbyist business here with very few expenses. The website hosting is an estimate, because it may actually be free.


| Pro Forma Profit and Loss | |||
| Year 1 | Year 2 | Year 3 | |
| Sales | $2,400 | $7,200 | $9,000 |
| Direct Cost of Sales | $48 | $144 | $180 |
| Other Costs of Sales | $0 | $0 | $0 |
| Total Cost of Sales | $48 | $144 | $180 |
| Gross Margin | $2,352 | $7,056 | $8,820 |
| Gross Margin % | 98.00% | 98.00% | 98.00% |
| Expenses | |||
| Payroll | $1,800 | $5,400 | $6,750 |
| Sales and Marketing and Other Expenses | $200 | $300 | $300 |
| Depreciation | $0 | $0 | $0 |
| Website hosting | $360 | $400 | $500 |
| Utilities | $0 | $0 | $0 |
| Insurance | $0 | $0 | $0 |
| Payroll Taxes | $0 | $0 | $0 |
| Other | $0 | $0 | $0 |
| Total Operating Expenses | $2,360 | $6,100 | $7,550 |
| Profit Before Interest and Taxes | ($8) | $956 | $1,270 |
| EBITDA | ($8) | $956 | $1,270 |
| Interest Expense | $0 | $0 | $0 |
| Taxes Incurred | $0 | $287 | $381 |
| Net Profit | ($8) | $669 | $889 |
| Net Profit/Sales | -0.33% | 9.29% | 9.88% |
7.4 Projected Cash Flow
The cash flow involves a loan from founders, which is essentially equivalent to not paying myself for the first two months plus a smaller loan from parents, to support the working capital requirements. Otherwise I would show a negative balance.

| Pro Forma Cash Flow | |||
| Year 1 | Year 2 | Year 3 | |
| Cash Received | |||
| Cash from Operations | |||
| Cash Sales | $0 | $0 | $0 |
| Cash from Receivables | $2,007 | $6,413 | $8,705 |
| Subtotal Cash from Operations | $2,007 | $6,413 | $8,705 |
| Additional Cash Received | |||
| Sales Tax, VAT, HST/GST Received | $0 | $0 | $0 |
| New Current Borrowing | $0 | $0 | $0 |
| New Other Liabilities (interest-free) | $500 | $0 | $0 |
| New Long-term Liabilities | $0 | $0 | $0 |
| Sales of Other Current Assets | $0 | $0 | $0 |
| Sales of Long-term Assets | $0 | $0 | $0 |
| New Investment Received | $0 | $0 | $0 |
| Subtotal Cash Received | $2,507 | $6,413 | $8,705 |
| Expenditures | Year 1 | Year 2 | Year 3 |
| Expenditures from Operations | |||
| Cash Spending | $1,800 | $5,400 | $6,750 |
| Bill Payments | $478 | $1,167 | $1,342 |
| Subtotal Spent on Operations | $2,278 | $6,567 | $8,092 |
| Additional Cash Spent | |||
| Sales Tax, VAT, HST/GST Paid Out | $0 | $0 | $0 |
| Principal Repayment of Current Borrowing | $0 | $0 | $0 |
| Other Liabilities Principal Repayment | $0 | $0 | $500 |
| Long-term Liabilities Principal Repayment | $0 | $0 | $0 |
| Purchase Other Current Assets | $0 | $0 | $0 |
| Purchase Long-term Assets | $0 | $0 | $0 |
| Dividends | $0 | $0 | $0 |
| Subtotal Cash Spent | $2,278 | $6,567 | $8,592 |
| Net Cash Flow | $228 | ($154) | $113 |
| Cash Balance | $228 | $74 | $187 |
Brought to you by
Create a professional business plan
Using AI and step-by-step instructions
Create Your PlanSecure funding
Validate ideas
Build a strategy
7.5 Projected Balance Sheet
The balance sheet seems acceptable for a low-key hobbyist business. The loans carried are mainly the first two months of sacrificed compensation to myself.
| Pro Forma Balance Sheet | |||
| Year 1 | Year 2 | Year 3 | |
| Assets | |||
| Current Assets | |||
| Cash | $228 | $74 | $187 |
| Accounts Receivable | $393 | $1,180 | $1,475 |
| Other Current Assets | $0 | $0 | $0 |
| Total Current Assets | $622 | $1,254 | $1,662 |
| Long-term Assets | |||
| Long-term Assets | $0 | $0 | $0 |
| Accumulated Depreciation | $0 | $0 | $0 |
| Total Long-term Assets | $0 | $0 | $0 |
| Total Assets | $622 | $1,254 | $1,662 |
| Liabilities and Capital | Year 1 | Year 2 | Year 3 |
| Current Liabilities | |||
| Accounts Payable | $130 | $93 | $112 |
| Current Borrowing | $0 | $0 | $0 |
| Other Current Liabilities | $500 | $500 | $0 |
| Subtotal Current Liabilities | $630 | $593 | $112 |
| Long-term Liabilities | $0 | $0 | $0 |
| Total Liabilities | $630 | $593 | $112 |
| Paid-in Capital | $50 | $50 | $50 |
| Retained Earnings | ($50) | ($58) | $611 |
| Earnings | ($8) | $669 | $889 |
| Total Capital | ($8) | $661 | $1,550 |
| Total Liabilities and Capital | $622 | $1,254 | $1,662 |
| Net Worth | ($8) | $661 | $1,550 |
7.6 Business Ratios
My guess is that what I am doing is not going to be equivalent to the kinds of real businesses whose numbers were contained in the financial databases shown in the rightmost column here. Furthermore, I am not intending to seek bank loan or investment.
| Ratio Analysis | ||||
| Year 1 | Year 2 | Year 3 | Industry Profile | |
| Sales Growth | 0.00% | 200.00% | 25.00% | 8.79% |
| Percent of Total Assets | ||||
| Accounts Receivable | 63.28% | 94.09% | 88.75% | 28.12% |
| Other Current Assets | 0.00% | 0.00% | 0.00% | 44.18% |
| Total Current Assets | 100.00% | 100.00% | 100.00% | 76.27% |
| Long-term Assets | 0.00% | 0.00% | 0.00% | 23.73% |
| Total Assets | 100.00% | 100.00% | 100.00% | 100.00% |
| Current Liabilities | 101.29% | 47.28% | 6.73% | 38.61% |
| Long-term Liabilities | 0.00% | 0.00% | 0.00% | 13.60% |
| Total Liabilities | 101.29% | 47.28% | 6.73% | 52.21% |
| Net Worth | -1.29% | 52.72% | 93.27% | 47.79% |
| Percent of Sales | ||||
| Sales | 100.00% | 100.00% | 100.00% | 100.00% |
| Gross Margin | 98.00% | 98.00% | 98.00% | 100.00% |
| Selling, General & Administrative Expenses | 98.33% | 88.71% | 88.12% | 82.68% |
| Advertising Expenses | 0.00% | 0.00% | 0.00% | 1.66% |
| Profit Before Interest and Taxes | -0.33% | 13.28% | 14.11% | 1.37% |
| Main Ratios | ||||
| Current | 0.99 | 2.12 | 14.86 | 1.59 |
| Quick | 0.99 | 2.12 | 14.86 | 1.22 |
| Total Debt to Total Assets | 101.29% | 47.28% | 6.73% | 60.22% |
| Pre-tax Return on Net Worth | 100.00% | 144.59% | 81.92% | 3.09% |
| Pre-tax Return on Assets | -1.29% | 76.23% | 76.41% | 7.76% |
| Additional Ratios | Year 1 | Year 2 | Year 3 | |
| Net Profit Margin | -0.33% | 9.29% | 9.88% | n.a |
| Return on Equity | 0.00% | 101.21% | 57.35% | n.a |
| Activity Ratios | ||||
| Accounts Receivable Turnover | 6.10 | 6.10 | 6.10 | n.a |
| Collection Days | 57 | 40 | 54 | n.a |
| Accounts Payable Turnover | 4.69 | 12.17 | 12.17 | n.a |
| Payment Days | 27 | 36 | 27 | n.a |
| Total Asset Turnover | 3.86 | 5.74 | 5.41 | n.a |
| Debt Ratios | ||||
| Debt to Net Worth | 0.00 | 0.90 | 0.07 | n.a |
| Current Liab. to Liab. | 1.00 | 1.00 | 1.00 | n.a |
| Liquidity Ratios | ||||
| Net Working Capital | ($8) | $661 | $1,550 | n.a |
| Interest Coverage | 0.00 | 0.00 | 0.00 | n.a |
| Additional Ratios | ||||
| Assets to Sales | 0.26 | 0.17 | 0.18 | n.a |
| Current Debt/Total Assets | 101% | 47% | 7% | n.a |
| Acid Test | 0.36 | 0.13 | 1.67 | n.a |
| Sales/Net Worth | 0.00 | 10.89 | 5.81 | n.a |
| Dividend Payout | 0.00 | 0.00 | 0.00 | n.a |
Appendix
| Sales Forecast | |||||||||||||
| Month 1 | Month 2 | Month 3 | Month 4 | Month 5 | Month 6 | Month 7 | Month 8 | Month 9 | Month 10 | Month 11 | Month 12 | ||
| Sales | |||||||||||||
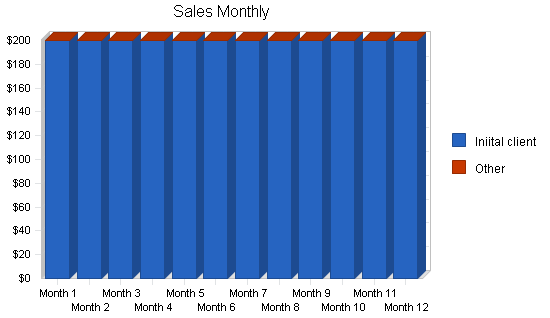
| Iniital client | 0% | $200 | $200 | $200 | $200 | $200 | $200 | $200 | $200 | $200 | $200 | $200 | $200 |
| Other | 0% | $0 | $0 | $0 | $0 | $0 | $0 | $0 | $0 | $0 | $0 | $0 | $0 |
| Total Sales | $200 | $200 | $200 | $200 | $200 | $200 | $200 | $200 | $200 | $200 | $200 | $200 | |
| Direct Cost of Sales | Month 1 | Month 2 | Month 3 | Month 4 | Month 5 | Month 6 | Month 7 | Month 8 | Month 9 | Month 10 | Month 11 | Month 12 | |
| Unbilled minor accessories, testing supplies, etc. | $4 | $4 | $4 | $4 | $4 | $4 | $4 | $4 | $4 | $4 | $4 | $4 | |
| Other | $0 | $0 | $0 | $0 | $0 | $0 | $0 | $0 | $0 | $0 | $0 | $0 | |
| Subtotal Direct Cost of Sales | $4 | $4 | $4 | $4 | $4 | $4 | $4 | $4 | $4 | $4 | $4 | $4 | |
| Personnel Plan | |||||||||||||
| Month 1 | Month 2 | Month 3 | Month 4 | Month 5 | Month 6 | Month 7 | Month 8 | Month 9 | Month 10 | Month 11 | Month 12 | ||
| Owner | 75% | $150 | $150 | $150 | $150 | $150 | $150 | $150 | $150 | $150 | $150 | $150 | $150 |
| Other | 0% | $0 | $0 | $0 | $0 | $0 | $0 | $0 | $0 | $0 | $0 | $0 | $0 |
| Total People | 0 | 0 | 0 | 0 | 0 | 0 | 0 | 0 | 0 | 0 | 0 | 0 | |
| Total Payroll | $150 | $150 | $150 | $150 | $150 | $150 | $150 | $150 | $150 | $150 | $150 | $150 | |
| General Assumptions | |||||||||||||
| Month 1 | Month 2 | Month 3 | Month 4 | Month 5 | Month 6 | Month 7 | Month 8 | Month 9 | Month 10 | Month 11 | Month 12 | ||
| Plan Month | 1 | 2 | 3 | 4 | 5 | 6 | 7 | 8 | 9 | 10 | 11 | 12 | |
| Current Interest Rate | 10.00% | 10.00% | 10.00% | 10.00% | 10.00% | 10.00% | 10.00% | 10.00% | 10.00% | 10.00% | 10.00% | 10.00% | |
| Long-term Interest Rate | 10.00% | 10.00% | 10.00% | 10.00% | 10.00% | 10.00% | 10.00% | 10.00% | 10.00% | 10.00% | 10.00% | 10.00% | |
| Tax Rate | 30.00% | 30.00% | 30.00% | 30.00% | 30.00% | 30.00% | 30.00% | 30.00% | 30.00% | 30.00% | 30.00% | 30.00% | |
| Other | 0 | 0 | 0 | 0 | 0 | 0 | 0 | 0 | 0 | 0 | 0 | 0 | |
| Pro Forma Profit and Loss | |||||||||||||
| Month 1 | Month 2 | Month 3 | Month 4 | Month 5 | Month 6 | Month 7 | Month 8 | Month 9 | Month 10 | Month 11 | Month 12 | ||
| Sales | $200 | $200 | $200 | $200 | $200 | $200 | $200 | $200 | $200 | $200 | $200 | $200 | |
| Direct Cost of Sales | $4 | $4 | $4 | $4 | $4 | $4 | $4 | $4 | $4 | $4 | $4 | $4 | |
| Other Costs of Sales | $0 | $0 | $0 | $0 | $0 | $0 | $0 | $0 | $0 | $0 | $0 | $0 | |
| Total Cost of Sales | $4 | $4 | $4 | $4 | $4 | $4 | $4 | $4 | $4 | $4 | $4 | $4 | |
| Gross Margin | $196 | $196 | $196 | $196 | $196 | $196 | $196 | $196 | $196 | $196 | $196 | $196 | |
| Gross Margin % | 98.00% | 98.00% | 98.00% | 98.00% | 98.00% | 98.00% | 98.00% | 98.00% | 98.00% | 98.00% | 98.00% | 98.00% | |
| Expenses | |||||||||||||
| Payroll | $150 | $150 | $150 | $150 | $150 | $150 | $150 | $150 | $150 | $150 | $150 | $150 | |
| Sales and Marketing and Other Expenses | $0 | $0 | $0 | $0 | $0 | $0 | $0 | $0 | $0 | $0 | $100 | $100 | |
| Depreciation | $0 | $0 | $0 | $0 | $0 | $0 | $0 | $0 | $0 | $0 | $0 | $0 | |
| Website hosting | $30 | $30 | $30 | $30 | $30 | $30 | $30 | $30 | $30 | $30 | $30 | $30 | |
| Utilities | $0 | $0 | $0 | $0 | $0 | $0 | $0 | $0 | $0 | $0 | $0 | $0 | |
| Insurance | $0 | $0 | $0 | $0 | $0 | $0 | $0 | $0 | $0 | $0 | $0 | $0 | |
| Payroll Taxes | 0% | $0 | $0 | $0 | $0 | $0 | $0 | $0 | $0 | $0 | $0 | $0 | $0 |
| Other | $0 | $0 | $0 | $0 | $0 | $0 | $0 | $0 | $0 | $0 | $0 | $0 | |
| Total Operating Expenses | $180 | $180 | $180 | $180 | $180 | $180 | $180 | $180 | $180 | $180 | $280 | $280 | |
| Profit Before Interest and Taxes | $16 | $16 | $16 | $16 | $16 | $16 | $16 | $16 | $16 | $16 | ($84) | ($84) | |
| EBITDA | $16 | $16 | $16 | $16 | $16 | $16 | $16 | $16 | $16 | $16 | ($84) | ($84) | |
| Interest Expense | $0 | $0 | $0 | $0 | $0 | $0 | $0 | $0 | $0 | $0 | $0 | $0 | |
| Taxes Incurred | $0 | $0 | $0 | $0 | $0 | $0 | $0 | $0 | $0 | $0 | $0 | $0 | |
| Net Profit | $16 | $16 | $16 | $16 | $16 | $16 | $16 | $16 | $16 | $16 | ($84) | ($84) | |
| Net Profit/Sales | 8.00% | 8.00% | 8.00% | 8.00% | 8.00% | 8.00% | 8.00% | 8.00% | 8.00% | 8.00% | -42.00% | -42.00% | |
| Pro Forma Cash Flow | |||||||||||||
| Month 1 | Month 2 | Month 3 | Month 4 | Month 5 | Month 6 | Month 7 | Month 8 | Month 9 | Month 10 | Month 11 | Month 12 | ||
| Cash Received | |||||||||||||
| Cash from Operations | |||||||||||||
| Cash Sales | $0 | $0 | $0 | $0 | $0 | $0 | $0 | $0 | $0 | $0 | $0 | $0 | |
| Cash from Receivables | $0 | $7 | $200 | $200 | $200 | $200 | $200 | $200 | $200 | $200 | $200 | $200 | |
| Subtotal Cash from Operations | $0 | $7 | $200 | $200 | $200 | $200 | $200 | $200 | $200 | $200 | $200 | $200 | |
| Additional Cash Received | |||||||||||||
| Sales Tax, VAT, HST/GST Received | 0.00% | $0 | $0 | $0 | $0 | $0 | $0 | $0 | $0 | $0 | $0 | $0 | $0 |
| New Current Borrowing | $0 | $0 | $0 | $0 | $0 | $0 | $0 | $0 | $0 | $0 | $0 | $0 | |
| New Other Liabilities (interest-free) | $200 | $150 | $150 | $0 | $0 | $0 | $0 | $0 | $0 | $0 | $0 | $0 | |
| New Long-term Liabilities | $0 | $0 | $0 | $0 | $0 | $0 | $0 | $0 | $0 | $0 | $0 | $0 | |
| Sales of Other Current Assets | $0 | $0 | $0 | $0 | $0 | $0 | $0 | $0 | $0 | $0 | $0 | $0 | |
| Sales of Long-term Assets | $0 | $0 | $0 | $0 | $0 | $0 | $0 | $0 | $0 | $0 | $0 | $0 | |
| New Investment Received | $0 | $0 | $0 | $0 | $0 | $0 | $0 | $0 | $0 | $0 | $0 | $0 | |
| Subtotal Cash Received | $200 | $157 | $350 | $200 | $200 | $200 | $200 | $200 | $200 | $200 | $200 | $200 | |
| Expenditures | Month 1 | Month 2 | Month 3 | Month 4 | Month 5 | Month 6 | Month 7 | Month 8 | Month 9 | Month 10 | Month 11 | Month 12 | |
| Expenditures from Operations | |||||||||||||
| Cash Spending | $150 | $150 | $150 | $150 | $150 | $150 | $150 | $150 | $150 | $150 | $150 | $150 | |
| Bill Payments | $1 | $34 | $34 | $34 | $34 | $34 | $34 | $34 | $34 | $34 | $37 | $134 | |
| Subtotal Spent on Operations | $151 | $184 | $184 | $184 | $184 | $184 | $184 | $184 | $184 | $184 | $187 | $284 | |
| Additional Cash Spent | |||||||||||||
| Sales Tax, VAT, HST/GST Paid Out | $0 | $0 | $0 | $0 | $0 | $0 | $0 | $0 | $0 | $0 | $0 | $0 | |
| Principal Repayment of Current Borrowing | $0 | $0 | $0 | $0 | $0 | $0 | $0 | $0 | $0 | $0 | $0 | $0 | |
| Other Liabilities Principal Repayment | $0 | $0 | $0 | $0 | $0 | $0 | $0 | $0 | $0 | $0 | $0 | $0 | |
| Long-term Liabilities Principal Repayment | $0 | $0 | $0 | $0 | $0 | $0 | $0 | $0 | $0 | $0 | $0 | $0 | |
| Purchase Other Current Assets | $0 | $0 | $0 | $0 | $0 | $0 | $0 | $0 | $0 | $0 | $0 | $0 | |
| Purchase Long-term Assets | $0 | $0 | $0 | $0 | $0 | $0 | $0 | $0 | $0 | $0 | $0 | $0 | |
| Dividends | $0 | $0 | $0 | $0 | $0 | $0 | $0 | $0 | $0 | $0 | $0 | $0 | |
| Subtotal Cash Spent | $151 | $184 | $184 | $184 | $184 | $184 | $184 | $184 | $184 | $184 | $187 | $284 | |
| Net Cash Flow | $49 | ($27) | $166 | $16 | $16 | $16 | $16 | $16 | $16 | $16 | $13 | ($84) | |
| Cash Balance | $49 | $22 | $188 | $204 | $220 | $236 | $252 | $268 | $284 | $300 | $312 | $228 | |
| Pro Forma Balance Sheet | |||||||||||||
| Month 1 | Month 2 | Month 3 | Month 4 | Month 5 | Month 6 | Month 7 | Month 8 | Month 9 | Month 10 | Month 11 | Month 12 | ||
| Assets | Starting Balances | ||||||||||||
| Current Assets | |||||||||||||
| Cash | $0 | $49 | $22 | $188 | $204 | $220 | $236 | $252 | $268 | $284 | $300 | $312 | $228 |
| Accounts Receivable | $0 | $200 | $393 | $393 | $393 | $393 | $393 | $393 | $393 | $393 | $393 | $393 | $393 |
| Other Current Assets | $0 | $0 | $0 | $0 | $0 | $0 | $0 | $0 | $0 | $0 | $0 | $0 | $0 |
| Total Current Assets | $0 | $249 | $415 | $581 | $597 | $613 | $629 | $645 | $661 | $677 | $693 | $706 | $622 |
| Long-term Assets | |||||||||||||
| Long-term Assets | $0 | $0 | $0 | $0 | $0 | $0 | $0 | $0 | $0 | $0 | $0 | $0 | $0 |
| Accumulated Depreciation | $0 | $0 | $0 | $0 | $0 | $0 | $0 | $0 | $0 | $0 | $0 | $0 | $0 |
| Total Long-term Assets | $0 | $0 | $0 | $0 | $0 | $0 | $0 | $0 | $0 | $0 | $0 | $0 | $0 |
| Total Assets | $0 | $249 | $415 | $581 | $597 | $613 | $629 | $645 | $661 | $677 | $693 | $706 | $622 |
| Liabilities and Capital | Month 1 | Month 2 | Month 3 | Month 4 | Month 5 | Month 6 | Month 7 | Month 8 | Month 9 | Month 10 | Month 11 | Month 12 | |
| Current Liabilities | |||||||||||||
| Accounts Payable | $0 | $33 | $33 | $33 | $33 | $33 | $33 | $33 | $33 | $33 | $33 | $130 | $130 |
| Current Borrowing | $0 | $0 | $0 | $0 | $0 | $0 | $0 | $0 | $0 | $0 | $0 | $0 | $0 |
| Other Current Liabilities | $0 | $200 | $350 | $500 | $500 | $500 | $500 | $500 | $500 | $500 | $500 | $500 | $500 |
| Subtotal Current Liabilities | $0 | $233 | $383 | $533 | $533 | $533 | $533 | $533 | $533 | $533 | $533 | $630 | $630 |
| Long-term Liabilities | $0 | $0 | $0 | $0 | $0 | $0 | $0 | $0 | $0 | $0 | $0 | $0 | $0 |
| Total Liabilities | $0 | $233 | $383 | $533 | $533 | $533 | $533 | $533 | $533 | $533 | $533 | $630 | $630 |
| Paid-in Capital | $50 | $50 | $50 | $50 | $50 | $50 | $50 | $50 | $50 | $50 | $50 | $50 | $50 |
| Retained Earnings | ($50) | ($50) | ($50) | ($50) | ($50) | ($50) | ($50) | ($50) | ($50) | ($50) | ($50) | ($50) | ($50) |
| Earnings | $0 | $16 | $32 | $48 | $64 | $80 | $96 | $112 | $128 | $144 | $160 | $76 | ($8) |
| Total Capital | $0 | $16 | $32 | $48 | $64 | $80 | $96 | $112 | $128 | $144 | $160 | $76 | ($8) |
| Total Liabilities and Capital | $0 | $249 | $415 | $581 | $597 | $613 | $629 | $645 | $661 | $677 | $693 | $706 | $622 |
| Net Worth | $0 | $16 | $32 | $48 | $64 | $80 | $96 | $112 | $128 | $144 | $160 | $76 | ($8) |


